


ABSTRACT
Number of vertebrae is associated with body size and meat productivity in pigs. The aim of this study was to identify QTL and associated positional candidate genes affecting the number of thoracic vertebrae (THO). A genomewide association study was conducted in a large resource population derived from an F2 intercross between Landrace and Korean native pigs using the Porcine SNP 60K BeadChip and the genomewide complex trait analysis (GCTA) program based on a linear mixed-effects model. A total of 38,385 SNP markers from 1,105 F2 progeny were analyzed for the THO trait after filtering for quality control. A total of 90 genomewide significant SNP markers (P < 1.30 × 10⁻⁶) on SSC 7 covering a 20-Mb region were identified for THO in this study. Several previous studies also mapped QTL for vertebral numbers in this region. The strongest association signals were detected at ASGA0035500 (P-value = 4.46 × 10−40; 103,574,383 bp) and DIAS0000795 (P-value = 4.46 × 10−40; 103,594,753 bp). The QTL region on SSC 7 for THO encompasses VRTN and LTBP2, which are previously described candidate genes for vertebral number variation. To refine the QTL region, a haplotype-based linkage and linkage disequilibrium (LALD) analysis using the DualPHASE program was applied because subsequent conditional association and haplotype block analyses could not resolve the region that contains the 2 loci. The LALD analysis refined the critical region to a 533.9-kb region including LTBP2; VRTN was located outside the critical region. The LTBP2 gene encoding latent transforming growth factor beta binding protein 2 is involved in bone metabolisms. Based on these data, we propose LTBP2 as a positional candidate gene for THO in pigs. After further functional studies and verification of the association in other independent populations, these results could be useful for optimizing breeding programs that improve THO and other economically important traits in pigs.
INTRODUCTION
The vertebrae consist of cervical, thoracic, lumbar, sacral, and caudal vertebrae in pigs. Among these, the number of thoracic vertebrae (THO) is most variable and related to body size (Shaw, 1929). Therefore, vertebral numbers including THO can be related to pork production, fatness-related traits, and reproductive performance. Most likely due to strong selective breeding for pork production, European pig breeds have more vertebral numbers (20 to 23) than unselected wild boars (19; King and Roberts, 1960).
To date in pigs, 2 major QTL on SSC 1 and 7 for number of vertebrae have been identified using genomewide linkage analyses (Mikawa et al., 2005; Ren et al., 2012). Fine mapping of the QTL on SSC 1 provided evidence that NR6A1 affected vertebral number (Mikawa et al., 2007). In the case of the QTL on SSC 7, VRTN was identified as a strong positional candidate gene for vertebral number (Mikawa et al., 2011). The results of a genomewide association study (GWAS) for vertebral number also confirmed the location of the QTL on SSC 7 (Fan et al., 2013; Sato et al., 2016; Zhang et al., 2016). Fan et al. (2013) reported that SNP in VRTN were associated with vertebral numbers in an F2 intercross population between White Duroc and Erhualian pigs. After their GWAS, however, Zhang et al. (2016) proposed LTBP2, which encodes latent transforming growth factor beta binding protein 2, as a strong positional candidate gene because of its relationship with number of ribs in knock-out mice via growth differentiation factor 11 (Lee et al., 2010). Hence, it is necessary to perform additional and independent analyses to refine this genome region because the distance between the 2 genes is only approximately 133 kb.
The aim of this study was to refine the QTL region that is associated with THO based on GWAS as well as a joint linkage and linkage disequilibrium (LALD) analysis in a large F2 intercross population between Landrace and Korean native pigs (KNP) on Jeju Island.
MATERIALS AND METHODS
Animals and Phenotype
We generated a large F2 resource population by intercrossing between Landrace and KNP on Jeju Island. Seventeen purebred Landrace pigs were mated with 19 purebred KNP to produce 91 F1 animals. Previously, Cho et al. (2013) reported that the mean of THO in KNP (n = 21) was 14.71 (SE 0.19), whereas the mean of THO in Landrace pigs (n = 43) was 15.63 (SE 0.12). The F1 animals were intercrossed to produce 1,105 F2 animals (568 males and 537 females). Detailed information about breeding and rearing conditions is described elsewhere (Cho et al., 2011). The THO obtained from each of the carcasses were recorded. The F2 progeny had 14 (n = 103), 15 (n = 618), 16 (n = 331), and 17 (n = 17) THO with a mean of 15.25 (SE 0.16). The Animal Care Committee at Jeju National University (Jeju, Republic of Korea) approved the experimental procedures.
Single Nucleotide Polymorphism Data and Single-Marker Genomewide Association Study
Genomic DNA was isolated from blood according to a standard sucrose–proteinase K method. Genotyping was performed using the Porcine SNP 60K BeadChip technology (Illumina, Inc., San Diego, CA), which contained 61,565 SNP across the whole genome. The SNP were then filtered with using specific criteria (minor allele frequency < 5%, genotype call rate < 90%, and P-value of χ2 test for Hardy–Weinberg equilibrium errors ≤ 0.000001). Mendelian inconsistencies in the F2 pedigree were examined using the SNP marker information. These quality control procedures were performed using PLINK version 1.07 (Purcell et al., 2007). A total of 38,385 SNP markers on autosomes remained and were used for further analyses.
For GWAS with the adjustment of the familial relatedness within the F2 intercross, a single-marker association was performed using the genomewide complex trait analysis (GCTA) program (Yang et al., 2011). The following linear mixed model was used to assess the association between SNP markers and THO:

in which y is the vector of THO; b is the vector of fixed effects including the mean, sex, and batch; a is the SNP marker effects; u is the vector of random additive effects following a distribution u ∼ N(0, Gσa2), in which G is the genomic relationship matrix that was constructed using the 38,385 SNP markers and σa2 is the additive genetic variance; e is a vector of random residual following a distribution e ∼ N(0, Iσe2), in which I is identity matrix and σe2 is the residual variance; Za is the incidence matrix for a; and X and Zu are the incidence matrices for b and u. Bonferroni-adjusted significant (i.e., 0.05/38,385 SNP = 1.30 × 10⁻⁶) and suggestive (i.e., 1/38,385 SNP = 2.61 × 10⁻⁵) thresholds were calculated to correct for multiple comparison issues of the GWAS.
Genotyping of Candidate Variants inVRTNandLTBP2
Genotypes were screened for VRTN g.20311_20312ins291 according to Mikawa et al. (2011). The VRTN fragments were amplified using specific primers and separated on 1.5% agarose gels. The alleles were determined by presence/absence pattern of a 291-bp short interspersed nuclear element (PRE1) in PCR products. To obtain sequence information for genotyping of LTBP2, reference nucleotide sequences were obtained from the Pig Genome Project (ENSSSCG00000002368, 7:103590368-103694062:-1; Sscrofa 10.2) in the Ensembl database (http://www.ensembl.org/index.html; accessed 29 Mar. 2017) and used for PCR primer design. All PCR primers for amplification of the LTBP2 gene are shown in Supplementary Table S1 (see the online version of the article at http://journalofanimalscience.org). We identified a nonsynonymous variant (i.e., c.4481A>C) within LTBP2. Polymerase chain reaction and pyrosequencing to genotype LTBP2 c.4481A>C were performed using a new primer set (LTBP2e32F: 5′-GGA AAC TGA GGC AAG GAG AA-3′ and LTBP2e32R: 5′-biotin-TGT CCT CAC CCT CAC ACT TG-3′) and a mini sequencing primer (LTBP2_mini: 5′-CGA GTG TGT GAT GTT CGG GC-3′) according to the manufacturer's guide (Biotage AB, Uppsala, Sweden).
Joint Linkage and Linkage Disequilibrium Analysis for Quantitative Trait Loci Fine Mapping
Fine mapping of QTL for THO was performed by jointly exploiting linkage and linkage disequilibrium using a haplotype-based approach: 1) CRI-MAP version 2.503, developed by Ian Evans and Jill Maddox (http://www.animalgenome.org/bioinfo/tools/share/crimap; accessed 29 Mar. 2017), was used to establish the genetic linkage map of SSC 7 using 998 SNP markers; 2) ancestral haplotypes were reconstructed using the DualPHASE program (Druet and Georges, 2010), which combines linkage and linkage disequilibrium information in a hidden Markov model setting (a total of 20 ancestral haplotype clusters (K = 20) were used); and 3) the haplotypes were incorporated into the following linear mixed-effect model:

in which y is the vector of THO; b is a vector of fixed effects (the mean, sex, and batch); h is the vector of the 20 ancestral haplotype random effects following a distribution h ∼ N(0, I20σh2), in which I20 is an identity matrix and σh2 is the ancestral haplotype variance; u is the vector of random individual polygenic effects following a distribution u ∼ N(0, Aσa2), in which A is the numeric relationship matrix and σa2 is the additive polygenic variance; and e is the vector of random residuals following a distribution e ∼ N(0, Iσe2), in which I is an identity matrix σe2 is the residual variance. Each effect is associated to phenotypic records using incidence matrices (X, Zh, and Zu). To test for presence of QTL at each map position, likelihood ratio (LR) tests were performed using the QxPAK version 5.05 program (Pérez-Enciso and Misztal, 2011). A 5-logarithm of odds (LOD) drop support interval was used to estimate the confidence interval on the location of the QTL. Unless otherwise stated, P-values are nominal.
RESULTS AND DISCUSSION
Single-Marker Genomewide Association Study
In the GWAS, a total of 90 SNP were significantly associated with THO. Interestingly, all the significantly associated SNP markers were located on SSC 7 (Fig. 1A). In addition to these significant SNP markers, a total of 66 suggestive SNP markers for THO were identified on SSC 7. The genomic location of these significant and suggestive SNP markers ranged from 71.1 to 111.9 Mb (a region of approximately 40.8 Mb). This large range can be explained by extensive linkage disequilibrium over relatively large distances in F2 populations. Nevertheless, the strongest association signal was detected at ASGA0035500 (P-value = 4.46 × 10−40) and DIAS0000795 (P-value = 4.46 × 10−40). The ASGA0035500 is located within NPC2, which has no clear relevance to THO variation in pigs. On the other hand, DIAS0000795 is a variant located within LTBP2, which has been previously proposed as a candidate gene for THO in pigs (Zhang et al., 2016). Adjacent to DIAS0000795 is the VRTN gene, which has also been proposed as a candidate gene for THO (Mikawa et al., 2011; Fan et al., 2013).
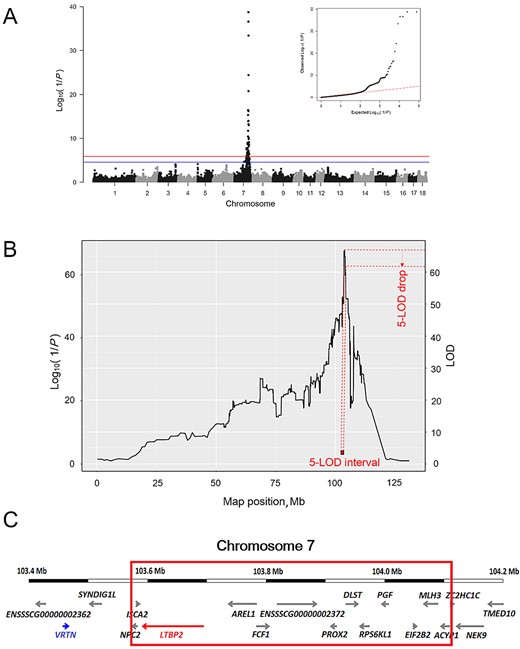
Genomewide association study (GWAS) and reduction of the QTL support interval by linkage and linkage disequilibrium analysis. (A) Manhattan plot and quantile–quantile plot of GWAS results for association of SNP with the number of thoracic vertebrae (THO). The y-axis shows the log10(1/P), and the x-axis shows the physical positions of SNP on the pig chromosome. The genomewide significant and suggestive thresholds are represented by red and blue colors, respectively. (B) Linkage and linkage disequilibrium profile for THO on SSC 7. The left y-axis shows the log10(1/P), and the right y-axis shows the logarithm of odds (LOD) score. The x-axis shows the physical positions of SNP on SSC 7. The red rectangle represents the critical 533.9-kb region estimated by the 5-LOD drop method. (C) Ensembl protein coding genes (http://www.ensembl.org/index.html; accessed 29 Mar. 2017) in the genomic region on SSC 7 encompassing from 103.4 to 104.2 Mb. The red box represents the critical 533.9-kb region. The red arrow represents LTBP2; the blue arrow represents VRTN.
To evaluate the effects of VRTN and LTBP2 on THO, we identified and genotyped a nonsynonymous variant (i.e., c.4481 A>C) within LTBP2. This SNP causes AA substitution (i.e., His1494Pro). In addition, VRTN g.20311_20312ins291 was genotyped in the F2 intercross (Mikawa et al., 2011). Subsequently, an additional GWAS including the genotype information of VRTN g.20311_20312ins291 and LTBP2 c.4481 A>C was conducted. The GWAS results showed that the effects of the 2 genes on THO were very similar; the P-value of VRTN was slightly lower than that of LTBP2, whereas the additive effect and the proportion of genetic variance explained by the SNP of LTBP2 were slightly higher than those of VRTN (Table 1).
Association of VRTN and LTBP2 with the number of thoracic vertebrae (THO) in a Landrace × Korean native pig intercross population
| Trait1 | Genotype (VRTN and LTBP2) | Effect2 (SE) | Var %3 | P-value4 | ||
|---|---|---|---|---|---|---|
| VRTN g.20311_20312ins291 | ||||||
| 1/1 (244)5 | 1/2 (523)5 | 2/2 (337)5 | ||||
| THO | 15.73 (0.06)a | 15.26 (0.05)b | 14.78 (0.05)c | 0.42 (0.03) | 38.7 | 2.38 × 10−37 |
| LTBP2 c.4481 A>C | ||||||
| A/A (270)5 | A/C (553)5 | C/C (278)5 | ||||
| THO | 14.75 (0.06)a | 15.20 (0.05)b | 15.67 (0.06)c | 0.43 (0.03) | 41.7 | 2.40 × 10−37 |
a–cValues within a row with different superscripts differ (P < 0.001).
1Predicted genotypic values (SE) for THO computed using the predict option implemented in ASReml program (VSN international Ltd., Hemel Hempstead, UK) are presented.
2Allelic substitution effect estimated by the genomewide complex trait analysis (GCTA) program (Yang et al., 2011).
3Var % = the percentage of genetic variance explained by the SNP estimated by following equation: Var % = [2p(1 − p)a2/σg2] × 100, in which p is the minor allele frequency of the SNP, a is the estimated allelic effect of the SNP, and σg2 is the additive genetic variance for THO estimated by the ASReml program.
4Nominal P-value calculated by the GCTA program.
5Numbers in the parentheses indicate the total number of F2 progeny counted per genotype.
As shown in the LR tests in Supplementary Table S2 (see the online version of the article at http://journalofanimalscience.org), a conditional association analysis with VRTN g.20311_20312ins291 as a fixed effect revealed that the significant association signal for THO in the LTBP2 locus still remained (LR = 23.5, P-value = 1.28 × 10⁻⁶). Additionally, a conditional association analysis with LTBP2 c.4481 A>C as a fixed effect demonstrated that the significant association signal for THO in the VRTN locus still remained (LR = 27.6, P-value = 1.48 × 10⁻⁷). The size of this region including the 2 genes was approximately 237 kb (103,457,506–103,694,062 bp) and contained 5 SNP markers. Haplotype block analysis using the Haploview program (Barrett et al., 2005) suggested that there is only 1 haplotype block within the 237-kb region (data not shown). Therefore, single-marker GWAS, conditional association analyses, and haplotype block analysis did not refine the region that contains the 2 genes.
Haplotype-Based Linkage and Linkage Disequilibrium Analysis
To perform high-resolution QTL analysis, we applied the LALD analysis by reconstructing ancestral haplotypes using 998 SNP markers on SSC 7. The resolution of our QTL mapping was high. Therefore, we used a 5-LOD drop method for estimating a support interval of the QTL for THO. We defined the support interval of the QTL for THO as a 533.9-kb region that was flanked by ASGA0035500 (103,574,383 bp) and ASGA0035536 (104,108,293 bp; Fig. 1B). This critical region is exactly colocalized to the previously reported 951-kb region for THO flanked by DIAS0000795 and ALGA0108658 in an intercross between Large White and Minzhu (Zhang et al., 2016). It is noteworthy that single-marker GWAS and haplotype-based LALD approaches revealed the highest test statistics at the same location. The GWAS profile for THO was maximized at 103,574,383 to 103,594,753 bp (P-value = 4.46 × 10−40) and the test statistic from the haplotype-based LALD analysis was 103,723,905 to 103,866,076 bp (P-value = 2.25 × 10−68). The test statistic score of LALD analysis was obviously higher than that of GWAS. This could be explained by 2 different reasons: 1) although the 2 approaches are based on linear mixed-effects model, the effect of ancestral haplotypes in the LALD analysis was incorporated as random whereas the effect of SNP markers in the GWAS was regarded as fixed, and 2) GWAS uses only linkage disequilibrium whereas LALD analysis jointly exploits linkage and linkage disequilibrium information.
Based on the high-resolution QTL data, this critical 533.9-kb region on SSC 7 encompasses 12 annotated genes (i.e., MLH3, ACYP1, NPC2, ISCA2, LTBP2, AREL1, FCF1, PROX2, DLST, RPS6KL1, PGF, and EIF2B2) in the Sscrofa 10.2 genome data set (http://www.ensembl.org/index.html; accessed 29 Mar. 2017). Among the 12 genes, LTBP2 was the most interesting positional candidate gene that is related to THO. It is also noteworthy that the VRTN gene was located outside the critical region constructed by the haplotype-based LALD analysis (Fig. 1C).
LTBP2as a Positional Candidate Gene for Thoracic Vertebrae Number in Pigs
The latent transforming growth factor β binding protein 2 (LTBP2) gene is located in the vicinity of the VRTN gene on SSC 7 and encodes an extracellular matrix (ECM) protein that is a member of a superfamily composed of 3 fibrillins and latent TGF-beta binding (LTBP) proteins (Moren et al., 1994). LTBP2 is also known as a mediator of osteogenic differentiation, the ECM network, and cell adhesion (Dallas et al., 1995; Vehviläinen et al., 2009; Haji-Seyed-Javadi et al., 2012). Of the many LTBP proteins, only LTBP2 does not covalently interact with TGFβ, which are multifunctional cytokine mediators of many biological processes, including the production of ECM proteins (e.g., collagen, fibronectin, and elastin). Cell interactions with ECM components are involved in the regulation of events during both embryo- and organogenesis as well as during later stages of life (Gumbiner, 1996; Oklü and Hesketh, 2000). LTBP2 knock-out mice show early embryonic lethality differing from the phenotypes of all TGFβ gene knockout mice, indicating that LTBP2 has important functions not related to TGFβ metabolism (Shull et al., 1992; Sanford et al., 1997; Shipley et al., 2000); the LTBP2 gene has been proposed as a candidate gene for bone mineral density variation and fracture etiology (Cheung et al., 2008).
In summary, we performed a GWAS and LALD analysis for THO in a large Landrace × KNP F2 intercross population and detected a major QTL for THO on SSC 7, which confirms the results from previous genomewide linkage and association studies. The critical region was refined to the 533.9-kb region, and LTBP2 was identified as a positional candidate gene associated with THO. After further functional studies and validation of the association in other independent populations, this result could be useful to optimize breeding programs that improve THO and other economically important traits in pigs.
LITERATURE CITED
Footnotes
This study was supported by 2017 Postdoctoral Fellowship Program of National Institute of Animal Science, Rural Development Administration, Republic of Korea. This work was also supported by a grant from Rural Development Administration (number PJ01010502), Republic of Korea.
Author notes
These authors equally contributed to this work. Hence, they should be regarded as co-first authors.
