


ABSTRACT
The aims of this study were 1) to investigate the potential application of near-infrared spectroscopy (NIRS) to predict intramuscular fat (IMF) and fatty acid (FA) composition of individual meat samples, 2) to estimate heritability of IMF and FA NIRS-based predictions, and 3) to assess the statistical relevance of the genetic background of such predictions by using the Bayes factor (BF) procedure. Young Piemontese bulls (n = 1,298) were raised and fattened on 124 farms, and slaughtered at the same commercial abattoir. Intramuscular fat content and FA composition were analyzed on a random subset of 148 samples of minced and homogenized longissimus thoracis muscle. Near-infrared spectroscopy spectra were collected on all samples (n = 1,298) in reflectance mode between 1,100 and 2,498 nm (every 2 nm) using fresh minced meat samples. Calibration models developed from the random subset of 148 samples were used to predict IMF and FA contents of the remaining 1,150 samples. Intramuscular fat content and FA predictions were analyzed under a Bayesian univariate animal linear models, and the statistical relevance of heritability estimates was assessed through BF; the model with polygenic additive effects was favored when BF > 1. In general, satisfactory results (R2 > 0.60) were obtained for 6 out of the 8 major FA (C14:0, C:16:0, C16:1, C18:0, C18:1n-9 cis/trans, and C18:1n-11 trans), 6 out of the 19 minor FA (C10:0, C12:0, C17:0, C17:1, C18:2 cis-9,trans-11, and C20:2), and the total SFA, MUFA, and PUFA. Bayes factors between models with and without a genetic component provided values greater than 1 for IMF, C14:0, C16:0, C18:1n-9 cis/trans, C17:0, C17:1, C20:2, SFA, MUFA, and PUFA. The greatest BF was reached by C20:2 (BF >10), suggesting strong evidence of genetic determinism, whereas IMF, C18:1n-9 cis/trans, C17:0, C17:1, MUFA, and PUFA showed substantial evidence favoring the numerator model (3.16 < BF < 10). Point estimates of heritabilities for FA predicted by NIRS were low to moderate (0.07 to 0.21). Results support that NIRS is a useful technique to satisfactorily predict some FA of meat. The existence of an important genetic determinism affecting FA profile has been confirmed, suggesting that FA composition of meat can be genetically modified.
INTRODUCTION
The fatty acid (FA) composition of intramuscular fat (IMF) influences the technological and sensory quality of meat (Wood et al., 2004) and contributes largely to the nutritional value of the product (Wood et al., 2008). Intramuscular fat content and composition of ruminants depend on several factors, such as feeding regimen (Aharoni et al., 1995; Noci et al., 2007), n-3 and n-6 addition (Herdmann et al., 2010), CLA supplementation (Schiavon et al., 2010), and age and BW (Link et al., 1970; Maltin et al., 1998). Also, FA composition is influenced by breed or breed type (Malau-Aduli et al., 1998; Perry et al., 1998; Bressan et al., 2011), and additive genetic factors (Oka et al., 2002; Pitchford et al., 2002; Nogi et al., 2011). However, large-scale recording of individual FA information is critical because the available techniques are time-consuming, and as yet, no high-throughput automated measuring device has been developed.
Near-infrared spectroscopy (NIRS) is being increasingly used in food analysis because it provides fast, nondestructive, and cost-effective measurements (Sierra et al., 2008). In meat, NIRS technology has been used to determine chemical composition (Alomar et al., 2003; Barlocco et al., 2006; Sun et al., 2011) and quality traits (Hoving-Bolink et al., 2005; Cecchinato et al., 2011). Near-infrared spectroscopy has also been applied to determine FA profile in pig fat (De Pedro et al., 1992) and beef (Sierra et al., 2008). However, no studies dealing with the application of NIRS on IMF and FA profile of beef meat for genetic purposes are currently available in the literature.
Therefore the objectives of this study were 1) to evaluate the potential of NIRS to predict FA composition using individual meat samples, 2) to estimate heritabilities of these traits, and 3) to assess their statistical relevance through the Bayes factor (BF) test developed by García-Cortés et al. (2001) and Varona et al. (2001).
MATERIALS AND METHODS
Animal Care and Use Committee approval was not obtained for this study because the data were from an existing database; the analyzed records were collected after slaughtering of animals in a commercial abattoir (Carrù, Piemonte, Italy) from March 2005 to February 2007. The authors did not have direct control over the care of the animals included in this study.
Animals and Data
The study was carried out on 1,298 Piemontese young bulls marketed with the protected label of “Vitellone Piemontese della Coscia.” Animals were fattened on 124 farms and slaughtered at the same commercial slaughterhouse from March 2005 to February 2007 (average age at slaughter of 523 ± 73 d). Young bulls were progeny of 109 AI purebred sires and 1,170 dams, all of them registered in the Italian Piemontese herdbook. Pedigree information was supplied by the National Association of Piemontese Breeders (Carrù, Italy) and included animals owning phenotypic records for the investigated traits and all their known ancestors. Each animal with phenotypic records had at least 4 known ancestors in the pedigree file (10,050 records). Sire-offspring relationships were ascertained through DNA testing based on 19 microsatellites (Budowle et al., 2005).
Twenty-four hours after slaughter, individual samples of the longissimus thoracis muscle were collected between the 5th and 6th thoracic vertebra. After measurement of pH, samples were weighed, individually vacuum-packaged, and transferred to the meat laboratory of the Department of Animal Science of the University of Padova (Legnaro, Italy) using a portable cooler (4°C). Upon arrival, samples were stored at 4°C in a chilling room until measurement of beef quality traits. Full details on animals and data collection are reported in Boukha et al. (2011) and Cecchinato et al. (2011).
IMF and FA Analysis
Intramuscular fat content of beef was analyzed by extraction with petroleum ether on a random subset of 148 samples of minced and homogenized longissimus thoracis muscle in accordance to AOAC (2000), whereas FA composition was performed on lipids extracted according to the method of Folch et al. (1957). Briefly, 5 g of homogenized sample was blended twice with extraction solvent chloroform/methanol (1:2, vol/vol), filtered, placed in separator funnels, and mixed with saline solution (0.88% KCl). After separation in 2 phases, the methanol aqueous fraction was discarded, and the lipid chloroform fraction washed with distilled water/methanol (1:1, vol/vol). After a further filtration and evaporation by means of a rotary evaporator, lipid extracts were prepared for trans-esterification in n-heptane according to Christie (1982), modified by Chouinard et al. (1999), and transferred to test tubes for subsequent gas chromatographic analysis, performed on a Thermo Quest instrument (model 8000 Series Top, Milan, Italy) equipped with a HP 88 fuse silica capillary column (Agilent Technologies, Santa Clara, CA). The column was 100 m in length with an inner diameter of 0.25 mm and film thickness of 0.2 μm. Oven temperatures were initially 100°C for 5 min and then increased at 4°C/min up to 218°C and held for 4 min. The temperature of injector and detector was kept at 250°C. Hydrogen was the carrier gas and flowed at 2.68 mL/min. The pressure of hydrogen and airflow was set at 75 and 110 kPa, respectively. Identification and quantification of peaks was made by comparison with commercial methyl esters standards (Nu-Chek Prep, Elysian, MN). A methyl nonadecanoatemethyl solution with 1 mg/L in hexane was used as internal standard. Unidentified peaks represent 1.9% of total chromatographic areas.
Saturated fatty acids were the sum of C10:0, C12:0, C14:0, C15:0, C16:0, C17:0, C18:0, C20:0, C22:0, and C23:0. Monounsaturated fatty acids were the sum of C14:1, C16:1, C17:1, C18:1n-9 cis/trans, C18:1n-11 trans, C20:1n-9, and C22:1n-9. Polyunsaturated fatty acids were the sum of C18:2n-6 cis/trans, C20:2, C18:3n-6, C18:3n-3, C20:3n-6, C20:3n-3, C20:4n-6, C20:5n-3, C22:6n-3; the identified CLA isomer was C18:2 cis-9,trans-11.
NIRS Acquisition
Measurements of the NIRS spectra were performed using a Foss NIRSystems 5000 (Foss Electric A/S, Hillerød, Denmark) with small ring cup cells. Spectra were collected in duplicate on all samples (n = 1,298) in reflectance (R) mode between 1,100 and 2,498 nm (every 2 nm) using fresh minced meat, averaged, transformed to absorbance log(1/R), and stored for subsequent statistical analysis. The calibration data set used to develop IMF and FA calibration equations was based on 148 samples on which IMF and FA content were determined in the laboratory with gas chromatographic analysis.
Statistical Analysis
Multivariate Data Analysis and Predictive Ability of NIRS.
Data consisted of a calibration-test set of 148 samples with IMF and FA reference and spectra information used for the development and the validation of NIRS calibrations, which were then used on a population spectra data set of 1,150 records for the genetic analysis. Partial least squares regressions (software Unscrambler, v.9.6, Camo A/S, Oslo, Norway) were used to establish calibration models (Hubert and Van den Branden, 2003). Partial least squares regressions have been previously used to estimate correlations between reference data and values predicted from spectral information in meat (Prieto et al., 2009; De Marchi et al., 2011) and milk (Soyeurt et al., 2006; De Marchi et al., 2009). Prediction models were validated using a 4-fold random cross-validation, thus dividing the calibration-test set in 4 folds, using one of them (37 samples) to check the results (prediction models) and the remaining 3 to develop the calibration models. The process was repeated until all folds had been used for validation once according to Naes et al. (2002).
The analysis was carried out using several scattering corrections (e.g., multiplicative scatter correction) and different mathematical treatments (e.g., first and second derivative spectra). The results did not produce significant improvement in the accuracy of prediction models; therefore, all prediction equations were developed using untreated data (absorbance spectra).
To determine the proficiency of predictive models the root mean square error of cross-validation (RMSECV) and the coefficient of determination of cross-validation (R2CV) were used (Hubert and Vanden Branden, 2003). The ratio performance deviation (RPD), obtained by dividing the SD and the RMSECV of a given FA, was also calculated to provide indications on the practical utility of predictive models. According to Sinnaeve et al. (1994) and Karoui et al. (2006), good predictions have a RPD greater than 2.
Following the approach of Soyeurt et al. (2006), for the genetic analysis we considered only calibration equations with R2CV equal or greater than 0.60. The calibration equations enabled prediction of IMF, C10:0, C12:0, C14:0, C16:0, C16:1, C17:0, C17:1, C18:0, C18:1n-9 cis/trans, C18:1n-11 trans, C18:2 cis-9,trans-11, C20:2, SFA, MUFA, and PUFA, and were then used to predict IMF and FA contents of the remaining 1,150 samples used for the genetic analysis.
Nongenetic Effects.
Nongenetic effects to be included in mixed models to estimate heritability of predicted IMF and FA on 1,150 samples (i.e., the spectra data set) were from preliminary analyses based on the GLM procedure (SAS Inst. Inc., Cary, NC). For all traits, the ANOVA accounted for the effects of the fattening herd (124 levels), the week of laboratory analysis (92 wk) and the carcass weight (CW; class 1: less than 387 kg; class 2: from 387 to 410 kg; class 3: from 411 to 430 kg; class 4: from 431 to 450 kg; class 5: from 451 to 474 kg; class 6: more than 474 kg).
Univariate Model for Testing the Hypothesis of Additive Genetic Determination.
Linear mixed model analyses were performed on 1,150 NIRS-based predictions of IMF and FA profile. The following animal model was used:

where the jth observation (yhklij) of animal i was explained by the effect of the hth class of CW, the kth effect of fattening herd (HERD), the lth week of laboratory analysis (WLA), and the additive genetic (ai) effects of animal i. Finally, ehklij was a random residual term.
The statistical relevance of the heritability parameter was evaluated through the BF (García-Cortés et al., 2001; Varona et al., 2001; Casellas et al., 2010; see Appendix for a comprehensive description of the BF approach). Note that BF is the ratio of the posterior probabilities of 2 competing models, taking any positive value between >0 and +∞. In this case, a linear mixed model with additive polygenic effects (numerator model) was compared against a model without additive polygenic effects (denominator model), where greater-than-1 BF favored the numerator model and less-than-1 BF favored the denominator model. In this report, the BF results were discussed within the context of the Jeffreys (1984) discrete scale of evidences. This scale classifies the BF according to 6 different levels of evidence for the numerator model, objectively classifying the BF as denominator model supported, not worth more than a bare mention, substantial evidence, strong evidence, very strong evidence, and decisive evidence (see Appendix). From now on, this terminology will be systematically used when referring to the BF. For each analysis, a unique chain with 100,000 iterations was launched, after discarding the first 10,000 elements as burn-in. Convergence was evaluated by visual inspection after plotting the Markov chain Monte Carlo sampled values for all variance components across iterations. Moreover, the Raftery and Lewis (1992) approach was used to objectively evaluate the convergence and length of the burn-in period on the variance component parameters. For all traits and variances, convergence was guaranteed with less than 10,000 iterations. The analyses were implemented in a FORTRAN90 program.
RESULTS
Means and Phenotypic Variation
Descriptive statistics of calibration-test set (n = 148) and spectra data set (n = 1,150) are presented in Tables 1 and 2, respectively. Means and CV of FA profile for the longissimus thoracis samples of calibration set were comparable with the test set. Fatty acid profile was organized as major (>1% of identified FA) and minor (<1% of identified FA) acids, being expressed as grams per 100 g of fresh minced (FM) meat and milligrams per 100 g of FM meat, respectively. The 8 major FA accounted for more than 77% of the total lipid content. Most of them showed a broad range of variability, especially C14:0 and C16:1. For the FA categories, the sample set was found to encompass a wide variability of both SFA and MUFA (as the main components of IMF), whereas CV of PUFA was relatively low.
Fitting statistics of prediction models of intramuscular fat (IMF), individual fatty acids, and fatty acid categories (calibration-test set, n = 148)
| Item1 | Mean | SD | R2CV2 | RMSECV3 | L#4 | RPD5 |
|---|---|---|---|---|---|---|
| IMF, g/100 g of FM* | 2.164 | 1.184 | 0.819 | 0.557 | 8 | 2.13 |
| Major fatty acids, g/100 g of FM | ||||||
| C14:0* | 0.038 | 0.028 | 0.783 | 0.014 | 8 | 2.04 |
| C16:0* | 0.469 | 0.287 | 0.828 | 0.135 | 8 | 2.12 |
| C16:1* | 0.037 | 0.028 | 0.820 | 0.014 | 6 | 2.01 |
| C18:0* | 0.429 | 0.244 | 0.712 | 0.138 | 9 | 1.77 |
| C18:1n-9 cis/trans* | 0.666 | 0.445 | 0.804 | 0.221 | 7 | 2.00 |
| C18:1n-11 trans* | 0.068 | 0.041 | 0.700 | 0.022 | 6 | 1.76 |
| C18:2n-6 cis/trans | 0.214 | 0.064 | 0.390 | 0.048 | 6 | 1.33 |
| C20:4n-6 | 0.026 | 0.013 | 0.010 | 0.009 | 1 | 1.52 |
| Minor fatty acid, mg/100 g of FM | ||||||
| C10:0* | 1.378 | 0.818 | 0.611 | 0.540 | 6 | 1.51 |
| C12:0* | 1.135 | 0.776 | 0.633 | 0.506 | 6 | 1.53 |
| C14:1 | 2.520 | 1.733 | 0.526 | 1.192 | 6 | 1.45 |
| C15:0 | 4.929 | 3.256 | 0.348 | 2.824 | 7 | 1.15 |
| C17:0* | 15.579 | 10.289 | 0.694 | 6.015 | 6 | 1.71 |
| C17:1* | 11.210 | 6.960 | 0.732 | 3.811 | 6 | 1.82 |
| C18:2 cis-9,trans-11 (CLA)* | 7.068 | 4.964 | 0.619 | 3.137 | 6 | 1.58 |
| C18:3n-6 | 1.424 | 0.906 | 0.526 | 0.700 | 6 | 1.29 |
| C18:3n-3 | 7.399 | 3.676 | 0.524 | 2.776 | 7 | 1.32 |
| C20:0 | 1.286 | 1.041 | 0.462 | 0.830 | 6 | 1.25 |
| C20:1n-9 | 1.482 | 1.099 | 0.580 | 0.756 | 6 | 1.45 |
| C20:2* | 3.054 | 1.929 | 0.761 | 0.860 | 10 | 2.24 |
| C20:3n-6 | 6.047 | 2.763 | 0.056 | 2.416 | 1 | 1.14 |
| C20:3n-3 | 0.455 | 0.047 | 0.151 | 0.440 | 3 | 1.09 |
| C20:5n-3 | 0.631 | 0.447 | 0.391 | 0.370 | 4 | 1.21 |
| C22:0 | 0.447 | 0.371 | 0.456 | 0.277 | 4 | 1.34 |
| C22:1n-9 | 0.217 | 0.290 | 0.402 | 0.250 | 6 | 1.19 |
| C23:0 | 0.254 | 0.272 | 0.148 | 0.250 | 2 | 1.09 |
| C22:6n-3 | 0.115 | 0.196 | 0.257 | 0.175 | 7 | 1.12 |
| Fatty acid category, g/100 g of FM | ||||||
| ΣSFA* | 0.961 | 0.562 | 0.795 | 0.279 | 8 | 2.01 |
| ΣMUFA* | 0.787 | 0.516 | 0.799 | 0.260 | 5 | 1.99 |
| ΣPUFA* | 0.265 | 0.079 | 0.611 | 0.160 | 3 | 1.50 |
1ΣSFA = C10:0 + C12:0 + C14:0 + C15:0 + C16:0 + C17:0 + C18:0 + C20:0 + C22:0 + C23:0; ΣMUFA = C14:1 + C16:1 + C17:1 + C18:1n-9 cis/trans + C18:1n-11 trans + C20:1n-9 + C22:1n-9; ΣPUFA = C18:2n-6 cis/trans + C20:2 + C22:2 + C18:3n-6 + C18:3n-3 + C20:3n-6 + C20:3n-3 + C20:4n-6 + C20:5n-3 + C22:6n-3. FM = fresh minced meat.
2Coefficient of determination of cross-validation.
3Root mean square error of cross-validation.
4Number of partial least squares loadings.
5Ratio performance deviation.
*Asterisks indicate selected models (R2CV > 0.60).
Descriptive statistics of near-infrared spectroscopy predictions of intramuscular fat (IMF), selected individual fatty acids, and fatty acid categories (spectra set, n = 1,150)1
| Trait2 | Mean | SD | CV |
|---|---|---|---|
| IMF, g/100 g of FM | 1.98 | 0.62 | 31.3 |
| Major fatty acid, g/100 g of FM | |||
| C14:0 | 0.032 | 0.015 | 49.9 |
| C16:0 | 0.460 | 0.152 | 33.0 |
| C16:1 | 0.029 | 0.015 | 51.7 |
| C18:0 | 0.398 | 0.117 | 29.4 |
| C18:1n-9 cis/trans | 0.566 | 0.236 | 41.7 |
| C18:1n-11 trans | 0.059 | 0.022 | 37.1 |
| Minor fatty acid, mg/100 g of FM | |||
| C10:0 | 1.358 | 0.044 | 3.2 |
| C12:0 | 1.125 | 0.334 | 29.7 |
| C17:0 | 13.807 | 3.600 | 36.6 |
| C17:1 | 9.971 | 3.601 | 36.1 |
| C18:2 cis-9,trans-11 (CLA) | 6.439 | 2.517 | 39.1 |
| C20:2 | 2.943 | 1.248 | 42.4 |
| Fatty acid category, g/100 g of FM | |||
| ΣSFA | 0.885 | 0.292 | 33.0 |
| ΣMUFA | 0.673 | 0.302 | 44.9 |
| ΣPUFA | 0.243 | 0.031 | 12.8 |
1Predictions obtained by using calibration models with coefficient of determination of cross-validation greater than 0.60.
2ΣSFA = C10:0 + C12:0 + C14:0 + C15:0 + C16:0 + C17:0 + C18:0 + C20:0 + C22:0 + C23:0; ΣMUFA = C14:1 + C16:1 + C17:1 + C18:1n-9 cis/trans + C18:1n-11 trans + C20:1n-9 + C22:1n-9; ΣPUFA = C18:2n-6 cis/trans + C20:2 + C22:2 + C18:3n-6 + C18:3n-3 + C20:3n-6 + C20:3n-3 + C20:4n-6 + C20:5n-3 + C22:6n-3. FM = fresh minced meat.
Predictions of IMF and FA Content
Figure 1 depicts an example of NIRS spectrum; the predictive ability of meat traits is mainly related to specific absorbance of broad peaks at 1,150 to 1,240, 1,420 to 1,500, 1,780 to 1,810, and 1,910 to 1,980 nm. Peaks at 1,100 and 1,400 are related to C-H and O-H bonds that are linked to fat and water content, respectively (Murray and Williams, 1987; Shenk et al., 1992).
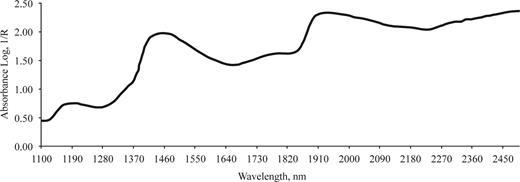
Example of near-infrared spectrum of a sample of longissimus thoracis muscle from a Piemontese young bull.
The IMF prediction model showed good accuracy with the R2 of cross-validation (R2CV) of 0.819 and root mean square error of cross-validation (RMSECV) of 0.557 g/100 g of FM (Table 1). The best prediction model for major FA was obtained for C16:0 (R2CV and RMSECV of 0.828 and 0.135 g/100 g of FM, respectively), whereas for minor FA it was obtained for C20:2 (R2CV and RMSECV of 0.761 and 0.860 mg/100 g of FM, respectively). Concerning FA categories, satisfactory prediction models were obtained for SFA and MUFA with R2CV and RMSECV of 0.795 and 0.279 g/100 g of FM, and 0.799 and 0.260 g/100 g of FM, respectively. Less satisfactory results were obtained for PUFA (R2CV and RMSECV of 0.611 and 0.160 g/100 g of FM, respectively). Overall, good predictions were found for 6 out of 8 major FA (C14:0, C:16:0, C16:1, C18:0, C18:1n-9 cis/trans, and C18:1n-11 trans), and for 6 out of 19 minor FA (C10:0, C12:0, C17:0, C17:1, C18:2 cis-9,trans-11, and C20:2). The RPD values of selected FA ranged from 1.51 to 2.24, indicating fair practical utility of the prediction models.
The calibration equations developed for IMF and FA profile using of the calibration-test set were then applied to the spectra of the remaining 1,150 samples (Table 2), and NIRS-based predictions were used to perform the genetic analysis.
Genetic Determinism for IMF and FA Content Predicted by NIRS
All selected traits showed heritability estimates greater than 0.10, with the only exception of C16:1 (Table 3). Results based on the BF test for heritability estimates of FA predictions are also shown in Table 3. Bayes factors between models with and without a genetic component gave values greater than 1 for IMF, 3 out of 6 major FA (C14:0, C16:0, and C18:1n-9 cis/trans), 3 out of 6 minor FA (C17:0, C17:1, and C20:2), and also for SFA, MUFA, and PUFA, providing evidence that the model was preferable when polygenic additive effects were included. The greatest BF was reached by C20:2 (BF > 10) suggesting strong evidence of genetic determinism, whereas IMF, C18:1n-9 cis/trans, C17:0, C17:1, MUFA, and PUFA showed substantial evidence favoring the numerator model (3.16 < BF < 10) according to the Jeffreys (1984) scale. Moreover, it should be noted that higher heritability estimates were associated with greater-than-1 BF values, but the relationship between the 2 parameters seems to be weak.
Bayes factor and heritability estimates for intramuscular fat (IMF), selected individual fatty acids, and fatty acid categories predicted by near-infrared spectroscopy1
| Item2 | BF3 | Heritability4 | |||
|---|---|---|---|---|---|
| Mean | Median | PSD | HPD95 | ||
| IMF, g/100 g of FM | 3.332 | 0.179 | 0.169 | 0.09 | 0.02 to 0.39 |
| Major fatty acid, g/100 g of FM | |||||
| C14:0 | 1.968 | 0.188 | 0.175 | 0.10 | 0.02 to 0.43 |
| C16:0 | 2.053 | 0.169 | 0.157 | 0.09 | 0.02 to 0.38 |
| C18:0 | 0.631 | 0.123 | 0.112 | 0.07 | 0.01 to 0.30 |
| C18:1n-9 cis/trans | 5.714 | 0.209 | 0.196 | 0.10 | 0.04 to 0.43 |
| C18:1n-11 trans | 0.985 | 0.159 | 0.146 | 0.09 | 0.02 to 0.37 |
| C16:1 | 0.231 | 0.087 | 0.075 | 0.06 | 0.001 to 0.23 |
| Minor fatty acid, mg/100 g of FM | |||||
| C10:0 | 0.901 | 0.156 | 0.146 | 0.09 | 0.01 to 0.37 |
| C12:0 | 0.359 | 0.114 | 0.102 | 0.07 | 0.01 to 0.29 |
| C17:0 | 6.250 | 0.210 | 0.199 | 0.10 | 0.04 to 0.44 |
| C17:1 | 3.861 | 0.198 | 0.183 | 0.10 | 0.03 to 0.42 |
| C18:2 cis-9,trans-11 (CLA) | 0.510 | 0.146 | 0.129 | 0.09 | 0.01 to 0.36 |
| C20:2 | 10.989 | 0.212 | 0.201 | 0.10 | 0.04 to 0.43 |
| Fatty acid category, g/100 g of FM | |||||
| ΣSFA | 1.426 | 0.153 | 0.141 | 0.08 | 0.02 to 0.35 |
| ΣMUFA | 5.076 | 0.205 | 0.194 | 0.11 | 0.03 to 0.43 |
| ΣPUFA | 3.906 | 0.189 | 0.175 | 0.09 | 0.03 to 0.40 |
1Predictions obtained by using calibration models with coefficient of determination of cross-validation greater than 0.60.
2ΣSFA = C10:0 + C12:0 + C14:0 + C15:0 + C16:0 + C17:0 + C18:0 + C20:0 + C22:0 + C23:0; ΣMUFA = C14:1 + C16:1 + C17:1 + C18:1n-9 cis/trans + C18:1n-11 trans + C20:1n-9 + C22:1n-9; ΣPUFA = C18:2n-6 cis/trans + C20:2 + C22:2 + C18:3n-6 + C18:3n-3 + C20:3n-6 + C20:3n-3 + C20:4n-6 + C20:5n-3 + C22:6n-3. FM = fresh minced meat.
3Bayes factor of the model with additive polygenic effects against the same model without additive polygenic effects following García-Cortés et al. (2001).
4The posterior distribution of heritability was characterized by several basic statistics: mean, median, posterior SD (PSD), and highest posterior density region at 95% (HPD95).
DISCUSSION
IMF and FA Content of Beef from Piemontese Double-Muscled Young Bulls
Piemontese (or Piedmontese) is a double-muscled Italian beef breed characterized by very high potential for lean growth and very low potential for fat deposition (Arthur, 1995; Biagini and Lazzaroni, 2005). Also, it is widely used for crossbreeding with dairy cows in Europe, together with Belgian Blue (Dal Zotto et al., 2009; Penasa et al., 2009). Piemontese breed is selected for ADG and muscularity through performance testing of young bulls (Albera et al., 2001), linear type scoring of cows (Mantovani et al., 2010), and progeny testing for direct and maternal calving ease of AI bulls (Carnier et al., 2000; Kizilkaya et al., 2002, 2003). The comparison with data available in literature on double-muscled bulls is not easy because papers deal with single trials based on specific feeding regimens and not with a random sampling of the population. Samples analyzed in the present study are from 1,298 animals reared in 124 different farms and slaughtered during 2 consecutive years, so they represent almost all the different rearing and feeding conditions of the Italian Piemontese population. This also explains the very high CV of the FA content in our study. For comparison, the FA profile of the longissimus thoracis muscle of 48 double-muscled Piemontese bulls (Schiavon et al., 2011) is somewhat different because of greater content of SFA and MUFA and decreased content of PUFA; however, in that trial the objective was to study the supplementation with CLA and hydrogenated soybean oil was included in the diet to avoid interference by unsaturated FA. Raes et al. (2001) compared 30 Belgian Blue bulls of 3 genotypes (conventional, double-muscled, and heterozygous) reared in 9 different farms. The authors specified that in Belgium the bulls are frequently fed with maize silage and commercial concentrates composed of several ingredients among which were animal fat or beef tallow (allowed at the time of the trial) and linseed meal. Raes et al. (2001) found that the amount of IMF was about 3 times in conventional compared with double-muscled Belgian Blue bulls. This increase in fat content was mainly due to SFA and MUFA respect to PUFA, so that the PUFA expressed as percentage of total lipids were less than one-half in conventional compared with double-muscled cattle. Similar results were found by Wiener et al. (2009) on conventional and double-muscled South Devon cattle. The FA profile of the beef sample of Piemontese bulls is more similar to heterozygote than double-muscled Belgian Blue bulls. De Smet et al. (2000) found that energy and protein content of the diet had a reduced effect on IMF and FA profile of double-muscled Belgian Blue bulls, and Dal Maso et al. (2009) and Schiavon et al. (2010) found that dietary protein did not influence production and carcass traits of Piemontese bulls.
Predictions of IMF and FA Content
Several studies have confirmed the ability of NIRS to predict the content of IMF in beef (Ripoll et al., 2008; Prieto et al., 2006, 2011) using different NIRS system and meat treatments. Results for IMF content from our study are consistent with those reported by Prieto et al. (2006) and Ripoll et al. (2008) on homogenized meat samples, whereas they are greater to those reported by Prieto et al. (2011) who tested the ability of NIRS on intact meat samples in the abattoir. As reported by Prieto et al. (2009), the sample preparation (in particular the homogeneity of meat samples) plays an important role in the accuracy of NIRS prediction; in fact, the chemical composition in minced samples can be more accurately predicted by NIRS than in intact tissue.
Regarding the prediction of individual and categories of FA, only a few papers investigated the application of infrared spectroscopy for the prediction of FA composition in beef; moreover, the comparison between papers is sometimes quite difficult due to the use of different equipment (reflectance or transmittance mode), wavelength ranges, sample preparation (fresh minced or intact samples), reference method for FA determination, and the unit of measure of FA (percentage on total fat or quantity on fresh meat). On average, the prediction of major FA was better compared with minor FA; this was probably due to the precision in measuring the former FA relative to their mean values and to similarities in their NIRS absorption pattern (Windham and Morrison, 1998).
Sierra et al. (2008) reported similar results for C14:0, C16:0, C18:0, C18:1n-9 cis/trans, and C18:1n-11 trans (R2CV from 0.73 to 0.87) using near-infrared transmittance spectroscopy, whereas on average they found greater results for minor FA. Prieto et al. (2011), in a study aiming at implementing the NIRS directly in a slaughterhouse, reported less accurate results for the prediction of individual and categories of FA, and a wide variation in the prediction accuracy according to the data set (type of breed) used to develop models.
Heritabilities of IMF and FA Content Predicted by NIRS
Fatty acid profile has important effects on human health and meat quality as it influences the nutritional value, shelf life, and processing characteristics of the product (Sheard et al., 2000). Fatty acid composition also influences the firmness/oiliness of adipose tissue and the oxidative stability of muscle, which in turn affects flavor and muscle color (Wood et al., 2008). Heritabilities of IMF and FA content predicted by NIRS were low to moderate, and resembled those obtained with gas chromatographic analysis by Pitchford et al. (2002) on FA composition of 1,215 crossbreds between Hereford cows and 97 sires from 7 breeds; these authors estimated heritabilities between 0.14 and 0.21. Tait et al. (2007) estimated heritabilities between 0.11 and 0.45 on 916 Angus-sired bulls and steers, whereas estimates by Nogi et al. (2011) were much variable, ranging from 0 to 0.80. Differences might be attributable to different breeds and FA determination. It should be pointed out that in the Japanese Black cattle, the IMF is around 36% (Matsuhashi et al., 2011), whereas in our study it is close to 2%. To our knowledge, no estimates of heritability for IMF and FA profile of beef meat predicted by NIRS are available in the literature.
The relevance of NIRS in programs focusing on selection to improve FA based on indicator traits relies on the genetic variation of NIRS predictions and on the magnitude of phenotypic and genetic correlation between NIRS predictions and FA measured using a reference method. In this context, Cecchinato et al. (2011) reported results on physical quality traits obtained by using both reference analyses and NIRS prediction and found similar or greater heritability values for measured and predicted traits, confirming previous results on milk coagulation properties (Cecchinato et al., 2009).
In conclusion, our results indicated the possibility of using the cheap and rapid NIRS technique for the prediction of IMF, 6 out of 8 major FA, 6 out of 19 minor FA, SFA, MUFA, and PUFA on a large number of animals. Moreover, the existence of an important genetic determinism for some FA has been confirmed using the BF analysis, suggesting that FA profile in beef could be genetically modified. Nevertheless, further research is needed to improve calibration equations by using larger data sets and to evaluate genetic relationships among FA, and between FA and traits included in the current breeding goal of Piemontese cattle.
APPENDIX
BF for Testing the Additive Polygenic Background of Quantitative Traits
Heritability was evaluated by calculating the BF (Kass and Raftery, 1995) of a model accounting for infinitesimal polygenic effects,
against a reduced model without genetic effects,

by applying the García-Cortés et al. (2001) and Varona et al. (2001) method. Note that y was the vector of phenotypic data, e was the vector of residuals, β was the vector storing the systematic effects described above, a was the vector of additive genetic effects, and X and Z were appropriate incidence matrices. Following Varona et al. (2001), only the analysis of the most complex model was required to calculate the BF, after reparameterizing as

where e* = Za + e was assumed to follow a multivariate normal distribution with mean 0 and variance  Note that A was the numerator relationships matrix between individuals, I was an identity matrix with dimensions equal to the number of data,
  was the phenotypic variance, and
  was the additive genetic variance,
  Under a standard Bayesian development, the posterior probability of all the parameters in model was proportional to

where  and the remaining a priori distributions were assumed flats as in Varona et al. (2001). Random samples from all unknowns in model were obtained by Gibbs sampling (Gelfand and Smith, 1990), with the exception of h2, which required a Metropolis-Hastings step (Hastings, 1970). The BF was calculated from the Markov chain Monte Carlo sampling by averaging the full conditional densities of each cycle at h2 = 0 (see Varona et al., 2001, for a detailed description of this methodology). The BF provides the ratio of posterior probabilities between the 2 tested models. A BF >1 suggests a relevant genetic background for the analyzed trait, whereas a BF <1 shows that the model without genetic effects is more probable.
Jeffreys (1984) Scale of Evidence for BF
The BF is the ratio of posterior probabilities between 2 competing models placed as numerator and denominator in the ratio. Following Jeffreys (1984), the BF can be classified according to 6 levels of evidence:
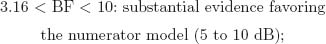

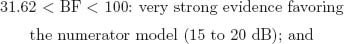
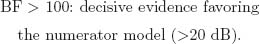
Note that these specific cutoff values were defined on the basis of a 5-unit dB increase, a base-10 logarithmic unit that measures information and entropy (Good, 1979). The BF can be transformed to a dB value (δ) by applying δ010BF/10m and, inversely, BF = 10 × log10 (δ).
LITERATURE CITED
Author notes
The authors thank the Italian Ministry of Agriculture (Rome, Italy) for financial support and the National Association of Piemontese Breeders (Carrù, Italy) for supplying pedigree information.
