


Abstract
We reasoned that marginal returns from genomic selection diminish as the proportion of genotyped selection candidates increases and breeding values (BV) based on a priori information are used to choose candidates that are genotyped. We tested this premise by stochastic simulation of breeding schemes that resembled those used for pigs. We estimated rates of genetic gain and inbreeding realized by genomic selection in breeding schemes where candidates were phenotyped before genotyping and 0 to 100% of the candidates were genotyped based on predicted BV. Genotyping was allocated to male and female candidates at ratios of 100:0, 75:25, 50:50, 25:75, and 0:100. For genotyped candidates, a direct-genomic value (DGV) was sampled with reliabilities 0.10, 0.50, and 0.90. Ten sires and 300 dams with the largest BV after genotyping were selected at each generation. Selection was for a single trait with heritability 0.20. We found that the marginal returns did diminish as genotyping proportion was increased, while the rate at which the returns diminished slowed as DGV became more reliable. With DGV reliability 0.10, genotyping as little as 5% of the selection candidates realized 86% of the additional genetic gain and 67% of the reduction in inbreeding that was realized by genotyping 100% of the candidates. All of the genetic gain and reduction in inbreeding was realized by genotyping 40 and 50% of the candidates. When the reliability was increased to 0.90, genotyping 20% of the candidates was required to realize 76% of the genetic gain and 85% of the reduction in inbreeding. Genotyping 50% of the selection candidates with DGV reliability 0.90 realized 91% of the genetic gain and 94% of the reduction in inbreeding. Regardless of DGV reliability, returns at small genotyping proportions of 0.5 to 10% were maximized when only male candidates were genotyped. At the large genotyping proportions of 20 to 50%, returns were maximized by genotyping both males and females. Our findings indicate that, provided a priori information is available, only 5 to 20% of the selection candidates need to be genotyped to realize most of the benefits from genomic selection. At these genotyping proportions, it is best to target males in schemes when selection intensity for males is greater than females. Our findings should benefit breeders because they suggest that large investments in genotyping are not required to reap most of the benefits from genomic selection.
INTRODUCTION
Genomic selection in animal breeding involves genotyping selection candidates for dense markers, using the markers to predict breeding values (BV), and selecting candidates based on the BV (Meuwissen et al., 2001). Breeding values predicted using marker information can be more reliable than traditional BV, leading to increased genetic gains and reduced rates of inbreeding (Daetwyler et al., 2007). However, one challenge with genomic selection is that there are many selection candidates in most breeding schemes. Genotyping all of them is often impractical. Fortunately, it may only be necessary to genotype a proportion of the candidates to obtain most of the benefits from genomic selection. This should be so when a priori information, often in the form of pedigree information and own performance, is available at the time of genotyping. When this information is available, BV can be predicted, candidates ranked, and candidates with the largest BV genotyped. Selection candidates with the largest BV are presumably the most suitable for genotyping because BV predicted before genotyping are correlated, at least partially, with true BV. Candidates that rank highest for BV are more likely to have larger true BV than lower-ranked candidates and, if genotyped, they are more likely to have larger BV after genotyping. As more candidates are genotyped, the less likely that the final candidate to be genotyped will be among the highest-ranking after genotyping. That is, the marginal returns from genomic selection diminish as more selection candidates are genotyped. This line of reasoning lead us to believe that marginal returns from genomic selection diminish as the proportion of genotyped selection candidates is increased and BV based on a priori information are used to choose the candidates that are genotyped. We tested this premise by stochastic simulation of breeding schemes that resembled those used for pigs.
MATERIALS AND METHODS
Procedure
We used stochastic simulation to estimate rates of genetic gain and inbreeding realized by genomic selection in breeding schemes in which selection was for a single trait and all selection candidates were phenotyped for the trait before genotyping (Figure 1). The phenotypes were used to predict BV and 0, 0.5, 1, 2, 5, 10, 20, 40, 50, and 100% of the candidates with the highest BV were genotyped. Genotypings were allocated to male and female candidates at ratios of 100:0, 75:25, 50:50, 25:75, and 0:100. For each genotyped candidate, a direct-genomic value (DGV) was sampled without simulating chromosomes, genes, or genetic markers. The DGV were assumed to predict true BV with reliabilities of 0.10, 0.50, and 0.90, representing DGV with low, moderate, and high reliability. This method of simulating genomic selection, termed pseudo-genomic selection by Buch et al.(2012), is similar to the method developed by Dekkers (2007). After genotyping, BV of the selection candidates were augmented using DGV, and candidates with the highest BV were selected. All candidates, both the genotyped and non-genotyped, were candidates for selection after genotyping.
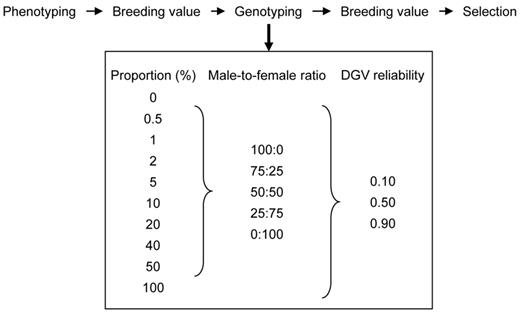
Procedure used to test the premise of diminishing marginal returns from genomic selection with increasing genotyping proportion. Selection candidates were phenotyped before genotyping. The phenotypes were used to predict breeding values (BV), and 0 to 100% of the candidates with the largest BV were genotyped. Genotypings were allocated to male and female candidates at 5 ratios. For each genotyped candidate, a direct-genomic value was sampled with reliabilities 0.10, 0.50, or 0.90. Breeding values were predicted after genotyping, and candidates with the largest BV were selected.
Breeding Schemes
Ten sires and 300 dams were truncation selected in each generation of the breeding schemes. Each sire was randomly mated with 30 dams, and each mating (dam) produced 5 offspring, resulting in 300 full-sib families and 1,500 offspring. Generations were discrete. These breeding schemes resembled those used for pigs.
The numbers of males and females that were genotyped at genotyping proportions 0.5 to 50% and at each ratio of male-to-female genotyping are presented in Table 1. In most of these schemes, the number of males that were genotyped was greater than the number selected, while the number of females genotyped was generally less than the number selected.
Number of male (M) and female (F) candidates that were genotyped in each generation of breeding schemes with 8 genotyping proportions and 5 ratios of males-to-females1
| Male-to-female ratio | ||||||||||
|---|---|---|---|---|---|---|---|---|---|---|
| Proportion:% | 100:0 | 75:25 | 50:50 | 25:75 | 0:100 | |||||
| M | F | M | F | M | F | M | F | M | F | |
| 0.5 | 8 | 0 | 6 | 2 | 4 | 4 | 2 | 6 | 0 | 8 |
| 1 | 16 | 0 | 12 | 4 | 8 | 8 | 4 | 12 | 0 | 16 |
| 2 | 30 | 0 | 24 | 8 | 15 | 15 | 8 | 24 | 0 | 30 |
| 5 | 76 | 0 | 57 | 19 | 38 | 38 | 19 | 57 | 0 | 76 |
| 10 | 150 | 0 | 112 | 38 | 75 | 75 | 38 | 112 | 0 | 150 |
| 20 | 300 | 0 | 225 | 75 | 150 | 150 | 75 | 225 | 0 | 300 |
| 40 | 600 | 0 | 450 | 150 | 300 | 300 | 150 | 450 | 0 | 600 |
| 50 | 750 | 0 | 562 | 188 | 375 | 375 | 188 | 562 | 0 | 750 |
1A total of 1,500 candidates (approximately 750 males and 750 females) were available for genotyping. Ten males and 300 females were selected in each generation.
Trait
The trait under selection was assumed to be normally distributed and genetically controlled by the infinitesimal model of additive genetic effects. It had a heritability of 0.20 and phenotypic variance of 1.0.
Direct-Genomic Values
The DGV were assumed to be normally distributed with heritability 0.99. A heritability of 0.99, instead of 1.0, was used so that the residual (co)variance matrix used when sampling the population and predicting BV remained positive-definite. The reliabilities assumed for the DGV, namely 0.10, 0.50, and 0.90, correspond to accuracies of 0.32, 0.71, and 0.95. The DGV had no economic value.
Sampling
The breeding schemes were initiated by sampling an unrelated base population of 10 sires and 300 dams. The phenotypes of the trait and DGV for the ith base animal, pi, were calculated as pi = ai + ei, where pi is a 2 by 1 vector of phenotypes and DGV, ai is a 2 by 1 vector of true additive-genetic values, and ei is a 2 by 1 vector of residual environmental values. The true additive-genetic values were sampled as ai = Lr1i, where L is the Cholesky decomposition (lower triangular) of G, a 2 by 2 matrix of additive-genetic (co)variances, and r1i is a 2 by 1 vector of uncorrelated random deviates sampled from a standard-normal distribution. The genetic (co)variance matrix, G, was

,where rIA is the accuracy of the DGV and the diagonal elements are the additive-genetic variances of the trait and DGV. The environmental values were sampled as ei = Cr2i, where C is the Cholesky decomposition of R, a 2 by 2 matrix of environmental (co)variances, and r2i is a 2 by 1 vector of uncorrelated normal deviates. The environmental (co)variance matrix, R, was

The phenotypes of the animals in subsequent generations were calculated as described for the base population, with the exception that the true BV of the ith animal, ai, was sampled as  where asi and adi are 2 by 1 vectors of additive-genetic values of the sire, si, and the dam, di of animal i,
  is the average inbreeding coefficient of si and di, and r3i is a 2 by 1 vector of uncorrelated normal deviates. The animals were assigned as males or females with a probability of 0.5.
Prediction of Breeding Values
Breeding values were predicted by fitting a bivariate animal model to the phenotypes of the trait and the DGV. Including DGV in the model resulted in BV for the trait with properties similar to genomic-enhanced BV realized by back-blending (Dekkers, 2007). The model was:
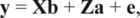
, where y is a vector of trait phenotypes and the DGV observed for selection candidates and ancestral animals, b is a vector of fixed effects, a is a vector of random animal effects, e is a vector of residual errors, and X and Z are incidence matrices. The elements of b were fixed generation effects and a fixed overall mean. The generation effects were associated with the trait and the overall mean was associated with the DGV.
The (co)variance structure used to predict the BV was:
, where A is a numerator-relationship matrix and I an identity matrix. The (co)variance matrices, G and R, are the same as those used when sampling the animals.
Data Analyses
The breeding schemes were run for 20 generations. Rate of genetic gain for the trait under selection was calculated on the phenotypic scale as the linear regression of St on t, where St is the average true BV of animals born in generation t (t = 6…20). Rate of inbreeding was calculated as 1 – exp(β), where β is the linear regression of ln(1 – Ft) on t, and Ft is the average degree of inbreeding for animals born in generation t (t = 6…20). Each breeding scheme was replicated 100 times, and the rates of genetic gain and inbreeding are presented as means (± SD) of the 100 replicates.
We present the returns from genotyping as a function of genotyping proportion and ratio of male-to-female genotypings. The relationship between returns and genotyping proportion is presented by plotting the rates of genetic gain and inbreeding at the 3 DGV reliabilities as a function of genotyping proportion. The rates plotted for each combination of DGV reliability and genotyping proportion are the maximum rate of genetic gain and the minimum rate of inbreeding across the 5 ratios of male-to-female genotypings. The relationship between returns and ratio of male-to-female genotypings is presented by plotting the rates of genetic gain and inbreeding at each genotyping proportion as a function of male-to-female genotyping ratio with the DGV reliability at 0.50.
We also present 2 analyses that illustrate mechanisms underlying the returns from genotyping. In the first analysis, we compared the sets of genotyped candidates with the sets selected after genotyping. This showed by how much the DGV changed selection decisions. We did this by plotting the proportion of genotyped females that were selected at the 3 DGV reliabilities as a function of the number of genotyped females. We limited the analysis to those schemes where the number of genotyped females was less than 300, the number of females selected, and the ratio of male-to-female genotypings was 0:100. In the second analysis, we compared the returns from genotyping males vs. females. We plotted the rates of genetic gain and inbreeding as a function of number of male and female genotypings with the DGV reliability at 0.50. The ratio of male-to-female genotypings used was 100:0 for the males and 0:100 for the females.
Software
The simulations were carried out using the program, ADAM (Pedersen et al., 2009b). The BV were predicted using the program, DMU6 (Madsen et al., 2006).
RESULTS
The marginal returns from genomic selection diminished as the proportion of selection candidates that were genotyped was increased from 0 to 100%. The magnitude of the returns and the rate at which they diminished depended on the reliability of the DGV and, to a lesser extent, the ratio of male-to-female genotypings.
Maximum Returns from Genomic Selection
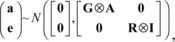
The maximum returns from genomic selection increased with DGV reliability (Figure 2). Genotyping 100% of the candidates realized 1.13, 1.54, and 1.88 times more genetic gain per generation than the scheme in which 0% of the candidates were genotyped when the reliability of the DGV was 0.10, 0.50, and 0.90. It also realized 0.89, 0.61, and 0.42 times the rate of inbreeding per generation.
Rates of genetic gain (ΔG) and inbreeding (ΔF) realized by genomic selection as a function of genotyping proportion at 3 reliabilities for direct-genomic values (r2 = 0.10, 0.50, and 0.90). The rates plotted for each combination of genotyping proportion and direct-genomic value reliability are the maximum rate of genetic gain and the minimum rate of inbreeding across 5 ratios of male-to-female genotypings. Each point represents the mean of 100 replicates. Standard deviations of the means ranged from 0.01 to 0.02 for the rates of genetic gain and 0.002 to 0.005 for the rates of inbreeding.
Marginal Returns from Genotyping
The rate at which the returns from genomic selection diminished decreased as the DGV was made more reliable (Figure 2). When the reliability of the DGV was 0.10, most of the returns from genomic selection were realized by genotyping as little as 5% of the selection candidates. Genotyping 5% of the selection candidates at this reliability realized as much as 86% of the additional genetic gain and 67% of the reduction in inbreeding that was realized by genotyping all of the selection candidates. At the greater genotyping proportions of 40 and 50%, all of the genetic gain and reduction in inbreeding was realized.
When the reliability was increased to 0.50 and 0.90, more selection candidates had to be genotyped to realize most of the returns that were realized by genotyping all of the selection candidates (Figure 2). Genotyping 10% of the selection candidates with the reliability at 0.50 realized as much as 73% of the genetic gain and 74% of the reduction in inbreeding. As much as 76% of the genetic gain and 85% of the reduction in inbreeding were realized by genotyping 20% of the candidates with reliability 0.90. Genotyping more candidates realized more returns, but at a diminishing rate. For example, genotyping 50% of the selection candidates with the reliability at 0.50 realized as much as 93% of the genetic gain and 97% of the reduction in inbreeding. Likewise, as much as 91% of the genetic gain and 94% of the reduction in inbreeding was realized with DGV reliability at 0.90.
Ratio of Male-to-Female Genotypings
Returns at the low genotyping proportions were maximized when only male candidates were genotyped. At the high genotyping proportions, returns were maximized by genotyping both males and females. This pattern is illustrated with DGV reliability at 0.50 (Figure 3). At this reliability, genotyping 20% of the candidates was a “transition” proportion, where the rates of genetic gain and inbreeding were similar when the ratio of male-to-female genotypings ranged from 100:0 to 25:75. At the lower genotyping proportions of 0.5, 1, 2, 5, and 10%, returns were maximized when only males were genotyped. Genotyping females at these proportions decreased the rate of genetic gain and increased the rate of inbreeding. The rate of genetic gain decreased by as much as 12% when the ratio of male-to-female genotypings was changed from 100:0 to 25:75, while the rate of inbreeding increased by up to 15%. At the greater genotyping proportions of 40 and 50%, the rate of genetic gain was greatest and rate of inbreeding lowest when the male-to-female ratio was 50:50 and 25:75. The rate of genetic gain at these genotyping proportions was 2.5 to 3.5% greater than when only males were genotyped, while the rate of inbreeding was 2.4 to 6.4% less.
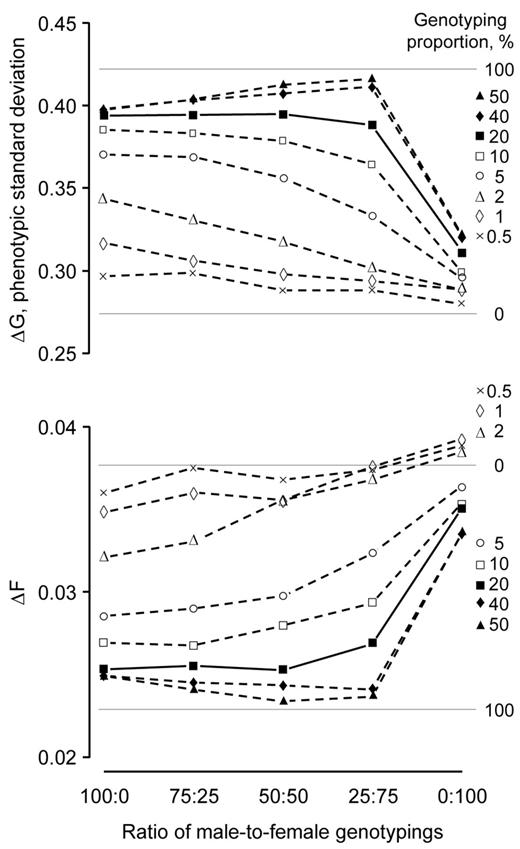
Rates of genetic gain (ΔG) and inbreeding (ΔF) realized by genomic selection as a function of male-to-female genotyping ratio at 8 genotyping proportions with the reliability for direct-genomic values at 0.50. Each point represents the mean of 100 replicates. Standard deviations of the means ranged from 0.01 to 0.02 for the rates of genetic gain and 0.003 to 0.005 for the rates of inbreeding. The horizontal lines are rates of genetic gain and inbreeding with 0 and 100% genotyping.
The exception was when only females were genotyped (i.e., ratio of male-to-female genotypings 0:100). Genotyping only females always realized the lowest returns. It realized 20 to 23% less genetic gain and 27 to 40% more inbreeding than when males only were genotyped. Genotyping only females even realized 2.2 to 4.4% more inbreeding than the scheme in which 0% of the candidates were genotyped at the genotyping proportions of 0.5, 1, and 2%.
The pattern illustrated for ratio of male-to-female genotypings with the DGV reliability at 0.50 was also evident for DGV reliabilities 0.10 and 0.90 (figures not presented). The difference was that the pattern was less obvious with reliability 0.10, and more pronounced at reliability 0.90.
Comparison of Genotyped and Selected Candidates
The difference in the sets of genotyped and selected candidates increased as DGV became more reliable and number of genotyped animals approached the number selected. This was illustrated by the female candidates in the breeding schemes, where the number of genotyped females was less than or equal to 300 and the ratio of male-to-female genotypings was 0:100 (Figure 4). In these schemes with DGV reliability 0.10, nearly all of the genotyped females were selected when the number of females that were genotyped ranged between 8 and 150. When the number of genotyped females was increased to 300, the proportion of the genotyped females that were selected decreased to 90.1%. With DGV reliability 0.50, the proportion of the genotyped females that were selected decreased from 98.9 to 81.3% as the number of genotyped females was increased from 8 to 300. It decreased from 93.4 to 76.0% with reliability 0.90.
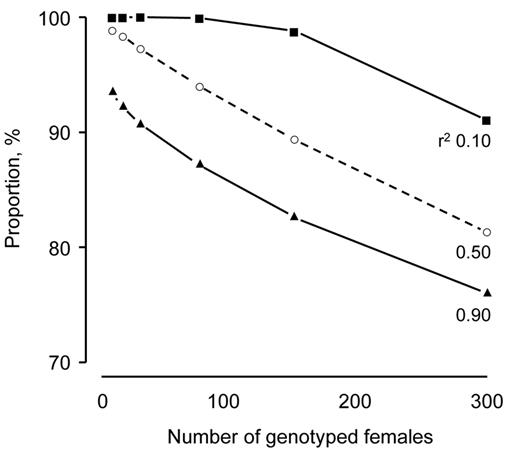
Proportion of genotyped females that were selected as a function of the number of genotyped females at 3 reliabilities for direct-genomic values (r2 = 0.10, 0.50, and 0.90). The number of genotyped females was less than or equal to 300 and the number of females selected was 300. The ratio of male-to-female genotypings was 0:100.
Returns from Male and Female Genotypings
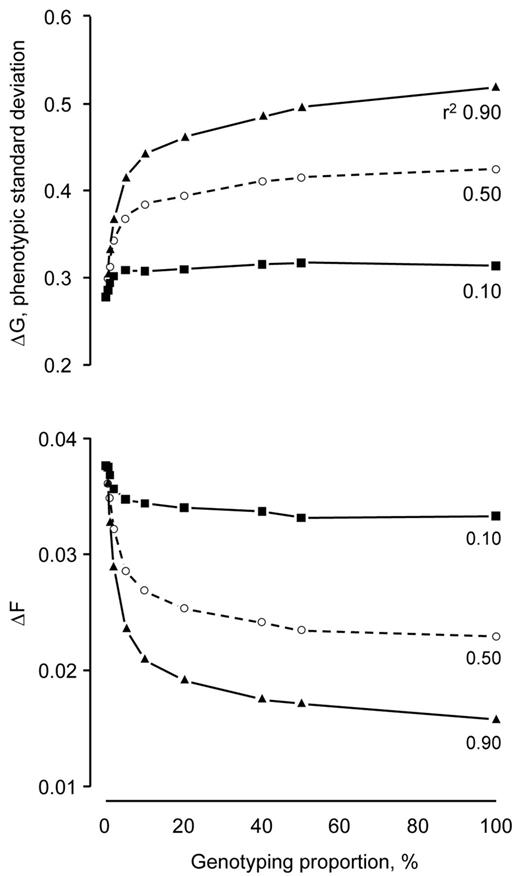
Returns from genotyping males were greater than for females, while the rate at which the returns diminished with increasing genotyping proportion was greatest for males. This is illustrated by breeding schemes with DGV reliability 0.50 and ratios of male-to-female genotypings 100:0 and 0:100 (Figure 5). At this reliability and these genotyping ratios, genotyping all of the male candidates realized 1.24 times more genetic gain and 0.74 times less inbreeding than genotyping all of the female candidates. Most of the returns from genotyping all of the males could be realized by genotyping only a small proportion of them. Approximately 77% of the genetic gains and 73% of the reduction in inbreeding were realized by genotyping 10% of the male candidates. Almost all of the genetic gain and reduction in inbreeding was realized by genotyping 40%. By contrast, realizing most of the returns from genotyping all of the females required large proportions of the selection candidates to be genotyped. Only 40% of the genetic gains and 30% of the reduction in inbreeding was realized by genotyping 10% of the female candidates. Realizing most of the genetic gain and reduction in inbreeding required 80% of the females to be genotyped.
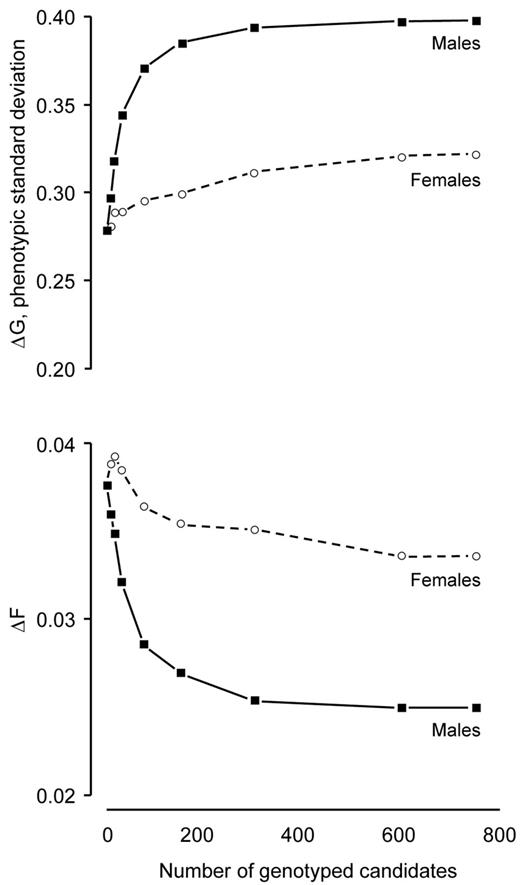
Rates of genetic gain (ΔG) and inbreeding (ΔF) realized by genomic selection as a function of the number of genotyped males and females with the reliability for direct-genomic value at 0.50. The ratio of male-to-female genotypings was 100:0 for males and 0:100 for females.
DISCUSSION
Our findings supported our premise that marginal returns from genomic selection diminish as the proportion of genotyped selection candidates is increased and BV based on a priori information are used to choose the candidates that are genotyped. These findings indicate that genotyping as little as 5 to 20% of the candidates would make for viable genotyping strategies. They also indicate that, at these low genotyping proportions, it is best to target males in breeding schemes in which selection intensity for males is greater than for females. The proportion actually genotyped by breeders will undoubtedly be driven by the economic and management goals of their schemes. Should the goal be to realize more of the potential returns from genomic selection, particularly when the DGV are reliable, breeders would need to genotype more than 5 to 20% of the candidates. At these greater genotyping proportions, it becomes worthwhile to include female genotypings rather than focusing solely on males. The need to only genotype small proportions of selection candidates should be welcomed by breeders because it suggests that large investments in genotyping selection candidates are not required to reap most of the benefits from genomic selection. These findings are supported by Lillehammer et al. (2011b) and Sørensen and Sørensen (2009), who showed evidence of diminishing marginal returns from genomic selection when they simulated breeding schemes for pigs and dairy cattle. So, provided a priori information is available, only a small proportion of the selection candidates need to be genotyped to realize most of the benefits from genomic selection.
As we contended, marginal returns from genotyping diminished because BV predicted using a priori information were correlated with true BV. Candidates that ranked highest for BV before genotyping tended to have greater true BV than lower-ranked candidates and, when genotyped, they also tended to rank higher after genotyping. As more candidates were genotyped, it became increasingly unlikely that the final genotypings would change the set of selected candidates. Therefore, in principle, using a priori information to devise genotyping strategies is simple. It enables us to rank candidates so that the most-appropriate ones can be genotyped.
Even though the diminishing marginal returns resulted from having a priori information, the rate at which the returns diminished depended largely on DGV reliability. This was because DGV add new information to BV predicted before genotyping (Dekkers, 2007; Hayes et al., 2009). At the low DGV reliability of 0.10, DGV added little new information. The correlation between BV predicted before and after genotyping was largest and the highest-ranked candidates before genotyping tended to be the highest-ranked after genotyping. The returns from genomic selection at low DGV reliability were easy to realize, but the returns were small. As DGV were made more reliable, the correlation between BV predicted before and after genotyping decreased and the highest-ranked candidates before genotyping were not necessarily the highest-ranked after genotyping. More genotypings were, therefore, required to capture the most-suitable candidates and realize the greater potential returns. This explanation was verified by the first of our analyses, which showed that the difference in the sets of genotyped and selected candidates increased as the DGV became more reliable. Thus, viable genotyping strategies are not only determined by a priori information, but DGV reliability. The more reliable the DGV, the more genotypings required to realize most of the benefits from genomic selection.
Whichever DGV reliability was used, the returns at each genotyping proportion were maximized by using an appropriate ratio of males-to-females. Appropriate ratios were those that included at least some male genotypings for 2 reasons. First, the selection intensity for males was greater than females. We selected 10 males and 300 females by truncation selection in our breeding schemes. The returns from genotyping males and ranking them more reliably were greater than the returns from female genotypings. This was verified when we compared the returns from genotyping males vs. females. Second, the number of male candidates that were genotyped was greater than the number of males selected in most of the breeding schemes, while the number of genotyped females was generally less than the number selected. By genotyping more males than the number selected, males above and below the selection threshold received their own DGV and could be reranked more reliably. By contrast, only females above the selection threshold before genotyping received their own DGV. They could only rerank below the threshold if their DGV resulted in a marked decrease in their BV, while non-genotyped females below the threshold could only be selected if females above the threshold fell below it. So it was less likely for female candidates below the selection threshold before genotyping to be selected than for male candidates. These 2 reasons indicate that, when the selection intensity for males is greater than females, it only becomes worthwhile genotyping females when large proportions of the selection candidates are genotyped. As the genotyping proportion is increased and these genotypings are allocated to male candidates, the less likely that the final males to be genotyped would be selected. A genotyping proportion is reached at which the marginal returns from genotyping additional males is less than the marginal returns realized by genotyping females. At this point, it becomes worthwhile genotyping females. Clearly, males should be the focus of genotyping strategies in breeding schemes in which the selection intensity for males is greater than females, although it is worthwhile considering female genotypings when large numbers of candidates can be genotyped.
Not only were returns maximized by genotyping at least some males, genotyping only females at low genotyping proportions had the added burden of realizing more inbreeding than the scheme in which no candidates were genotyped. At first, this appears at odds with one of the benefits of genomic selection, namely reduced rates of inbreeding brought about by a decrease in the coselection of sibs (Daetwyler et al., 2007; Pedersen et al., 2009a; Pryce and Daetwyler, 2012). However, when only small proportions of the females were genotyped, any decrease in the coselection of female sibs was more than counterbalanced by an increase in the coselection of male sibs for 3 reasons. First, genotyping small proportions of the females not only augmented the predicted BV of the genotyped females, it also augmented the BV of their male sibs via the pedigree (Dekkers, 2007). Augmenting male BV with information from female sibs increased the between-family variance for males (i.e., BV of males sibs became more alike). Second, males with the greatest predicted BV had the most-augmented BV because they tended to be related to the genotyped females. This was because the genotyped females ranked highest for predicted BV, while their male sibs tended to be among the highest-ranking males. Third, the high selection intensity for males meant that any increases in the coselection of male sibs would lead to greater rates of inbreeding (Robertson, 1961; Daetwyler et al., 2007). Hence, there seems to be little benefit in only genotyping females in breeding schemes in which the selection intensity for males is greater than females. It can, in fact, be detrimental at low genotyping proportions.
We illustrated the principle of diminishing marginal returns with increasing genotyping proportion by simulating breeding schemes that resembled those used for pigs. The principle should apply to most, if not all, animal breeding schemes that use genomic selection. This is particularly so for breeding schemes, such as those used in some pig breeds and fish, in which the candidates are phenotyped before major selection decisions (Gjedrem, 2005; Rothschild and Ruvinsky, 2011). The more complete the phenotyping, the more reliable the BV, and the more effective the genotyping strategy. The challenge arises when the information is incomplete. This occurs in breeding schemes, such as those used for dairy cattle, in which traits are sex-specific, traits are observed after genotyping, or only a proportion of the candidates have own phenotypes (Schaeffer, 2006; Goddard, 2012). These schemes are still likely to benefit from using a priori information to devise genotyping strategies, although more genotypings may be required to capture the most-suitable candidates. So, genotyping strategies should be effective in most breeding schemes, and in many of these schemes, they can probably be applied without major changes to the schemes.
A further practical issue is decreasing genotyping costs, which should make it possible to genotype greater proportions of selection candidates in many breeding schemes (Hayes et al., 2009; Goddard, 2012; Pryce et al., 2012). However, even with lower genotyping costs, genotyping strategies will still remain important for 2 reasons. First, there will always be a cost and practical consideration associated with genotyping animals. Second, it makes no economic sense to continue genotyping animals when the returns are less than the genotyping costs. What will probably change, as costs decrease, is that breeders will genotype more animals until the marginal returns from genotyping are less than an amount considered too small by the economic and management goals of their schemes. Therefore, genotyping strategies will remain a vital part of any breeding scheme that uses genomic selection regardless of future genotyping costs.
Coupled with the findings of our study, there are other issues that are worth considering. First, the reliability of BV before genotyping differs between species, breeding schemes, and traits under selection (Goddard, 2012). In schemes, where the reliability is low, large numbers of genotypings may be required to capture the most-suitable candidates. By contrast, if reliability is high, additional returns from genomic selection will be small, and it may not be economically feasible to implement genomic selection. Second, genotyping strategies should also be tested when chromosomes, genes, and genetic markers are simulated (Pryce and Daetwyler, 2012). Even though the principle of diminishing returns will still apply, optimum genotyping proportions and ratios of male-to-female genotypings may change because the allocation of genotypings also affects the reliabilities of BV (Sonesson and Meuwissen, 2009; Lillehammer et al., 2011a; Pryce et al., 2012). Third, appropriate ratios of male-to-female genotypings are sure to change with the relative selection intensity applied to males and females. As the intensity of female selection is increased, more emphasis will be on female genotypings (Schaeffer, 2006; Lillehammer et al., 2011b). Addressing each of these issues will help create effective genotyping strategies for breeding schemes that use genomic selection.
LITERATURE CITED
Footnotes
This study was funded by GUDP Center for Innovation, Ministry of Food Agriculture and Fisheries, and the Pig Research Centre, Danish Agriculture and Food Council, Copenhagen, Denmark. An anonymous reviewer provided useful comments.
