


ABSTRACT
The overall objective was to compare reproductive performance through 4 parities of gilts developed with ad libitum access to feed or with restriction of energy to 75% of ad libitum intake. Effects on growth and pubertal development are reported. The experiment was a 2 × 2 factorial with 661 gilts. One-half of the gilts (n = 330) were allowed ad libitum access to feed from weaning to breeding at 235 d of age (AL), and 331 littermates were developed with ad libitum access to feed to 123 d of age and then restricted to 75% of ad libitum intake to 235 d of age (Res). Diets for gilts on regimen AL were formulated to meet requirements for growth. All nutrients except energy and selenium were increased in the diet fed to gilts on regimen Res so that nutrient intake per unit of BW was expected to be similar to that of gilts on regimen AL. Sires of all gilts were from an industry maternal line. Dams were either an industry Large White-Landrace cross, or Nebraska selection Line 45, producing gilts denoted as LW/LR and L45X, respectively. Traits were recorded every 2 wk. Recording of feed intake and BW began at 53 d of age, and recording of backfat (BF) and LM area (LMA) began at 123 d of age. Estrus detection began at 140 d of age to determine age at puberty (AP). The G:F ratio from 123 to 235 d of age for gilts on the AL regimen was greater (0.269 vs. 0.257, P < 0.01) than for gilts on the Res regimen; the greatest difference occurred in the first 2-wk period following feed restriction. The LW/LR gilts were heavier, had less BF, and had greater LMA than L45X gilts, but interactions with feeding regimen and period of development existed. Feed restriction reduced BW, BF, LMA, and ratio of BF to BW, but had little effect on ratio of LMA to BW. More L45X gilts than LW/LR gilts (98 vs. 93%, P < 0.01) and more gilts developed on regimen AL than regimen Res (98 vs. 91%, P < 0.01) expressed estrus. Mean age at puberty was 178.6 d for LW/LR and 173.0 d for L45X gilts (P < 0.01) and 174.1 d for regimen AL and 177.5 d for regimen Res (P < 0.05). The Res regimen delayed pubertal development. Subsequently, it will be important to determine effects on reproduction through 4 parities.
INTRODUCTION
Prolonged periods of energy restriction initiated postweaning, without limiting other nutrients, results in increased longevity in many animals that is approximately proportional to the level of restriction (Merry, 2002). An accepted axiom is that there is a trade-off in allocation of resources such that animals cannot combine increased rates of fecundity with extended lifespans. Johnston et al. (2006) demonstrated that this axiom does not hold in mice when caloric restriction is imposed after females wean their first litter. Johnston et al. (2006) observed a negative relationship between fecundity and litter mass with historical energy intake and body fat.
Commercial gilts are often managed to achieve BW of at least 136 kg with adequate backfat at breeding, although the amount of backfat that is adequate is not well defined. These targets are often achieved with management practices that include ad libitum access to feed to breeding age and subsequent ad libitum access to feed only during the lactation period. However, a series of experiments by Klindt et al. (1999, 2001a,b) demonstrated that moderate feed restriction during prepubertal development of gilts may increase reproductive efficiency through first parity.
Optimum development regimens for gilts may depend on the prolificacy of the genetic line and on the rate of lean growth. We initiated an experiment with the overall objective of estimating the effects of 25% restriction of energy vs. ad libitum access to feed from 123 d of age to breeding on reproduction and longevity through parity 4 of females of 2 lines that differ in rate of lean growth and litter size. Herein, feed intake and effects on growth and age at puberty are presented. Effects on reproduction through parity 4 and relationships of reproduction and longevity with growth traits through 235 d of age will be reported later.
MATERIALS AND METHODS
This research was approved by the University of Nebraska Institutional Animal Care and Use Committee. The experiment was conducted in 4 replications with 157 to 185 gilts per replication. Gilts of 2 genetic lines known to differ in lean growth rate and reproductive rate were allowed ad libitum access to feed from weaning to 123 d of age and either ad libitum access to feed, or 75% of ad libitum intake, from 123 d of age to breeding.
Experimental Gilts
Project gilts were selected from litters born during December, 2004, and January, 2005 (Rep 1); May, 2005 (Rep 2); November, 2005 (Rep 3); and May and June, 2007 (Rep 4). Dams of the gilts were either Large White-Landrace cross females or Nebraska Line 45 females. The Large White-Landrace dams were from a 2-breed rotation breeding system in which sows with Large White and Landrace sires were inseminated with semen of Landrace and Large White boars, respectively. Semen was purchased from the AI center of a major US breeding company (Danbred North America, Columbus, NE) and was representative of their commercial maternal lines. Historical selection in the nucleus populations from which semen originated was for increased reproduction and lean growth rate. The Line 45 dams were from generations 23 and 24 of the Nebraska line (Line 45) that had been selected for increased litter size only (generations 1 through 18) or increased litter size and within litter selection for increased growth and decreased backfat (generations 19 through 24). Line 45 was a cross of the IOL and COL lines described by Ruíz-Flores and Johnson (2001) and subsequently selected for increased litter size and lean growth.
Both the Large White-Landrace and Line 45 females were inseminated with semen from boars of an unrelated industry maternal line (LM) to produce litters from which project gilts were selected. The LM semen was provided by a second major US breeding company (Newsham Choice Genetics, West Des Moines, IA) and was representative of boars of one of their maternal lines. Semen was collected and packaged from individual boars with known identities, and semen from each boar was inseminated into both Large White-Landrace and Line 45 females to produce families of half-sib litters that contained gilts of both genetic lines of dam. Project gilts were selected randomly from these litters when pigs were approximately 50 d of age. When possible, at least 2 gilts were selected per litter so that gilts of each litter could be assigned to each of the 2 gilt developmental regimens. Gilts by Large White-Landrace dams and LM sires are designated LW/LR, and those by Line 45 dams and LM sires are designated L45X. Because LW/LR females were produced with dams representing 2 maternal lines of 1 breeding company and sires representing a maternal line of another breeding company, this exact female is not available to producers but is considered to be representative of maternal females available to US pork producers. The L45X females are similar to the GPK347 females described by Moeller et al. (2004) and represent a product that is available to producers. Numbers of gilts, litters, and sires within each replication and line are in Table 1. A total of 662 project gilts from 211 litters by 32 sires started the experiment at approximately 56 d of age.
Numbers of gilts, litters, and sires of gilts within each replication and line1
| Item | Line | Gilts, n | Litters, n | Sires,2 n |
|---|---|---|---|---|
| Replication | ||||
| 1 | LW/LR | 80 | 29 | 10 |
| L45X | 80 | 24 | 11 | |
| 2 | LW/LR | 100 | 20 | 7 |
| L45X | 57 | 15 | 6 | |
| 3 | LW/LR | 80 | 19 | 6 |
| L45X | 79 | 37 | 7 | |
| 4 | LW/LR | 95 | 50 | 9 |
| L45X | 90 | 17 | 7 | |
| Total | LW/LR | 355 | 118 | 32 |
| L45X | 306 | 93 | 31 |
1LW/LR = Large White-Landrace cross; L45X = Nebraska selection Line 45 cross. One-half of the gilts within each litter were randomly assigned to each gilt developmental regimen.
2The same sires were used to produce gilts of both lines.
Management of Gilts
At birth, pigs from litters the gilts were born in were crossfostered both within and among sows of the 2 lines to reduce variation in number of pigs nursed by dams. Litters in Rep 1 to 4 were weaned at an average age of 13.3, 16.7, 15.7, and 18.0 d, respectively, with a range from 11 to 26 d. At weaning, pigs were placed in a nursery with 30 pigs per pen where they remained until they were moved to a naturally ventilated building with thermostatically controlled curtains on the north and south windows.
Standard nursery diets and management were used. Gilts were moved from the nursery at average ages of 56.2, 53.8, 72.2, and 58.9 d within Rep 1 to 4, respectively, with a range of 46 to 80 d. They were weighed and placed in pens of 10 pigs per pen by line, age, and litter. All pens were approximately 1.6 × 5.4 m2 with 1/3 slatted and 2/3 solid surface, providing approximately 0.86 m2 total floor space and 0.29 m2 feeding space per gilt. Gilts of LW/LR and L45X lines were assigned to alternate pens, and littermates were assigned to different pens (e.g., pens 1 and 3 contained littermates, pens 2 and 4 contained littermates, and so on). Within each of these pairs of pens within lines, 1 pen was randomly assigned to an ad libitum feeding regimen and the other to a restricted feeding regimen as described below.
Feeding Regimens
Gilts received the same diet and management through the nursery period and from when they were placed in the growing barn until an average age of 123 d. From the time gilts were moved to the grower barn, they had ad libitum access to a standard corn-soybean meal diet. A 3-phase feeding regimen was used. The phase 1 diet contained 1.15% lysine and was fed from entry to the growing barn to when pigs in a pen averaged 36 kg of BW. The phase 2 diet contained 1.0% lysine and was fed from mean BW of 36 to 60 kg. The phase 3 diet contained 0.9% lysine and was fed from 60 kg until gilts were 123 d of age, when they were placed on experimental dietary regimens.
Experimental diets fed to gilts during the developmental period are presented in Table 2. The ad libitum feeding regimen (AL) was one in which gilts were provided ad libitum access to feed in a self-feeder during the entire period from 123 d of age until they were moved to the breeding barn approximately 1 wk before breeding commenced. The diet was corn-soybean meal-based and formulated to contain 0.70% lysine, 0.70% Ca, and 0.60% P. All other nutrients met or exceeded requirements for growing gilts described by NRC (1998). Gilts on the restricted feeding regimen (Res) received a daily allotment of feed by BW that was calculated to be 75% of that consumed by gilts receiving the AL regimen. The diet was formulated similarly to the one fed gilts on the AL regimen except that it was formulated to contain 0.93% lysine, 1.0% Ca, and 0.8% P. All minerals (except selenium) and vitamin concentrations were also increased to compensate for reduced feed intake.
Composition and calculated analysis (as-fed basis) of ad libitum (AL) and restricted (Res) diets fed to gilts during the development period (d 123 to 1 wk before breeding)
| Item | Diet | |
|---|---|---|
| AL | Res | |
| Ingredient, % | ||
| Corn | 77.37 | 67.74 |
| Soybean meal, 46.5% CP | 16.60 | 25.00 |
| Tallow | 3.00 | 3.00 |
| Dicalcium phosphate | 1.48 | 2.38 |
| Limestone | 0.65 | 0.85 |
| Salt | 0.50 | 0.50 |
| Vitamin premix1,2 | 0.25 | 0.33 |
| Mineral premix3,4 | 0.15 | 0.20 |
| Total | 100 | 100 |
| Calculated analysis | ||
| ME, kcal/kg | 3,442 | 3,402 |
| CP, % | 14.30 | 17.50 |
| Lysine, % | 0.70 | 0.93 |
| Ca, % | 0.70 | 1.00 |
| P, % | 0.60 | 0.80 |
1Diet AL supplied per kilogram of diet: vitamin A (as retinyl acetate), 4,400 IU; vitamin D (as cholecalciferol), 440 IU; vitamin E (as α-tocopherol acetate), 24 IU; vitamin K (as menadione dimethylpyrimidinol bisulfite), 3.5 mg; riboflavin, 8.8 mg; d-pantothenic acid, 17.6 mg; niacin, 26.4 mg; and vitamin B12, 26.4 mg.
2Diet Res supplied per kilogram of diet: vitamin A (as retinyl acetate), 5,878 IU; vitamin D (as cholecalciferol), 588 IU; vitamin E (as α-tocopherol acetate), 32 IU; vitamin K (as menadione dimethylpyrimidinol bisulfite), 4.7 mg; riboflavin, 11.8 mg; d-pantothenic acid, 23.5 mg; niacin, 35.3 mg; and vitamin B12, 35.2 mg.
3Diet AL supplied per kilogram of diet: Zn (as ZnSO4), 127 mg; Fe (as FeSO4·H2O), 128 mg; Mn (as MnO), 30 mg; Cu (as CuSO4·5H2O), 11 mg; I [as Ca(IO3)·H2O], 0.26 mg; Se (as Na2SeO3), 0.3 mg.
4Diet Res supplied per kilogram of diet: Zn (as ZnSO4), 171 mg; Fe (as FeSO4·H2O), 171 mg; Mn (as MnO), 40 mg; Cu (as CuSO4·5H2O), 14.7 mg; I [as Ca(IO3)·H2O], 0.35 mg; Se (as Na2SeO3), 0.3 mg.
When gilts were moved to the grower barn and at 2-wk intervals thereafter, feed delivered to each pen during each interval and beginning and ending feeder weights were recorded. Average daily feed intake for each pen of gilts on the AL regimen during each 2-wk period, and the mid-BW (MW) of gilts in that pen [(mean beginning BW + mean final BW)/2] were calculated. After each weigh period, quadratic regression equations of ADFI on MW were calculated separately for LW/LR and L45X gilts using all ADFI and MW data collected to that date. Beginning at 123 d of age, predicted MW of gilts in each pen on the RES regimen during the next 2-wk period was calculated from past growth and used in the regression equation to calculate the expected ADFI for the pen if ad libitum access to feed was assigned. The average daily allotment for gilts in that pen during the next period was set at 75% of that value. The allotment of feed was placed on the solid flooring daily in 2 feedings, one-half at approximately 0800 h and one-half in late afternoon between 1500 and 1600 h. There likely was variation among pigs in daily feed intake relative to BW because several effects, including BW, contribute to rate of feed intake (Wellock et al., 2003; Rauw et al., 2006). Floor feeding in pens that contained slats may have resulted in feed wastage so that actual feed consumed was less than the allotted amount. The daily allotment of feed was provided in 2 meals to reduce the opportunity for wastage. Behavior was observed each time feed was placed in pens. All pigs ate when feed was delivered, feed was consumed quickly (usually less than 10 min), and feed seldom was pushed unto the slatted portion of the pen. These observations indicate that there was little wastage and that on average pigs consumed very close to their daily allotment of feed.
Overall, gilts averaged 122.7 d of age when the restricted feeding regimen was imposed. However, there was some variation among replications, and the average ranged from 118.9 d in Rep 4 to 127.7 d in Rep 2. At the end of the experiment, Rep 1, 2, 3, and 4 gilts averaged 235.8, 218.3, 225.7, and 231.1 d of age, respectively.
Traits
Gilt BW was recorded at 2-wk intervals beginning when gilts were moved to the grower barn and terminating when they were moved to the breeder barn. Backfat (BF) and LM area (LMA) were measured at 2-wk intervals beginning when gilts were placed on the developmental regimens at 123 d of age and terminated when they were moved to the breeding barn. The BF and LMA were measured with an Aloka 500V real-time ultrasound instrument equipped with a 3.5-MHz, 17-cm linear transducer (Corometrics Medical System Inc., Wallingford, CT), with the probe placed approximately at the 10th rib, 6.4 cm off the midline, and perpendicular to the skin surface.
Dates gilts were removed from the experiment for death, injury, or health, as well as the reasons for removal, were recorded. When possible, gilts were removed from the experiment at the end of a 14-d period. If they died or had to be removed between weigh days, ADFI and MW were adjusted based on the BW of the pig removed from the pen.
Beginning when mean age of pigs in each pen was 140 d, heat-checking to determine age at puberty commenced. It was accomplished once daily by moving pigs from each pen to an adjacent building where they were exposed to a boar for approximately 15 min and observed for the standing response indicative of estrus. The day of first observed estrus was considered to be age at puberty. Heat checking continued until gilts were moved to the breeding barn or until all gilts in the pen had been observed in estrus at least twice.
Statistical Analyses
Because of variation in beginning and final ages of gilts among replications, there were 13, 12, 11, and 12 fourteen-day periods in Rep 1 to 4, respectively, during which traits were recorded. The period when the restricted feeding regimen was imposed was set as period 0 and all other periods were deviated (+ or −) from that period so that among replications, feeding periods were designated as period −5 to period 7. To account for variation in age within periods, beginning age for gilts in each pen at each period was deviated from target age and used as a covariate in the models described below. Target beginning age was set at 123 d for period 0 when feed restriction was imposed and decreased/increased by 14 d for each period to produce beginning target ages of 53 d for period −5 and 221 d for period 7. A period 8 (final measurement) was defined for traits measured on individual pigs (BW, BF, and LMA), and target age for this period was 235 d. All traits were analyzed with the MIXED, REPEATED MEASURES procedure (SAS Inst. Inc., Cary, NC) as described by Littell et al. (2006).
Pen Means, ADFI, and G:F.
The variance/covariance structure among periods was modeled with compound symmetry, first-order autoregressive, first-order autoregressive with heterogeneous variance, Toeplitz, Toeplitz with heterogeneous variance, and first-order ante-dependence models as described by Littell et al. (2006). These alternative models were compared with the corrected Akaike's information criterion (AICC). For both ADFI and G:F, the AICC value was smallest, indicating the best fit, for the Toeplitz model with heterogeneous variance. Fixed effects were tested, and least squares means and SE at age deviation within period equal to zero were calculated with that model. To illustrate responses across periods, line × feeding regimen least squares means at each period were fitted to a model that included line, feeding regimen, and within line × feeding level linear and quadratic regressions on target age.
BW, BF, and LMA.
For all 3 traits, this model converged only when replication was considered fixed. In addition, convergence was attained for BW only for compound symmetry and first-order auto regressive covariance structures. For BF and LMA, convergence was also attained for the first-order autoregressive model with heterogeneous variance. Models with the least AICC value were first-order autoregressive for BW and first-order autoregressive with heterogeneous variance for BF and LMA. Models with the smallest AICC values were used for testing main effects and generating least squares means for each trait.

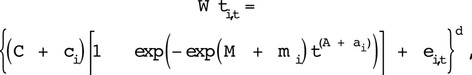
 respectively. Covariances among random effects in the model may exist and can theoretically be fitted. However, such a full model with all random effects and covariances did not converge for any line × treatment subclass. Therefore, reduced models sequentially eliminating random effects and covariances were fitted and, when they converged, were compared by evaluating AICC values. By applying these procedures, it was determined that a model with random gilt effects for mature BW (ci) adequately described growth of gilts in each subclass. Values of 1 for parameter d indicate homogenous CV in BW as age increases, and values greater or less than 1 indicate increasing or decreasing variation as age increases. Values of d were 0.93 and 1.02, respectively, for LW/LR and L45X gilts receiving the ad libitum feeding regimen, and 0.99 and 1.07 for these lines when restricted in intake, and in each case including d in the models caused very small reductions in the value of AICC. Thus, changes in variances within line × treatment subclasses were approximately proportional to the change in mean with age. The final model was
Estimates of the parameters and SE were produced for each line × treatment group and used to plot growth relative to age. In addition, the basic model was fitted by pig to generate C, M, and A values for each pig that will be used in subsequent analyses to relate these descriptors of growth with longevity and lifetime reproductive performance.
Attempts to adapt these nonlinear methods to BF and LMA relative to both age and BW were not successful. Various models were attempted, but either convergence was not attained or results fitted observed means very poorly. Therefore, to describe changes in BF and LMA with increasing age, line × feeding regimen least squares means at each period from the repeated measures analyses were fitted to a model that included line, feeding regimen, and within line × feeding level linear and quadratic regressions on target age.
Age at Puberty.
RESULTS
Of the 661 gilts that started the experiment, 22 died or were removed for health reasons before 235 d of age (Table 3). These losses during any period of time did not appear to be related to line or feeding regimen.
Numbers of Large White-Landrace (LW/LR) and Line 45 cross (L45X) gilts at initiation of the experiment (56 d of age), initiation of developmental regimens (123 d of age), at final growth measurements (235 d of age), and numbers expressing a pubertal estrus for gilts developed with ad libitum access to feed (AL) or 75% of ad libitum (Res) from 123 to 235 d of age
| Item | Feeding regimen | 53 d of age | 123 d of age | 235 d of age | Pubertal estrus |
|---|---|---|---|---|---|
| Line | |||||
| LW/LR | AL | 177 | 176 | 174 | 159 |
| LW/LR | Res | 178 | 176 | 171 | 133 |
| L45X | AL | 153 | 151 | 147 | 143 |
| L45X | Res | 153 | 152 | 147 | 133 |
| Total | 661 | 655 | 639 | 568 |
Interactions of line with period existed for BW, BF, and LMA (Table 4; P < 0.01). Interactions of treatment with period existed for all traits except G:F (P < 0.01). Three order interactions existed only for BF (P < 0.01). Responses are illustrated in tables and graphs of data for each trait.
Probabilities of greater F-values for tests of fixed effects in final models of each trait1
| Source of variation | ADFI, kg | G:F, kg/kg | BW, kg | BF, cm | LMA, cm2 | AP(B) | AP, d |
|---|---|---|---|---|---|---|---|
| Line | 0.101 | 0.791 | <0.001 | 0.654 | <0.001 | 0.006 | 0.002 |
| Feeding regimen (T) | <0.001 | 0.009 | <0.001 | <0.001 | <0.001 | <0.001 | 0.020 |
| Line × T | 0.444 | 0.434 | 0.648 | 0.010 | 0.648 | 0.626 | 0.227 |
| Period (Per) | <0.001 | <0.001 | <0.001 | <0.001 | <0.001 | ||
| Line × Per | 0.629 | 0.758 | <0.001 | <0.001 | <0.001 | ||
| T × Per | <0.001 | 0.575 | <0.001 | <0.001 | <0.001 | ||
| Line × T × Per | 0.059 | 0.951 | 0.396 | 0.014 | 0.396 | ||
| Age deviation2 | <0.001 | <0.001 | <0.001 | <0.001 | <0.001 |
1BF = backfat thickness, LMA = LM area, AP(B) = binomial score for whether gilts did (score = 1) or did not (score = 0) express pubertal estrus, AP = age at puberty for gilts observed in estrus.
2Regression on within period gilt deviation in age from target age. There were 13 periods coded relative to initiation of treatment at 123 d of age (period 0). Target ages were 53 d for the beginning of period −1 and increased by 14 d to 221 d for the beginning of period 7.
Mean ADFI, G:F, and the corresponding SE for line × treatment classes at each period are in Table 5. Probabilities associated with tests of fixed effects are in Table 4. Figures 1 and 2 illustrate quadratic regression responses on age for ADFI and G:F, respectively. Overall, lines did not differ (P > 0.50) in ADFI among periods. Daily feed intake for gilts receiving the AL regimen increased with increasing age to a maximum at approximately 180 d of age and declined slightly thereafter (Figure 1). Feed intake from 123 to 235 d of age for LW/LR and L45X gilts on the Res regimen was 74 and 72.6% of that for gilts on the AL regimen (P < 0.001).
Mean ADFI and G:F during each 14-d period1 (age = age at beginning of period) for Large White-Landrace (LW/LR) and Line 45 cross (L45X) gilts developed with ad libitum access to feed (AL) or 75% of ad libitum intake (Res) from 123 to 235 d of age
| Period1 | Age, d | ADFI, kg | G:F, kg/kg | ||||||||
|---|---|---|---|---|---|---|---|---|---|---|---|
| LW/LR (AL) | LW/LR (Res) | L45X (AL) | L45X (Res) | SEM | LW/LR (AL) | LW/LR (Res) | L45X (AL) | L45X (Res) | SEM | ||
| −5 | 53 | 1.07 | 1.05 | 1.02 | 1.00 | 0.057 | 0.520 | 0.526 | 0.513 | 0.498 | 0.018 |
| −4 | 67 | 1.47 | 1.45 | 1.44 | 1.40 | 0.054 | 0.471 | 0.472 | 0.468 | 0.472 | 0.014 |
| −3 | 81 | 1.77 | 1.77 | 1.69 | 1.70 | 0.053 | 0.459 | 0.459 | 0.470 | 0.465 | 0.009 |
| −2 | 95 | 1.92 | 1.94 | 1.89 | 1.83 | 0.065 | 0.398 | 0.415 | 0.391 | 0.393 | 0.016 |
| −1 | 109 | 2.06 | 2.13 | 2.06 | 1.96 | 0.070 | 0.394 | 0.368 | 0.372 | 0.370 | 0.016 |
| 0 | 123 | 2.34 | 1.65 | 2.15 | 1.61 | 0.076 | 0.324 | 0.283 | 0.322 | 0.287 | 0.019 |
| 1 | 137 | 2.45 | 1.73 | 2.38 | 1.65 | 0.066 | 0.298 | 0.309 | 0.317 | 0.320 | 0.012 |
| 2 | 151 | 2.42 | 1.81 | 2.43 | 1.72 | 0.059 | 0.301 | 0.302 | 0.323 | 0.292 | 0.012 |
| 3 | 165 | 2.57 | 1.84 | 2.65 | 1.78 | 0.063 | 0.293 | 0.281 | 0.279 | 0.266 | 0.012 |
| 4 | 179 | 2.59 | 1.88 | 2.62 | 1.87 | 0.061 | 0.206 | 0.202 | 0.210 | 0.222 | 0.015 |
| 5 | 193 | 2.46 | 1.91 | 2.46 | 1.90 | 0.066 | 0.242 | 0.229 | 0.233 | 0.233 | 0.018 |
| 6 | 207 | 2.42 | 1.92 | 2.48 | 1.88 | 0.065 | 0.239 | 0.219 | 0.263 | 0.233 | 0.016 |
| 7 | 221 | 2.51 | 1.89 | 2.50 | 1.88 | 0.073 | 0.226 | 0.230 | 0.231 | 0.201 | 0.025 |
1There were 13 periods coded relative to initiation of treatment at 123 d of age (period 0). Target ages were 53 d for the beginning of period −1 and increased by 14 d to 221 d for the beginning of period 7.
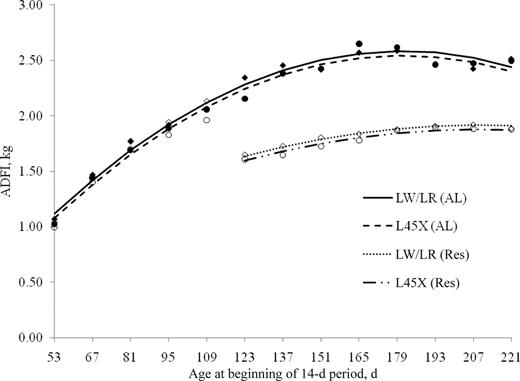
Average daily feed intake during each 14-d period for Large White/Landrace (LW/LR) and Line 45 cross (L45X) gilts developed with ad libitum access to feed (AL) or 75% of ad libitum intake (Res) from 53 to 235 d of age; markers are least squares means: ♦ LW/LR (AL), ◊ LW/LR (Res), • L45X (AL), ○ L45X (Res), and lines are best-fitting lines from repeated measures models.
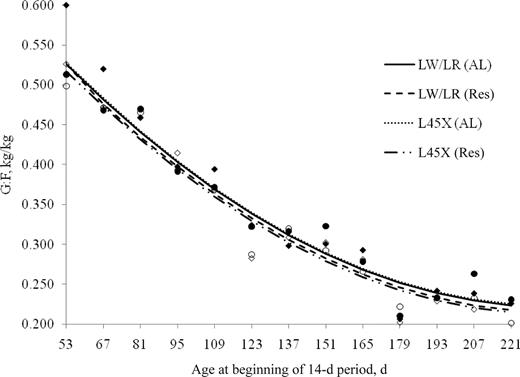
Gain-to-feed ratio during each 14-d period for Large White/Landrace (LW/LR) and Line 45 cross (L45X) gilts developed with ad libitum access to feed (AL) or 75% of ad libitum intake (Res) from 53 to 235 d of age; markers are least squares means: ♦ LW/LR (AL), ◊ LW/LR (Res), • L45X (AL), ○ L45X (Res), and lines are best-fitting lines from repeated measures models.
The G:F ratio differed (P < 0.01) between feeding regimens and among periods (Table 4; Figure 1). The ratio was approximately 0.51 during the first period (53 to 67 d of age) and declined in a curvilinear manner with increasing age to a value of approximately 0.22 during the last period (221 to 235 d of age). From 123 to 235 d of age when the restricted feeding regimen was practiced, G:F for gilts on the AL regimen was 0.012 ± 0.004 greater (P = 0.009) than for gilts on the Res regimen.
Mean BW, BF thickness, and LMA for gilts of each line subjected to each feeding regimen at each age are in Table 6. Line × period and feeding regimen × period interactions existed for all 3 traits (P < 0.001), and the 3-order interaction existed (P = 0.014) for BF (Table 4).
Mean BW, backfat thickness (BF), and LM area (LMA) at each age during 14-d periods for Large White-Landrace (LW/LR) and Line 45 cross (L45X) gilts developed with ad libitum access to feed (AL) or 75% of ad libitum intake (Res) from 123 to 235 d of age
| Age, d | LW/LR, AL | LW/LR, Res | L45X, AL | L45X, Res | SEM |
|---|---|---|---|---|---|
| BW, kg | |||||
| 53 | 17.9 | 16.8 | 17.5 | 16.7 | 0.96 |
| 67 | 26.0 | 25.1 | 24.5 | 23.9 | 0.91 |
| 81 | 35.8 | 34.9 | 33.9 | 33.1 | 0.91 |
| 95 | 47.1 | 46.2 | 45.0 | 44.2 | 0.92 |
| 109 | 58.0 | 57.5 | 55.4 | 54.2 | 0.92 |
| 123 | 69.5 | 68.6 | 66.0 | 64.5 | 0.92 |
| 137 | 80.2 | 75.2 | 76.0 | 71.1 | 0.92 |
| 151 | 90.4 | 82.8 | 86.5 | 78.4 | 0.92 |
| 165 | 100.6 | 90.4 | 97.2 | 85.5 | 0.92 |
| 179 | 111.2 | 97.6 | 107.5 | 92.1 | 0.92 |
| 193 | 118.6 | 102.9 | 115.0 | 97.9 | 0.92 |
| 207 | 127.0 | 109.1 | 122.9 | 104.1 | 0.92 |
| 221 | 135.1 | 114.9 | 132.0 | 110.2 | 0.92 |
| 235 | 143.1 | 120.9 | 139.4 | 115.4 | 0.98 |
| BF, cm | |||||
| 123 | 1.54 | 1.60 | 1.55 | 1.53 | 0.034 |
| 137 | 1.73 | 1.53 | 1.65 | 1.46 | 0.036 |
| 151 | 1.78 | 1.49 | 1.72 | 1.46 | 0.036 |
| 165 | 1.97 | 1.53 | 1.97 | 1.48 | 0.038 |
| 179 | 2.13 | 1.58 | 2.13 | 1.53 | 0.038 |
| 193 | 2.33 | 1.65 | 2.41 | 1.68 | 0.041 |
| 207 | 2.52 | 1.73 | 2.63 | 1.77 | 0.042 |
| 221 | 2.70 | 1.86 | 2.93 | 1.88 | 0.046 |
| 235 | 2.85 | 1.97 | 3.07 | 1.99 | 0.059 |
| LMA, cm2 | |||||
| 123 | 26.1 | 25.7 | 25.4 | 24.5 | 0.35 |
| 137 | 29.0 | 27.8 | 27.2 | 26.0 | 0.39 |
| 151 | 31.6 | 29.7 | 29.4 | 27.3 | 0.37 |
| 165 | 35.0 | 32.4 | 32.9 | 30.5 | 0.39 |
| 179 | 37.8 | 35.0 | 36.1 | 32.2 | 0.42 |
| 193 | 39.4 | 35.7 | 37.3 | 33.4 | 0.41 |
| 207 | 40.3 | 37.1 | 39.7 | 34.4 | 0.44 |
| 221 | 42.4 | 37.6 | 41.5 | 35.7 | 0.45 |
| 235 | 43.8 | 38.8 | 43.2 | 37.2 | 0.57 |
Estimates of parameters in nonlinear models of BW on age are in Table 7, and growth curves for each line subjected to each feeding regimen are illustrated in Figure 3. When developed on the AL regimen, the estimate of the kinetic order constant, A, was greater for LW/LR than for L45X gilts, but estimates of the exponential growth decay constant, M, and mature BW, C, were greater for L45X gilts. For each parameter, the estimate for 1 line was outside the 95% lower and upper bounds of the estimate for the other line, providing evidence for different growth patterns in the lines, although there was overlap of the total range of upper and lower bounds themselves between lines. The LW/LR gilts were heavier at all ages with the difference being relatively small at young ages, increasing to maximum differences at 150 to 180 d of age; thereafter, growth rate of L45X gilts was greater due in part to the greater estimate of mature BW (Figure 3). The Res regimen had the greatest effect on estimates of the M and C parameters. Within lines, the 95% upper and lower bounds for these parameter estimates did not overlap between gilt developmental regimens. Developing gilts on the Res regimen caused estimates of M to increase and estimates of C to decrease. Body weights were greatly reduced, but the general shapes of the curves were similar to that of gilts on the AL regimen. The greatest divergence between lines occurred at ages of 150 to 180 d, and the difference decreased thereafter.
Parameter estimates, SE, and 95% upper (UB) and lower (LB) bounds for parameters in nonlinear growth models for Large White-Landrace (LW/LR) and Line 45 cross (L45X) gilts developed with ad libitum access to feed (AL) to 235 d of age or 75% of ad libitum intake (Res) from 123 to 235 d of age
| Parameter1 | LW/LR (AL) | L45X (AL) | ||||||
|---|---|---|---|---|---|---|---|---|
| Estimate | SE | LB | UB | Estimate | SE | LB | UB | |
| A | 1.88 | 0.013 | 1.86 | 1.91 | 1.83 | 0.016 | 1.80 | 1.87 |
| M | −9.72 | 0.051 | −9.83 | −9.62 | −9.61 | 0.061 | −9.73 | −9.49 |
| C | 169.83 | 2.281 | 165.33 | 174.34 | 178.87 | 2.995 | 172.95 | 184.78 |
| se1 | 16.01 | 0.496 | 15.04 | 16.99 | 18.74 | 0.632 | 17.49 | 19.98 |
| se2 | 503.83 | 55.451 | 394.40 | 613.27 | 373.86 | 46.088 | 282.80 | 464.91 |
| LW/LR (Res) | L45X (Res) | |||||||
| A | 1.87 | 0.015 | 1.84 | 1.90 | 1.80 | 0.017 | 1.77 | 1.83 |
| M | −9.33 | 0.061 | −9.45 | −9.21 | −9.08 | 0.068 | −9.21 | −8.94 |
| C | 128.52 | 1.694 | 125.18 | 131.86 | 128.40 | 1.782 | 124.88 | 131.92 |
| se1 | 17.21 | 0.536 | 16.15 | 18.27 | 16.62 | 0.560 | 15.52 | 17.73 |
| se2 | 368.19 | 40.416 | 288.43 | 447.96 | 262.92 | 32.093 | 199.51 | 326.33 |
1A = kinetic order constant, M = exponential growth decay constant, C = average mature BW, se1 = variance in mature BW, and se2 = residual variance.
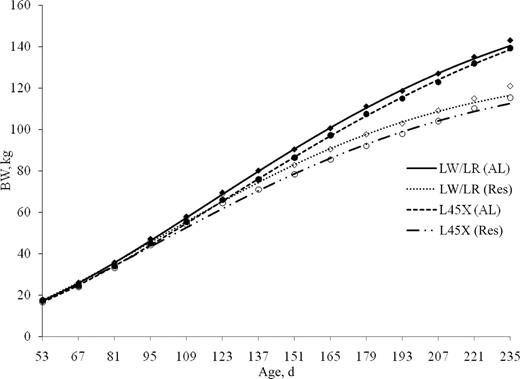
Nonlinear growth curves for Large White/Landrace (LW/LR) and Line 45 cross (L45X) gilts developed with ad libitum access to feed (AL) or 75% of ad libitum intake (Res) from 53 to 235 d of age; markers are least squares means: ♦ LW/LR (AL), ◊ LW/LR (Res), • L45X (AL), ○ L45X (Res), and lines are from nonlinear equations (Table 7).
A line × feeding regimen × period interaction existed (P = 0.014) for BF thickness. Backfat at 123 d of age was similar for gilts of both lines (Table 6; Figure 4). When developed on the AL regimen, BF of LW/LR and L45X gilts remained similar until approximately 180 d of age. Thereafter, L45X gilts had greater BF thickness (Figure 4). As expected, BF for gilts developed on the Res regimen was less than for those on the AL regimen, but a curvilinear increase with age also occurred. However, unlike the result for gilts on the AL regimen, BF for LW/LR and L45X gilts on the R regimen did not diverge with increasing age.
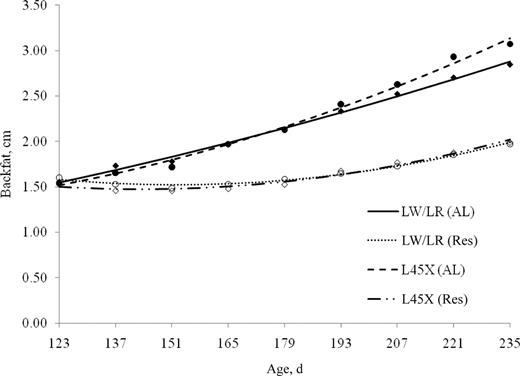
Backfat thickness at each age for Large White/Landrace (LW/LR) and Line 45 cross (L45X) gilts developed with ad libitum access to feed (AL) or 75% of ad libitum intake (Res) from 53 to 235 d of age; markers are least squares means: ♦ LW/LR (AL), ◊ LW/LR (Res), • L45X (AL), ○ L45X (Res), and lines are best-fitting lines from repeated measures models.
Line × period and feeding regimen × period interactions existed (P < 0.001) for LMA (Table 4). The LMA of LW/LR gilts was greater than that of L45X gilts at all ages, with the greatest difference at ages of 150 to 190 d, decreasing thereafter (Figure 5).
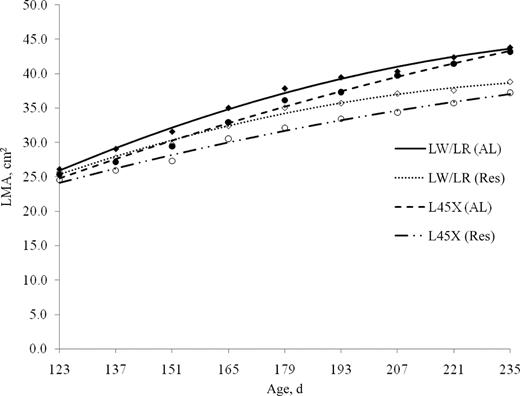
Longissimus muscle area (LMA) at each age for Large White/Landrace (LW/LR) and Line 45 cross (L45X) gilts developed with ad libitum access to feed (AL) or 75% of ad libitum intake (Res) from 53 to 235 d of age; markers are least squares means: ♦ LW/LR (AL), ◊ LW/LR (Res), • L45X (AL), ○ L45X (Res), and lines are best-fitting lines from repeated measures models.
Line and feeding regimen affected the proportion of gilts that expressed a pubertal estrus (line, P = 0.007; feeding regimen, P < 0.001) and their age at puberty (line, P = 0.003; feeding regimen, P = 0.017), but there was no interaction (P > 0.25) for either trait (Table 8). Five percent more L45X gilts than LW/LR gilts expressed estrus, and their average age at puberty was 5.6 ± 1.86 d less. More gilts developed with the AL regimen than the Res regimen expressed estrus by 235 d of age (0.98 vs. 0.91) and their age at puberty was 3.4 ± 1.41 d less.
Probability gilts expressed pubertal estrus and mean age at puberty for Large White-Landrace (LW/LR) and Line 45 cross (L45X) gilts developed with ad libitum access to feed (AL) or 75% of ad libitum intake (Res) from 123 d of age
| Line | Feeding regimen | Probability of expressing pubertal estrus1 | Age at puberty,2 d | ||
|---|---|---|---|---|---|
| Mean | SEM | Mean | SEM | ||
| LW/LR | 0.93 | 0.025 | 178.6 | 3.33 | |
| L45X | 0.98 | 0.010 | 173.0 | 3.34 | |
| AL | 0.98 | 0.010 | 174.1 | 3.27 | |
| Res | 0.91 | 0.029 | 177.7 | 3.29 | |
| LW/LR | AL | 0.97 | 0.014 | 177.7 | 3.44 |
| LW/LR | Res | 0.86 | 0.046 | 179.5 | 3.50 |
| L45X | AL | 0.99 | 0.010 | 170.6 | 3.48 |
| L45X | Res | 0.94 | 0.024 | 175.5 | 3.50 |
1Line, P = 0.007, feeding regimen, P < 0.001, interaction, P = 0.47.
2Line, P = 0.003, feeding regimen, P = 0.017, interaction, P = 0.27.
DISCUSSION
The goal of restricting energy intake during the gilt developmental period was to restrict fat deposition relative to BW without greatly affecting muscle development. Thus, the diet was formulated to restrict energy intake, but not the intake of other nutrients. The long-term objective was to determine the effect of this regimen compared with ad libitum access to feed on subsequent reproductive performance through 4 parities.
Merry (2002) summarized results of experiments with several species in which there were prolonged periods of energy restriction beginning postweaning and concluded that such restriction, without limiting other nutrients, results in increased longevity that is approximately proportional to the level of restriction. Our results apply strictly to energy restriction in female pigs from 123 to 230 d of age, which is not prolonged restriction, compared with no energy restriction during that period. Subsequent to 230 d of age, all females in our project were restricted in feed intake as they were managed similarly to the standard industry practice of feeding a restricted amount of feed daily during all periods of the reproductive life except during lactation, approximately 20 d, when females are allowed ad libitum access to feed.
Several experimental approaches may be used to limit energy intake, nutrient intake, or both. The strategy herein was to restrict energy intake at approximately 75% of the ad libitum amount to reduce fat deposition, but not lean deposition, relative to BW. It was important that nutrients other than energy (vitamins, minerals, and AA) were not restricted so the nutrient density of the diet for gilts on the Res regimen was increased relative to the density of the diet for gilts on the AL regimen. These treatments produced differences in growth rate in both populations. Unpublished data from this experiment demonstrate that this approach was an excellent model to study the effects of energy intake during the developing period on sow productivity through 4 parities.
The main goal of the feeding regimen was achieved. The means in Table 6 were used to calculate ratios of BF and LMA to BW at different ages. These ratios at 123 d of age before energy restriction was imposed were 0.023 cm of BF per kg of BW and 0.379 cm2 of LMA per kg of BW. The ratio of BF to BW for gilts developed on the AL regimen remained at approximately this same value throughout the experiment, averaging 0.0197, 0.0196, and 0.0200 cm/kg for LW/LR gilts at 151, 193, and 221 d of age, respectively, and 0.0199, 0.0210, and 0.0220 cm/kg for L45X gilts at these same ages. The BF-to-BW ratios at these ages for gilts developed on the Res regimen were 0.0180, 0.0166, and 0.0162 cm/kg for LW/LR gilts and 0.0186, 0.0172, and 0.0170 cm/kg for L45X gilts. After 123 d of age, gilts developed on the Res regimen had less LMA at the same age than those on the AL regimen, but LMA relative to BW was similar throughout the entire growth curve for gilts developed on both the AL and Res regimens. The ratio of LMA to BW at 151, 193, and 221 d of age was 0.345, 0.329, and 0.314 cm2/kg, respectively, for gilts developed on the AL regimen and 0.353, 0.344, and 0.326 cm2/kg for gilts developed on the Res regimen. Thus, relative to BW, gilts on the Res regimen had less BF than gilts on the AL regimen, but similar LMA.
Restricting energy intake decreased G:F, with the greatest reduction occurring in the first 2-wk period (123 to 137 d of age) following energy restriction. Thereafter, there was only a small difference in G:F between gilts developed with the AL and Res regimens. Because little feed wastage was observed, it appears that gilts developed with the Res regimen adapted quickly to decreased daily feed intake, and after adaptation, metabolic efficiency of gilts on the 2 regimens was similar.
Growth was modeled with the nonlinear model described by Bridges et al. (1986), discussed by Schinckel and de Lange (1996), and used to model growth in several applications (e.g., to model interactions of genetic line and floor space on growth; Hamilton et al., 2003). All gilts were weighed every 14 d from 56 to 235 d of age, similar to recommendations by Schinckel and de Lange (1996) for experiments to estimate shapes of growth curves, avoiding possible bias from removing pigs during the test period and weighing pigs at target ages rather than target BW. The goal was to use a model that appropriately described growth of each gilt and to relate estimates of model parameters to subsequent reproductive performance to determine whether gilts with different types of growth curves developed on the AL and Res feeding regimens differ in reproduction and longevity.
A typical sigmoidal growth curve occurred for gilts developed with the AL regimen, increasing slightly in a curvilinear fashion from 56 to approximately 80 d of age, approximately linear from 80 to 180 d of age, and decreasing in a curvilinear fashion thereafter. Similar shapes of growth curves have been reported for other genetic lines (Hamilton et al., 2003; Schinckel et al., 2008). Growth of gilts on the Res regimen followed this same pattern, but the curve from 123 to 235 d of age was flatter than for the AL regimen. The main effect of the Res regimen compared with the AL regimen was to reduce the estimates of C (mature BW) and A (kinetic order constant) and increase the estimate of M (exponential growth decay constant).
A greater percentage (5%) of L45X than LW/LR gilts expressed puberty by 235 d of age, and they were 5.6 d younger when first observed in estrus. No other direct comparisons of age at puberty in these populations exist, but the result is consistent with the negative genetic trend in the Nebraska selection lines that were crossed to form Line 45 (Ruíz-Flores and Johnson, 2001). Feeding regimen also affected both the percentage of gilts that expressed estrus and their age at first estrus, and the effect was similar in both lines. When developed on the AL regimen compared with the Res regimen, 7% more gilts expressed a pubertal estrus and they were 3.4 d younger at first observed estrus.
Klindt et al. (1999, 2001a,b), reported results of an experiment that evaluated the effect of prepubertal feed intake on growth and reproductive development of gilts. The objectives were similar to those of our experiment, although the gilt developmental regimens were somewhat different. Gilts were developed with either ad libitum access to feed from 91 to 175 d of age, ad libitum access to feed from 91 d of age to 100 kg of BW and 90% of ad libitum intake to 175 d of age, or 74% of ad libitum intake from 91 to 175 d of age. All gilts were offered ad libitum access to feed during the estrus detection and breeding period that began at 175 d of age. Effects on BW and BF during the energy restriction period were similar to our results (Klindt et al., 1999). Restricting energy intake did not affect age at puberty. However, the rate at which gilts attained puberty (percentage pubertal after 28 d of estrus detection) was greater for gilts developed throughout with ad libitum access to feed (75%) than those restricted in feed intake (61%). Further evaluations of these females at 30 d of gestation (Klindt et al., 1999), at first parity (Klindt et al., 2001a), and efficiency of feed use for reproduction suggested that moderate feed restriction during the gilt developmental period reduced feed costs without affecting piglet production. Consistent with our results, others also found that decreasing energy intake during the growing period decreased ADG and increased age at puberty (den Hartog, 1985; Le Cozler et al., 1998). Thus, it appears that developing gilts with restricted energy intake reduces age at puberty. However, natural variation in gilt prepubertal ADG within a population does not appear to be related to age at puberty (Rozeboom et al., 1995).
It is difficult to separate the effects of energy/nutrient intake and growth rate on age at puberty because of the potentially confounding effects on body composition (fatness). Although current industry practices avoid severely over- or underfeeding gilts during the developmental period, relatively little information is available regarding the effects of energy/nutrient intake on prepubertal estrus expression and subsequent sow productivity. Patterson et al. (2002) compared the effects of diets formulated to maximize lean gain vs. reduced energy/lysine diets on puberty attainment in gilts. Age at puberty was not affected by average lean growth from 50 kg to 135 d of age (initiation of boar stimulation/heat detection). However, lean growth rate (at the time of estrus detection) was negatively correlated with age at puberty. Therefore, the relationship between growth rate and age at puberty may depend on the timeframe during which growth rate is calculated.
Similar to our findings with pigs, moderate caloric restriction before puberty delays onset of puberty in rats (Merry and Holehan, 1979; McShane and Wise, 1996), but often results in extended life span. The works by Klindt et al. (1999, 2001a,b) indicate prepubertal energy restriction in gilts is not detrimental to subsequent reproduction through first parity. To develop practical gilt developmental regimens, it will be important to know effects on lifetime production. Several studies have examined the effects of nutrient manipulation during the growth period, gestation, or both on reproductive performance during the subsequent lactation (Hoppe et al., 1990; Newton and Mahan, 1993; Patterson et al., 2002). Our experiment is the first designed to examine the effects of genetic line and feeding regimen (energy intake) on gilt development and subsequent reproduction through 4 parities. Because of increased density of nutrients other than energy, the Res diet was more expensive than the AL diet. Economic analyses are needed to determine the cost effectiveness of that regimen compared with the AL regimen on efficiency of pork production.
LITERATURE CITED
Footnotes
A contribution of the University of Nebraska Agricultural Research Division (Lincoln), supported in part by funds provided through the Hatch Act. Additional support was provided by National Pork Board (Lincoln, NE) and Nebraska Pork Producers Association (Lincoln).
