


ABSTRACT
Modern animal breeding programs are largely based on biotechnological procedures, including AI and embryo transfer technology. Recent breakthroughs in reproductive technologies, such as somatic cell nuclear transfer and in vitro embryo production, and their combination with the emerging molecular genetic tools, will further advance progress and provide new opportunities for livestock breeding. This is urgently needed in light of the global challenges such as the ever-increasing human population, the limited resources of arable land, and the urgent environmental problems associated with farm animal production. Here, we focus on genomic breeding strategies and transgenic approaches for making farm animals more feed efficient. Based on studies in the mouse and rat model, we have identified a panel of genes that are critically involved in the regulation of feed uptake and that could contribute toward future breeding of farm animals with reduced environmental impact. We anticipate that genetically modified animals will play a significant role in shaping the future of feed-efficient and thus sustainable animal production, but will develop more slowly than the biomedical applications because of the complexity of the regulation of feed intake and metabolism.
INTRODUCTION
The breeding of domestic animals has a longstanding and successful history, starting with domestication several thousand years ago, in which humans kept animals in their proximity and used products thereof (Larson et al., 2007). Using the technical options that were available in each time period, humans have propagated those populations that they deemed useful for their respective needs and purposes. Selection mostly occurred according to the phenotype, because of specific traits, or both. A scientifically based animal breeding has only existed for ~50 yr, mainly on the basis of population genetics and statistics. A vast number of phenotypically different breeds with desirable traits resulted from this process in an evolutionarily short time period. A good example is cattle, for which nowadays >800 cattle breeds can be found worldwide (Beja-Pereira et al., 2006). These breeds are not just variations of the same archetype, but differ in qualitative and quantitative characteristics, including specific disease resistance, climate adaptation, lactation performance, fertility, meat quality, and nutrient requirements (Fries and Ruvinsky, 1999). Modern animal breeding programs are primarily based on biotechnological procedures, of which AI is the most prominent one. Today, AI is employed in the vast majority of sexually mature female dairy cattle in countries with advanced breeding programs. Breeding strategies, predominantly based on population genetics, marker-assisted selection, or nowadays genomic selection, AI, and embryo transfer technology (ET), led to significant increases in the performances in domestic animals and are the basis for the regular supply of high-quality animal-derived food at acceptable prices.
Recent breakthroughs in reproductive technologies, such as somatic cell nuclear transfer (SCNT) and in vitro embryo production, and their merger with molecular genetic tools, already developed in the mouse, will further advance progress in this field. The resulting targeted and even conditional transgenesis will be critical for the safe practical application. The efficient use of domestic animals is urgently needed in light of the worldwide shortage of arable land, the environmental impact of farm animal production, and the ever-increasing human population. Genomics offers great opportunities to improve livestock production in the developed world and advance the “livestock revolution” in the developing world (Rothschild and Plastow, 2008). Here, we discuss the perspectives for a feed-efficient production of animal-derived food for human consumption with significantly reduced emission of greenhouse gases. After reviewing the current status, the likely future development of livestock production on a global scale, and a brief update on emerging transgenic technologies, we propose several genes critically involved in feed intake and digestion that could be valuable targets for producing more feed-efficient livestock, thus contributing to a more sustainable livestock production.
THE CURRENT STATUS OF LIVESTOCK PRODUCTION
The global number of livestock animals used in agricultural production has been estimated to be 1.8 billion large ruminants, including cattle, buffaloes and camels, 2.4 billion small ruminants (sheep and goats), almost 1 billion pigs, and ~20 billion poultry.
The current human population of about 7 billion is most likely to rise to ~8 billion by 2030 and to >9 billion people by 2050 (FAO, 2009). The present and future global situation with regard to food security has been reviewed extensively (Steinfeld et al., 2006; SCAR, 2008; Bruinsma, 2009; FAO, 2009; Fischer, 2009; The Royal Society, 2009; Fedoroff et al., 2010; Godfray et al., 2010). In several parts of the world, including Southeast Asia and Latin America, economic welfare will improve and people will experience an increase in affluence that will be associated with a significant change in food preference toward the consumption of more animal-derived protein (Keyzer et al., 2005). To meet this increasing demand, global production of meat is projected to rise from 229 million tons in 1999/2001 to 465 million tons in 2050, and the production of milk will increase from 580 to 1,045 million tons (Steinfeld et al., 2006). These dramatic changes are an enormous challenge for the farmers to grow enough safe feed for the animals.
Conversion of feed into foods of animal origin is associated with energy and nutrient losses and environmental pollution, including excretion of nitrogen, phosphorus, trace elements, carbon dioxide, and methane. The resources such as fuel, water, arable land, and specific minerals, such as P, are limited, but needed for synthesis of phytogenic biomass as fodder for animals (Flachowsky, 2008). Only a small proportion of feed is converted into food products by the animals. This amount is variable and depends on the species, the performance of the individual animal, and several other factors. Most of the substances are emitted into the environment (Tables 1 and 2).
Effects of animal species, production categories, and performance on yields of edible protein per animal or per kilogram of BW and day (Flachowsky, 2002)
| Protein source (BW) | Performance per day | DMI, kg/d | Roughage-to-concentrate ratio (DM basis), % | Edible fraction, % of product or body mass | Protein in edible fraction, g/kg of fresh matter | Edible protein,g/d | Edible protein, g/kg of BW |
|---|---|---|---|---|---|---|---|
| Dairy cow (650 kg) | 10 kg of milk | 12 | 90:10 | 95 | 34 | 323 | 0.7 |
| 20 kg of milk | 16 | 75:25 | 646 | 1.0 | |||
| 40 kg of milk | 25 | 50:50 | 1,292 | 2.0 | |||
| Dairy goat (60 kg) | 2 kg of milk | 2 | 80:20 | 95 | 36 | 68 | 1.1 |
| 5 kg of milk | 2.5 | 50:50 | 170 | 2.8 | |||
| Beef cattle (350 kg) | 500 g1 | 6.5 | 95:5 | 50 | 190 | 48 | 0.14 |
| 1,000 g1 | 7.0 | 85:15 | 95 | 0.27 | |||
| 1,500 g1 | 7.5 | 70:30 | 143 | 0.41 | |||
| Growing/fattening pig (80 kg) | 500 g1 | 1.8 | 20:80 | 60 | 150 | 45 | 0.56 |
| 700 g1 | 2 | 10:90 | 63 | 0.8 | |||
| 1,000 g1 | 2.2 | 0:100 | 81 | 1.0 | |||
| Broiler (1.5 kg) | 40 g1 | 0.07 | 10:90 | 60 | 200 | 4.8 | 3.2 |
| 60 g1 | 0.08 | 0:100 | 7.2 | 4.8 | |||
| Laying hen (1.8 kg) | 50%2 | 0.10 | 20:80 | 95 | 120 | 3.4 | 1.9 |
| 70%2 | 0.11 | 10:90 | 4.8 | 2.7 | |||
| 90%2 | 0.12 | 0:100 | 6.2 | 3.4 |
1Daily BW gain.
2Laying performance.
Effects of animal species, categories, and performances on emissions (per kilogram of edible protein)
| Protein source (BW) | Performance per day | N excretion,% of intake | Methaneemission,1 g/d | Emissions, kg/kg of protein | |||
|---|---|---|---|---|---|---|---|
| P | N | CH41 | CO2eq2 | ||||
| Dairy cow (650 kg) | 10 kg of milk | 75 | 310 | 0.10 | 0.65 | 1.0 | 30 |
| 20 kg of milk | 70 | 380 | 0.06 | 0.44 | 0.6 | 16 | |
| 40 kg of milk | 65 | 520 | 0.04 | 0.24 | 0.4 | 12 | |
| Dairy goat (60 kg) | 2 kg of milk | 75 | 50 | 0.08 | 0.5 | 0.8 | 20 |
| 5 kg of milk | 65 | 60 | 0.04 | 0.2 | 0.4 | 10 | |
| Beef cattle (350 kg) | 500 g3 | 90 | 170 | 0.30 | 2.3 | 3.5 | 110 |
| 1,000 g3 | 84 | 175 | 0.18 | 1.3 | 1.7 | 55 | |
| 1,500 g3 | 80 | 180 | 0.14 | 1.0 | 1.2 | 35 | |
| Growing/fattening pig (80 kg) | 500 g3 | 85 | 5 | 0.20 | 1.0 | 0.12 | 16 |
| 700 g3 | 80 | 5 | 0.12 | 0.7 | 0.08 | 12 | |
| 900 g3 | 75 | 5 | 0.09 | 0.55 | 0.05 | 10 | |
| Broilers (1.5 kg) | 40 g3 | 70 | Traces | 0.04 | 0.35 | 0.01 | 4 |
| 60 g3 | 60 | 0.03 | 0.25 | 0.01 | 3 | ||
| Laying hen (1.8 kg) | 50%4 | 80 | Traces | 0.12 | 0.6 | 0.03 | 7 |
| 70%4 | 65 | 0.07 | 0.4 | 0.02 | 5 | ||
| 90%4 | 55 | 0.05 | 0.3 | 0.02 | 3 | ||
1CH4 emission depending on composition of diet.
2Adequate to carbon footprints for edible protein of animal origin. CO2eq (CO2 × 1; CH4 × 23; N2O × ~300).
3Daily BW gain.
4Laying performance.
The main purpose for maintaining farm animals in such great quantities is the production of valuable protein for human consumption. Large differences exist in protein yields per animal or per kilogram BW depending on species and production category as well as performance status (Table 1). Based on the predicted meat and milk production in 2050 (Steinfeld et al., 2006), an average of 32 g of edible protein of animal origin per person per day would be available. The corresponding figure for 2008 is 22 g, with a range of 1.7 g in Burundi to 69.0 g in the United States (FAO, 2009).
Approximately, one-third of the global greenhouse gas emission stems from agricultural production (Isermeyer et al., 2008). Ruminants contribute substantially to global methane emission (Moss et al., 2000; Kebreab et al., 2004, 2006; Flachowsky and Brade, 2007; Beauchemin et al., 2008; Jouany, 2008). Carbon footprints (CO2eq) are indicative for CO2-emission (CO2 × 1; CH4 × 23; N2O × about 300; IPCC, 2006) per product (e.g., per kilogram of milk or meat), which should alert producers and consumers of animal products of the environmental issues (Williams et al., 2006; Flachowsky and Hachenberg, 2009). Carbon footprint per product serves as an important variable for determining the efficiency of food production. The FAO (2010) has calculated carbon footprints on a global scale and found values between 1.3 kg of CO2eq per kilogram of milk in North America and Europe and 7.5 kg of CO2eq per kilogram of milk in sub-Saharan Africa. Selected emissions with their corresponding CO2-footprints per kilogram of edible protein are shown in Table 2.
To reduce greenhouse gas emissions of the global animal population, the ratio of production/consumption of feed of animal origin has to be reduced and the production of phytogenic biomass has to be increased. The overall efficiency of feed conversion into animal-derived food for human consumption has to be improved. To achieve this goal, several strategies can be envisaged:
Plants must be made more resistant against biotic and abiotic stressors (Flachowsky, 2008).
More low input varieties of plants are needed (SCAR, 2008; The Royal Society, 2009).
Losses during and after harvest of feeds must be avoided.
A more efficient conversion of feed into animal-derived food is achieved (Koning et al., 2008). This requires breeding animals with a more efficient conversion of feed into high-value animal-derived protein while maintaining the health and welfare of the animals. Unfortunately, little is known about how to improve this trait of food-producing animals.
POTENTIAL STRATEGIES TOWARD MORE FEED-EFFICIENT LIVESTOCK
Strategies to produce animals with better utilization of feed into animal-derived food while concomitantly decreasing emissions per product have to be developed. The following strategies are envisaged:
greater feed intake of animals to improve the ratio between energy/nutrient requirements for maintenance and animal yields (Table 3);
greater digestibility of feed to make energy/nutrients more available from the same feed amount;
reduction of energy losses in the digestive tract (e.g., CH4, Table 4);
greater absorption of the digested nutrients;
decreased energy/nutrient requirements for maintenance of the animals (Table 5);
decreased energy need for protein synthesis in the body or increase of anabolic processes and reduced catabolic processes in the animal;
decreased fat content in animal bodies or reduced excretion of fat in milk and eggs or reduced excretion of lactose in milk (reduced energy content in products); and
improved animal health, specifically animals with greater resistance against biotic or abiotic stressors or both and reduced losses during production.
Model calculation to show the influence of DMI (7.0 MJ of NEl/kg of DM) of dairy cows [BW: 650 kg; 4% milk fat; GfE (Gesellschaft für Ernährungsphysiologie), 2001] on energy intake, percentage of maintenance, milk yield, and energy per kilogram of milk as well as emissions per kilogram of milk
| Item | DMI, kg/d | ||||
|---|---|---|---|---|---|
| 10 | 15 | 20 | 25 | 30 | |
| Energy intake, MJ of NEl/d | 70 | 105 | 140 | 175 | 210 |
| Maintenance, 37.7 MJ of NEl/(cow/d); % of total NEl intake | 53.9 | 35.9 | 26.9 | 21.5 | 18.0 |
| Milk yield, 3.3 MJ of NEl/kg | 9.8 | 20.4 | 31.0 | 41.6 | 52.2 |
| NE/kg of milk, MJ of NEl/kg of milk | 7.1 | 5.1 | 4.5 | 4.2 | 4.0 |
| Methane emission1 | |||||
| g/d | 240 | 360 | 480 | 600 | 720 |
| g/kg of milk | 24.5 | 17.6 | 15.5 | 14.4 | 13.8 |
| Carbon footprint,2 g of CO2eq/kg of milk | 825 | 605 | 530 | 495 | 475 |
1According to Flachowsky and Brade (2007): 24 g of CH4/kg of DMI for all diets.
2Calculated on the base of the greenhouse potential of CH4 (×23) and the calculations by Daemmgen and Haenel (2008).
Model calculation to show the influence of methane reduction on the energy available for dairy cows and milk yields [conditions for calculation: DMI: 20 kg/(cow/d); BW: 650 kg per cow, 7 MJ of NEl/kg of DM with 20 g of CH4 emissions]
| Item | Methane reduction | |||
|---|---|---|---|---|
| 30 g/kg of DMI | 25 g/kg of DMI | 20 g/kg of DMI | 15 g/kg of DMI | |
| 600 g/(cow/d) | 500 g/(cow/d) | 400 g/(cow/d) | 300 g/(cow/d) | |
| Energy intake, MJ of NEl/d | 130 | 135 | 140 | 145 |
| Milk yield, kg/d | 28.0 | 29.5 | 31.0 | 32.5 |
| Methane emission, g/kg of milk | 21.4 | 17.0 | 12.9 | 9.2 |
| Carbon footprint,1 g of CO2eq/kg of milk | 735 | 585 | 440 | 315 |
1CO2eq (CO2 × 1; CH4 × 23; N2O × ~300).
Model calculation to show the influence of various energy maintenance requirements on milk yield of lactating cows (BW: 650 kg per cow, DMI: 20 kg/d; NE content of feed: 7.0 MJ of NEl/kg of DM)
| Item | Maintenance requirements for energy | ||||
|---|---|---|---|---|---|
| 0.2 MJ of NEl/kg of BW0.75 | 0.25 MJ of NEl/kg of BW0.75 | 0.3 MJ of NEl/kg of BW0.75 | 0.35 MJ of NEl/kg of BW0.75 | 0.40 MJ of NEl/kg of BW0.75 | |
| 25.7 MJ ofNEl/(cow/d) | 32.2 MJ ofNEl/(cow/d) | 38.6 MJ ofNEl/(cow/d) | 45.0 MJ ofNEl/(cow/d) | 51.5 MJ ofNEl/(cow/d) | |
| Energy intake, MJ of NEl/(cow/d) | 140 | 140 | 140 | 140 | 140 |
| Maintenance, % of NEl-intake | 18.4 | 23.0 | 27.6 | 32.1 | 36.8 |
| Milk yield, kg/(cow/d) | 34.6 | 32.7 | 30.7 | 28.8 | 26.8 |
| Methane emission | |||||
| g/(cow/d) | 480 | 480 | 480 | 480 | 480 |
| g/kg of milk | 13.9 | 14.7 | 15.6 | 16.7 | 17.9 |
| Carbon footprint,1 g of CO2eq/kg of milk | 480 | 505 | 535 | 575 | 615 |
1CO2eq (CO2 × 1; CH4 × 23; N2O × ~300).
Greater Feed Intake
The amount of feed intake depends on animal species and production categories, physiological stage, BW, feed quality and structure, and many other factors (NRC, 1987; Forbes, 1995). Increased feed intake may contribute to a greater energy and nutrient intake and may thus improve the ratio between energy available for performance and maintenance as demonstrated in dairy cows (Table 3). In ruminants, this strategy may reduce the digestibility of OM to a certain degree.
Greater Digestibility of Feed or Nutrients
Another strategy for a more efficient conversion of feed would be breeding animals with a better digestibility or a greater absorption of nutrients or both. This could be done in conjunction with specific plant breeding programs to increase the nutritive value of feed plants (see Stein and Rodriguez-Cerezo, 2009). A greater digestion of feed in the gastrointestinal tract of livestock animals due to greater expression of specific digestive enzymes is also beneficial for a more efficient conversion of feed or nutrients. A prominent example is the expression of phytase to achieve a better digestion of P in nonruminant animals. The new genetic knowledge and tools will allow production of animals with a greater digestibility of nutrients including cellulose, rumen-protected starch in the small intestine, and greater energy efficiency.
Reduced Energy Losses in the Digestive Tract (Especially CH4)
During microbial fermentation, some energy is lost via methane CH4 production from CO2 and H2 (Baldwin, 1995; Mills et al., 2001; Kebreab et al., 2006). The hindgut fermentation contributes ~10% to the total enteric methane production (Kebreab et al., 2006). The losses vary between 4 and 10% of the gross feed energy (Flachowsky and Brade, 2007; Tamminga et al., 2007) and increase with increasing fiber content of the rations (Hindrichsen et al., 2005).
Few studies discuss the impact of the genotype on methane fermentation in the digestive tract of ruminants (Ferris et al., 1999; Hegarty, 2005). Table 4 shows the consequences of reduced methane energy losses on animal performance and environmental pollution. The NE content of methane amounts to 55 kJ per g or 0.879 MJ per mol. A total of ~10 g of methane per kilogram of DM has been calculated to be adequate to ~0.5 MJ of NEl. Greater milk yields (Flachowsky and Brade, 2007; Tamminga et al., 2007) or a greater content of important nutrients in milk, such as protein, reduce methane emission per kilogram of milk protein (Beever et al., 2001; Brade et al., 2008).
The calculations revealed significant methane reduction relative to the increases in energy intake and milk yield. The beneficial effects are less compared with greater feed intake (Table 3) or an improved digestibility, but the consequences of reduced methane emission on greenhouse gases and carbon footprints are remarkably high (Table 4).
Reduced Maintenance Requirements
Adult livestock animals need sufficient external supply with energy and nutrients to maintain their basic living processes. These maintenance requirements depend on animal species and production category, body composition, and other factors. The requirements are usually given per kilogram of metabolic BW (kg of BW0.75; e.g., 0.293 MJ of NEl/kg of BW0.75 for dairy cows; GfE, 2001). Similar values were deduced by other energy evaluation systems (e.g., 0.272 or 0.335 MJ of NEl/kg of BW0.75 for beef or dairy cattle by NRC, 2001). Reduced maintenance requirements (Table 5) or a better ratio between yield and maintenance (Table 3) save energy/nutrients and may contribute to a more efficient conversion of feed into animal-derived food.
Changing the Body Composition of Animals or Animal Products
Body composition and concomitantly the composition of animal-derived products can be modified to meet human demands, save feed energy, and improve feed efficiency and can thus contribute to animal health and welfare. The following strategies are known:
reduce fat content in the products (e.g., meat, milk, eggs),
increase protein content in the products (e.g., milk), and
reduce lactose in the milk to relieve metabolism (liver) by decreased gluconeogenesis.
Fat contains more energy (~39 kJ/g) than carbohydrates (~17 kJ/g) and proteins (~24 kJ/g). A decreased fat content in animal-derived food may contribute to a better acceptance of animal products by some consumer groups and may reduce energy intake of animals. On the other hand, some people do not like animal products that are deprived of fat because fat is the major factor determining the taste of such products (Fernandez et al., 1999). Proteins are characterized by reduced energy content. Animals need considerable energy for protein accretion and secretion (Simon, 1989).
Lactose in milk is necessary for maintaining the physiological osmolality of milk. The lactose content of milk shows only little variation (between 45 and 50 g per liter). However, a significant part of the human population of the world suffers from lactose intolerance due to deficiency of the lactase enzyme (Mann and Truswell, 2007). High-yielding dairy cows need >4 kg of glucose for producing lactose in milk and for metabolic processes (Matthey et al., 2000; Breves and Lebzien, 2009). However, only 1 to 2 kg of glucose is available from the digestive tract because of the microbial starch fermentation in the rumen (Reynolds et al., 1997; Matthey, 2001; Breves and Lebzien, 2009) and the limited starch absorption in the small intestine (Gäbel, 2010). Most of the glucose necessary for synthesis of milk lactose and for other metabolic processes is synthesized in the liver from VFA, mainly propionic acid and other glucoplastic precursors, including AA (Danfaer, 1999). A reduction of lactose content in milk would be favorable for energy metabolism of high-yielding dairy cows and goats and may contribute to animal health and decreased energy requirements per kilogram of milk.
In summary, the above discussion shows that reducing specific nutrients in food of animal origin may contribute to decreased energy requirements of animals and to a more efficient feed conversion. In the future, existing and emerging breeding technologies could be instrumental to produce livestock animals with much greater feed efficiency.
ADVANCES IN ANIMAL BREEDING TECHNOLOGIES
Modern animal breeding strategies, predominantly based on population genetics, AI, and ET technologies, led to significant increases in the performances in domestic animals and are the basis for the regular supply of high-quality animal-derived food at acceptable prices. A recent addition to this arsenal of technologies is the separation of spermatozoa into X- and Y-chromosome-bearing populations by means of flow cytometry, which is currently being transferred into commercial cattle breeding (Seidel, 1999). Moreover, reproductive biotechnologies are currently being complemented by new measures of molecular genetics. The genomes of several domestic animals (e.g., cattle, horse, dog, poultry, bee) have been sequenced and annotated (http://www.ensembl.org). Important uses of genomic data are to improve selective breeding strategies, study expression patterns (transcriptomics or proteomics), and produce transgenic animals tailored for specific production purposes (Niemann and Kues, 2007). The technology for the production of transgenic animals, either by additive gene transfer or by selective deletion (knockout), has been advanced to the level of practical application (Golovan et al., 2001; Dai et al., 2002; Lai et al., 2002, 2006; Richt et al., 2007; reviewed in Niemann and Kues, 2007; Robl et al., 2007; Niemann et al., 2010; Piedrahita and Olby, 2011). A crucial step in this context was the development of SCNT cloning (Wilmut et al., 1997), which has replaced the previously used, rather inefficient method of microinjection for producing transgenic animals.
Transgenic Animal Production via Somatic Cell Nuclear Transfer
Despite recent advances, the production of transgenic farm animals is still labor- and cost-intensive and depends upon advanced techniques in molecular biology, cell culture, reproductive biology, and biochemistry. The transfer of the foreign DNA is only 1 step in this process. Critical steps involved in the production of transgenic farm animals are identification of the gene (genome analysis), cloning of the gene, production of a suitable gene construct, transfer of the gene, proof of integration of the foreign gene, proof of expression (mRNA, protein), demonstration of transmission (inheritance), and selective breeding.
The first successful gene transfer method in animals (mouse) was based on the microinjection of foreign DNA into zygotic pronuclei. This was used to produce the first transgenic sheep and pigs more than 20 yr ago (Hammer et al., 1985). Despite the inherent inefficiency of microinjection technology, a broad spectrum of genetically modified large animals has been produced for application in agriculture and biomedicine. The use of transgenic animals has been advanced to practical application in biomedicine, in particular for the production of pharmaceutical proteins in milk (e.g., gene pharming: GTC Biotherapeutics, Pharming, Biosidus) and xenotransplantation (i.e., the production of porcine organs and tissue in human organ transplantation to cope with the shortage of human organs in terminally ill patients; see Kues and Niemann, 2004; Niemann and Kues, 2007). Agricultural applications are now rapidly emerging. After about 12,000 yr of domestic animal selection based on the random mutations resulting from environmental factors such as radiation and oxidative injury, technology is now available to introduce or remove genes with known functions. Important milestones in the evolution of transgenesis and SCNT are shown in Table 6.
Milestones first (live offspring) in transgenesis and somatic cloning in farm animals1
| Year | Milestone | Strategy | Reference |
|---|---|---|---|
| 1985 | First transgenic sheep and pigs | Microinjection of DNA into 1 pronucleus of a zygote | Hammer et al., 1985 |
| 1986 | Embryonic cloning of sheep | Nuclear transfer using embryonic cells as donor cells | Willadsen, 1986 |
| 1997 | Cloning of sheep with somatic donor cells | Nuclear transfer using adult somatic donor cells | Wilmut et al., 1997 |
| 1997 | Transgenic sheep produced by nuclear transfer | Transfection of fibroblasts and random integration of the construct | Schnieke et al., 1997 |
| 1998 | Transgenic cattle produced from fetal fibroblasts and nuclear transfer | Transfection of fibroblasts and random integration of the construct | Cibelli et al., 1998 |
| 1998 | Generation of transgenic cattle by mouse Moloney leukemia virus injection | Infection of oocytes with helper viruses | Chan et al., 1998 |
| 2000 | Gene targeting in sheep | Gene replacement and nuclear transfer | Mc Creath et al., 2000 |
| 2002 | Trans-chromosomal cattle | Insertion of artificial chromosome | Kuroiwa et al., 2002 |
| 2002 | Gene knockout in pigs | Heterozygous knockout of α galactosyltransferase (Gal KO) gene | Dai et al., 2002; Lai et al., 2002 |
| 2003 | Double gene knockout in pigs | Homozygous knockout of Gal KO gene | Phelps et al., 2003 |
| 2003 | Transgenic pigs via lentiviral injection | Gene transfer into zygotes via lentiviruses | Hofmann et al., 2003 |
| 2006 | Conditional transgene expression in pigs (tet-off) | Pronuclear DNA injection and crossbreeding | Kues et al., 2006 |
| 2007 | Prion knockout in cattle | Somatic cloning with PrP-KO cells | Richt et al., 2007 |
| 2009 | Transgenic pigs via transposon technologies | Cytoplasmatic injection of Sleeping Beauty transposon system | Garrels et al., 2010 |
| 2011 | Biallelic knockout of an endogenous gene by zinc finger nuclease (ZFN) technology | Somatic cloning with ZFN-treated Gal KO somatic cells | Hauschild et al., 2011 |
1From Niemann et al. (2010).
Microinjection has several major shortcomings including low efficiency, random integration, and variable expression patterns which mainly reflect the site of integration. Research has focused on the development of alternate methodologies for improving the efficiency and reducing the cost of generating transgenic livestock, including sperm-mediated DNA transfer, intracytoplasmic injection of sperm heads carrying foreign DNA, injection or infection of oocytes or embryos or both by different types of viral vectors, RNA interference technology, injection of transposon-based constructs, and the use of SCNT (see Niemann et al., 2010; Piedrahita and Olby, 2011). To date, SCNT, which has been successful in 16 species, holds the greatest promise for significant improvements in the production of transgenic livestock. However, the typical success rate (live births) of mammalian SCNT is small and usually is only 2 to 6% of the transferred embryos. However, since the first reports of cloned transgenic offspring (Schnieke et al., 1997; Wilmut et al., 1997), significant improvements have been made that allow commercial application of SCNT for specific targets. In cattle, success rates of 20 to 25% can be achieved (Kues et al., 2008). Porcine cloning efficiency could be significantly improved by better selection and optimized treatment of the recipients, specifically by providing a 24-h asynchrony between the preovulatory oviducts of the recipients and the reconstructed embryos. Presumably, this gives the embryos additional time to achieve the necessary level of nuclear reprogramming. The improved protocol has resulted in pregnancy rates of ~80% and only a slightly reduced mean litter size (Petersen et al., 2008). Efficiency of SCNT is likely to be improved in the near future with significant impact on transgenic animal production. Published reports on transgenic animals for agricultural production are shown in Table 7.
Overview on successful transgenic livestock for agricultural production1
| Transgenic trait | Key molecule | Construct | Gene transfer method | Species | Reference |
|---|---|---|---|---|---|
| Increased growth rate, less body fat | GH | hMT-pGH | Microinjection | Pig | Nottle et al., 1999 |
| Increased growth rate, less body fat | IGF-1 | mMT-hIGF-1 | Microinjection | Pig | Pursel et al., 1999 |
| PUFA in pork | Desaturase (from spinach) | maP2-FAD2 | Microinjection | Pig | Saeki et al., 2004 |
| Increased PUFA in pork | Desaturase (from Caenorhabditis elegans) | CAGGS-hfat-1 | Somatic cloning | Pig | Lai et al., 2006 |
| Phosphate metabolism | Phytase | PSP-APPA | Microinjection | Pig | Golovan et al., 2001 |
| Milk composition (lactose increase) | α-Lactalbumin | Genomic bovine α-lactalbumin | Microinjection | Pig | Wheeler et al., 2001 |
| Influenza resistance | Mx protein | mMx1-Mx | Microinjection | Pig | Müller et al., 1992 |
| Enhanced disease resistance | IgA | α,K-α,K | Microinjection | Pig, sheep | Lo et al., 1991 |
| Wool growth | IGF-1 | Ker-IGF-1 | Microinjection | Sheep | Damak et al., 1996a,b |
| Visna virus resistance | Visna virus envelope | Visna LTR-env | Microinjection | Sheep | Clements et al., 1994 |
| Ovine prion locus | Prion protein | Targeting vector (homologous recombination) | Somatic cloning | Sheep | Denning et al., 2001 |
| Milk fat composition | Stearoyl desaturase | β-Lactogl-SCD | Microinjection | Goat | Reh et al., 2004 |
| Milk composition (increase of whey proteins) | β-Casein κ-casein | Genomic CSN2 CSN-CSN-3 | Somatic cloning | Cattle | Brophy et al., 2003 |
| Milk composition (increase of lactoferrin) | Human lactoferrin | α-s2cas-mLF | Microinjection | Cattle | Platenburg et al., 1994 |
| Staphylococcus aureus mastitis resistance | Lysostaphin | Ovine β-lactogl-lysostaphin | Somatic cloning | Cattle | Wall et al., 2005 |
1From Niemann and Kues (2007).
The most prominent example for transgenic animals demonstrating the power of the new breeding technologies in the context of this paper is the production of “environmentally friendly” pigs (Golovan et al., 2001). Phosphorus pollution by animal production is a serious problem in agriculture, and excess phosphate from manure nourishes eutrophication. Phytase transgenic pigs have been developed to address the problem of manure-based environmental pollution and to save P. These pigs carry a bacterial (Escherichia coli) phytase gene under the transcriptional control of a salivary gland-specific promoter, which allows the pigs to digest plant phytate. Without the bacterial enzyme, the phytate P passes undigested into manure and pollutes the environment. With the bacterial enzyme, the fecal P output was reduced up to 75% (Golovan et al., 2001).
Further qualitative improvements of transgenic technology will be derived from technologies that allow precise modifications of the genome including targeted chromosomal integration by site-specific DNA recombinases, such as Cre or Flippase recombination enzyme, or methods that allow temporally or spatially or both controlled transgene expression (Capecchi, 1989; Kilby et al., 1993). Transposon-mediated transgenesis and the use of DNA-specific enzymes such as zinc-finger nucleases are rapidly emerging technologies that are promising for qualitative improvement of livestock transgenesis (see Niemann et al., 2010).
Transposon-Mediated Transgenesis
Class II or DNA-based transposons are mobile genetic elements that move in the host genome via a “cut-and-paste” mechanism. Most DNA transposons are simply organized; they encode a transposase protein flanked by inverted terminal repeats (ITR), which carry transposase binding sites. It has been possible to separate the transposase coding sequence from the ITR sequences. Any DNA flanked by the ITR will be recognized by the transposase and will become enzymatically integrated into nuclear DNA (Ivics et al., 2007). The size of the integrated foreign DNA can exceed 10 kb. In a 2-component system, the transposon is integrated solely by the trans-supplementation activity of the transposase.
Transposons have been successfully used in invertebrates, including Caenorhabditis elegans and Drosophila, for transgenesis and insertional mutagenesis. The first transposon sufficiently active for use in vertebrates was the Sleeping Beauty (SB) transposon, which was developed in 1997. Since then, several other transposons have been found to function in greater eukaryotes (e.g., Piggyback, Frog Prince, Tol2, and Passport). Many drawbacks of classical methods for transgenesis can be overcome by transposition-mediated gene delivery, which increases the efficiency of chromosomal integration and facilitates single-copy insertion events. The main advantage of transposon-mediated transgenesis is that the integration of foreign DNA is directed to accessible euchromatic regions so that the transgene silencing, which occurs after random integration into heterochromatic regions, is prevented. Injection of in vitro synthesized mRNA coding for transposase can enhance the efficiency of this technique due to the rapid availability of the transposase and circumvents the risk of integrated transposase sequences. This method (Garrels et al., 2011) has been employed for producing transgenic zebrafish, medaka fish, and Xenopus (transposons Tol2 and SB), transgenic chickens (transposon Tol2), and transgenic mice and rats (transposons SB and piggyBac). The usefulness of transposon-mediated transgenesis for farm animal species has only recently been shown (Garrels et al., 2011).
Use of DNA-Specific Enzymes
Rather than relying on rare spontaneous events, the frequency of homologous recombination between the targeting vector and the target locus can be considerably increased by introducing a double-strand DNA break at the target site. Recombinant, highly specific endonuclease enzymes have now been created by fusing endonuclease domains, such as those of Fok1, with zinc-finger DNA binding domains (Cathomen and Joung, 2008). The modular design of zinc-finger binding domains allows the production of specific binding proteins for almost every sequence. These “molecular scissors” make it possible to introduce a double-strand break at a single predetermined site in the genome. In practice, this increases the frequency of homologous recombination by several orders of magnitude. Furthermore, because double-strand-break repair pathways in eukaryotes often create small deletions at the break site, zinc-finger nucleases alone, without homologous targeting by vector sequences can achieve gene knockout efficiency of >5%. Of course, it is then necessary to develop an appropriate screening/selection system to replace the selectable marker genes normally used for targeted homologous recombination. Targeted gene inactivation has been achieved simply by the introduction of RNA coding for the appropriate zinc-finger nucleases (ZFN) in both zebrafish and rats. The efficiencies of recombinant ZFN outrange those of meganucleases that originate from combinatorial association of DNA-binding domains of I-CreI homing endonucleases. Meganucleases have been used successfully in cell culture. We have recently demonstrated the usefulness of using ZFN for knocking out both alleles of an endogenous porcine gene (Hauschild et al., 2011).
Pluripotent Cells
Pluripotent embryonic stem (ES) cells have the ability to participate in organ and even germ cell development after injection into blastocysts or aggregation with morulae. True ES cells (i.e., those able to contribute to the germ line) have been established from inbred mouse strains, and recently the first rat ES cells were reported. Murine ES cells have become an important tool for gene knockout and knockin experiments and to study large chromosomal rearrangements. Embryonic stem-like cells and primordial germ cell cultures have been reported for several farm animal species, and ES-like cells that can produce chimeric animals, albeit without germ line contribution, have been reported in swine and cattle. Because they divide rapidly in culture while maintaining a stable genome, pluripotent cells will be a valuable tool for the production of animals with targeted genetic modifications (Nowak-Imialek et al., 2011).
A revolutionary breakthrough in direct nuclear reprogramming of mouse somatic cells (fibroblasts) was recently reported (Takahashi and Yamanaka, 2006). Somatic murine cells transfected with constructs expressing Oct4, Sox2, Myc, and Klf4, carried in retroviral vectors, were reprogrammed to a pluripotent state and were indistinguishable from ES cells with regard to differentiation potential and morphology. These induced pluripotent stem cells (iPS) were able to contribute to chimera formation and gave germ line transmission, clearly indicating complete reprogramming. The same genes were then found to be effective for reprogramming human somatic cells, suggesting a new approach to the generation of pluripotent cells from large animal species. It is now clear that viral expression of human cDNA encoding for OCT4 (octamer binding transcription factor 4), SOX2 [SRY (sex determining region Y)-box 2], MYC, (gene encoding the protein c-Myx), and KLF4 (Krueppel-like factor 4), and can reprogram porcine fibroblasts to iPS-like cells (Ezashi et al., 2009).
Advances in Genome Sequencing
In the next few years, it is probable that a considerably wider range of genetic modifications will become feasible in many domestic animal species. Genetic modification requires detailed information on gene sequence, function, allelic variants, and gene-gene interactions, which has recently become available for the genomes of livestock species and is progressively being refined. Comparative analysis of sequence data from the different species and breeds will be instrumental in identifying the genetic basis of many desirable traits, including disease resistance, adaptation to environmental conditions, reproductive performance, and product quality. Low cost sequencing (<$1,000 per genome) will mean that once transgenic animals have been produced, their genomes, epigenomes, and organ-specific transcriptomes and proteomes can be fully analyzed on a routine scale. This is critical for safety assessment of transgenic animals.
GENETIC REGULATION OF FEED INTAKE
To embark on future breeding programs to producing animals with improved feed conversion, one has to consider the complex neuroendocrine and endocrine regulatory mechanisms of feed intake (Roche et al., 2008a; Sartin et al., 2011). This is a prerequisite for identification of potential candidate (master) genes that could be targeted with the above molecular genetic tools. Ingestive behavior is controlled by a complex interplay between exogenous and endogenous signals. Feed-related exogenous signals are detected by all senses, primarily by taste and smell. These exogenous amenities promote or suppress appetite, the desire for a special kind of feedstuff, or a defined feed quality. Endogenous signals mostly stem from the gastrointestinal system when ingested feed is detected by mechano- and chemosensors (Forbes and Barrio, 1992) or when absorbed nutrients are sensed in pancreas and liver. Either afferent neurons of the vagus nerve (parasympathetic) or those in the dorsal root ganglion (sympathetic) convey these signals to the caudal brain stem, particularly to the area postrema and the nucleus of the solitary tract (NTS), where they are integrated with descending hypothalamic input to produce ascending output regarding feed intake to the hypothalamus (Figure 1).
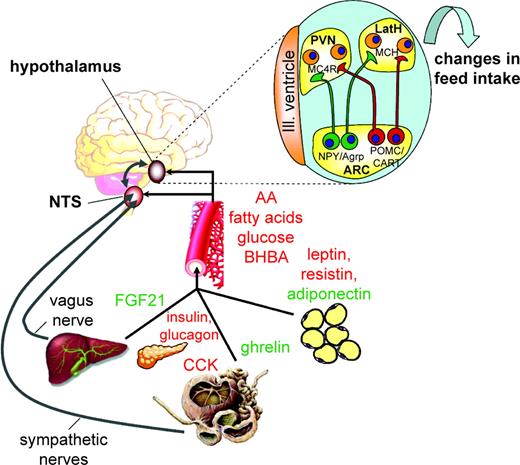
Neural and humoral pathways by which cytokines, hormones, and metabolites interact to regulate feed intake. The brain receives signals from peripheral organs via the bloodstream (black arrows), including gut hormones such as ghrelin, pancreatic hormones such as insulin, from adipose tissue such as leptin, from the liver such as fibroblast growth factor 21 (FGF21), but also absorbed nutrients including glucose and amino and fatty acids. Molecules in red exert anorexigenic signaling, and molecules in green exert orexigenic signaling. Peripheral organs may also signal via autonomous nerves (gray arrows) to the hind brain that process satiety signals. Afferent nerves transmit signals from the gastrointestinal tract (e.g., cholecystokinin (CCK) and by mechanoreceptors measuring distension) and the liver through the vagus nerve and sympathetic fibers to the nucleus of the solitary tract (NTS), where they make connections with hypothalamic centers. The neuropeptide Y (NPY)/agouti-related peptide (Agrp) and pro-opiomelanocortin (POMC)/cocaine- and amphetamine-regulated transcript (CART) neurons are located in the arcuate area (ARC) model first-order neurons (upper right). These neurons project to the paraventricular (PVN) and to the lateral hypothalamus (LatH), where second-order neurons are located. Second-order neurons include neurons expressing orexigenic peptides such as melanin-concentrating hormone (MCH) and orexin A and B, which increase feed intake, but also neurons expressing peptides with anorexigenic traits. MC4R = melanocortin-4-receptor; BHBA = β-hydroxybutyrate. Partially adapted from Schwartz et al. (2000).
Hypothalamic nuclei located in the paraventricular (PVN), the ventromedial (VMH), the lateral hypothalamus (LatH), and the arcuate area (ARC) have the ability to sense circulating signals in the blood or the cerebrospinal fluid such as nutrients and their metabolites, hormones, and cytokines. Hypothalamic neurons detect signals from stored body reserves; for example, when leptin signals the amount of fat in adipose tissue (Chilliard et al., 2005). Thus, the brain receives the information on the nutritional and metabolic status from the periphery. Peripheral signals are integrated to modulate expression of neuropeptides in first-order neurons located in the ARC of the hypothalamus, such as anorexigenic pro-opiomelanocortin (POMC) and cocaine- and amphetamine-regulated transcript (CART) and orexigenic neuropeptide Y (NPY) and agouti-related peptide (Agrp; Schwartz et al., 2000). The POMC is further enzymatically cleaved, yielding several distinct peptide hormones such as the anorexic α-melanocyte stimulating hormone (α-MSH). Released α-MSH competes with Agrp for binding to the melanocortin-4 receptor (MC4-R) on second-order neurons in the PVN. Whereas α-MSH activates MC4-R and inhibits food intake, AgRP acts as an inhibitor, leading to hyperphagia. Other second-order neurons receiving input signals from NPY and POMC neurons express orexigenic melanin-concentrating hormone (MCH) and orexin, which are located in lateral and perifornical hypothalamic areas (Figure 1).
Nutrient Signals in the Control of Feed Intake of Ruminants
The effect of nutrients on feed intake in ruminants has been intensively reviewed (Faverdin, 1999; Allen, 2000; Ingvartsen and Andersen, 2000) and will only shortly be considered herein. Ruminal fermentation converts ingested macronutrients and thus alters the type of absorbed VFA. Ingested carbohydrates (starch, hemicelluloses, and cellulose) are mostly converted in the rumen to VFA, and only a minor portion of starch is digested in the intestine and absorbed as glucose. Infusion of glucose into the duodenum of dairy cows had no effect on feed intake (Rigout et al., 2002), supporting the assumption that glucose does not have a major impact on feed intake-related signaling in dairy cows. By contrast, intraruminal infusion of acetate, propionate, butyrate (Simkins et al., 1965), or intravenous infusion of β-hydroxybutyrate (BHBA; Rossi et al., 2000) caused a significant reduction in feed intake, highlighting VFA as satiety signal.
Feeding a high protein diet to early and mid-lactating cows increases DMI (Law et al., 2009). However, postrumen infusion of protein (Choung and Chamberlain, 1995), branched AA, histidine (Korhonen et al., 2002) or arginine (Vicini et al., 1988), or intravenous infusions of arginine (Vicini et al., 1988) did not affect feed intake of lactating cows. These findings demonstrate that digestion of N in the rumen improves microbial activity, acid-base-homeostasis, and digestibility but that circulating AA do not play a major role in feed intake-related signaling in dairy cows. Furthermore, feeding fatty acid supplements, the infusion of lipids via the abomasum (Drackley et al., 1992; Chelikani et al., 2004), as well as intravenous lipid infusion (Bareille and Faverdin, 1996) led to increased plasma NEFA concentrations and reduced feed intake of dairy cows. Mobilized NEFA from fat depots are thought to contribute to hypophagia (Ingvartsen and Andersen, 2000; Allen et al., 2009). However, fasted or restrictively fed cows entering the lipolytic state (Oikawa and Oetzel, 2006) are not satiated.
Plasma NEFA of dairy cows are primarily composed of long-chain fatty acids (C16 and C18) that are not expected to pass from blood into the brain in significant amounts (Spector, 1988). Moreover, because VFA (with the exception of BHBA) are almost exclusively absorbed in the liver, it is likely that neither NEFA nor VFA act directly on brain satiety centers. Several other mechanisms also contribute to hypophagic responses. For example, oxidation of longer chain fatty acids and propionate in the liver (Allen et al., 2009) or in enterocytes of the duodenum (Langhans, 2008) is signaled to the brain via afferent fibers of the vagus nerve. Also, absorbed fatty acids may induce the release of gastrointestinal and pancreatic peptides such as cholecystokinin (CCK; Choi et al., 2000; Chelikani et al., 2004), glucagon-like peptide-1 (Bradford et al., 2008), or glucagon (Hammon et al., 2008), all known to be satiety hormones but that also diminish the release of the orexigenic peptide ghrelin from the abomasum (Bradford et al., 2008).
The brief summary of the complex regulatory mechanisms critically involved in feed intake indicates the enormous challenges that have to be overcome to produce animals with significantly improved characteristics in feed conversion via genetic modification. The following is an attempt to identify potential target molecules for future studies. We briefly discuss genes critically involved in feed intake and metabolism as shown from basic studies in rodent models (mouse and rat).
Knockin and Knockout of Neuropeptides for Increasing Feed Intake
NPY.
Lateral cerebroventricular, but not intravenous, injection of NPY stimulated feeding in sheep (Miner et al., 1989). Rats injected with adenovirus-mediated NPY overexpression in the PVN showed temporarily increased feed intake, which resulted from an increase in the amount of food consumed within 24 h. In contrast, injection into the LatH provoked long-lasting hyperphagia and BW gain attributed to increased meal size (Tiesjema et al., 2007). Overexpression of NPY in the central nervous system of mice led to transiently increased feed intake with increased BW gain when fed on a sucrose diet (Kaga et al., 2001).
Agrp.
Ectopic expression of the agouti protein in multiple tissues characterizes a hyperphagic, obese mouse strain (Moussa and Claycombe, 1999). Transgenic overexpression of Agrp significantly increased serum Agrp concentration, hypothalamic NPY mRNA abundance, and feed intake as compared with control animals (Xiang et al., 2004). This transgenic strategy has been suggested to be promising for promoting growth and feed intake in farm livestock animals (Xiang et al., 2004). Selective ablation of neuronal Agrp in adult mice resulted in reduced feed intake (Gropp et al., 2005), supporting the idea of an orexigenic role of Agrp. However, mice deficient in Agrp or NPY or both (Agrp−/− and NPY−/−) showed normal feeding behavior, BW gain, and energy expenditure when compared with wild type controls, suggesting that other pathways capable of regulating energy homeostasis compensate for the loss of both Agrp and NPY (Qian et al., 2002).
CART.
Intracerebroventricular (ICV) administration of CART peptides reduced feed intake in rats (Kristensen et al., 1998), whereas direct administration into the VMN or ARC nucleus increased feed intake (Abbott et al., 2001). Recombinant adeno-virus-mediated overexpression of CART in the PVN increased feed intake in rats (Smith et al., 2008) suggesting an orexigenic role in the regulation of energy homeostasis. On the other hand, CART knockout mice displayed increased BW but without increasing feed intake (Wierup et al., 2005).
POMC.
Ligands for the melanocortin receptors are derived from the prohormone POMC. Posttranslational processing results in a panel of melanocortin peptides: β-endorphin, α-MSH, γ3-MSH, γ2-MSH, γ-lipotropin, and β-MSH in humans but not in rodents. These anorexigenic effects could be observed when the substances were centrally administered. Mice lacking all POMC-derived peptides were obese and hyperphagic (Challis et al., 2004). Male mice lacking β-endorphin, but with normal melanocortin signaling, were also hyperphagic and obese (Appleyard et al., 2003), suggesting a complementary rather than opposing action of β-endorphin and melanocortins on appetite.
MCH.
Melanin-concentrating hormone is a cyclic 19-aa hypothalamic neuropeptide derived from a larger prohormone precursor of MCH (Pmch), which is predominantly expressed in the LatH. Transgenic mice overexpressing Pmch were hyperphagic and developed mild obesity (Ludwig et al., 2001), whereas Pmch−/− mice were lean and hypophagic (Shimada et al., 1998). Likewise, central administration of MCH increased feed intake and BW gain (Marsh et al., 2002), suggesting an orexigenic role for the Pmch gene. Whether one of its cleavage products, either MCH, neuropeptide EI, or neuropeptide GE accounts for these effects remains to be determined.
GH.
It is well known that subcutaneous administration of bovine (b) ST increases milk production in the short term without increasing feed intake, whereas in long-term studies, feed intake increased as a consequence to compensate for greater energy demand (Baldwin and Knapp, 1993). Transgenic mice overexpressing bGH showed hyperphagia and increased abundance of Agrp and NPY mRNA, whereas transcripts for POMC, MCH, and melanocortin-4-receptor (MC4R) were not different from control mice (Bohlooly-Y et al., 2005). However, energy intake per gram of BW did not differ between bGH transgenic mice and controls fed on a normal diet, but bGH transgenic mice had greater feed efficiency (Olsson et al., 2005). On a high-fat diet, however, bGH transgenic mice had an increased energy intake without changing their feed intake (Olsson et al., 2005). The production of GH transgenic pigs and sheep has been reported. Transgenic pigs bearing an hMT-pGH construct (human metallothionein promoter driving the porcine GH gene) showed significant improvement in economically important traits including growth rate, feed conversion, and body composition (muscle/fat ratio) without the pathological phenotype seen with earlier GH constructs. Transgenic pigs carrying the human IGF-I gene had ~30% larger loin mass, ~10% more carcass lean tissue, and ~20% less total carcass fat (Nottle et al., 1999; Pursel et al., 1999).
Knockin and Knockout of Receptors for Increasing Feed Intake
Leptin Receptor.
The leptin receptor (LepR or ObR) is expressed in many peripheral tissues and the CNS. Selective ablation in the mouse hypothalamus using the Cre-loxP system increased the transcription levels of Agrp and NPY (Figure 2). Pro-opiomelanocortin and CART were not affected when compared with heterozygous littermates (Cohen et al., 2001). Animals with the least LepR exhibited an obese phenotype (Cohen et al., 2001). Another study demonstrated that knockdown of LepR in neurons of the medial nucleus tractus solitarius and the area postrema of rats (LepRKD rats) resulted in increased basal adenosine monophosphate (AMP) kinase (AMPK) activity (see below) and significant hyperphagia (Hayes et al., 2010). It was speculated that this was due to a reduction in leptin-mediated gastrointestinal satiation signaling because LepRKD rats showed decreased sensitivity to CCK.
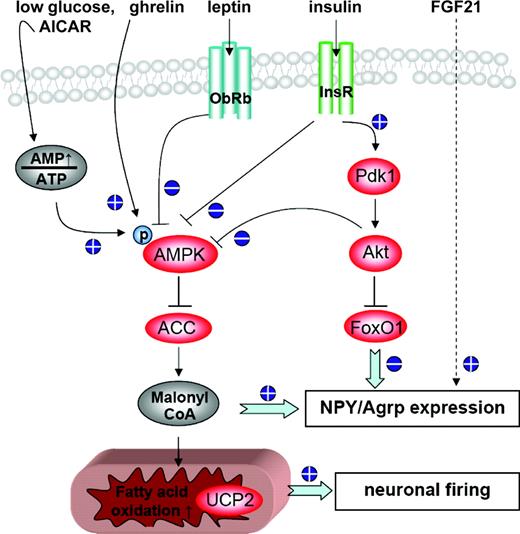
Overview of signaling pathways in agouti-related peptide (Agrp)/neuropeptide Y (NPY) neurons regulating feed intake. Hypothalamic adenosine monophosphate (AMP)-activated kinase (AMPK) activity acts via the acetyl CoA carboxylase (ACC) to malonyl CoA pathway to increase Agrp/NPY expression and fatty acid oxidation. Ghrelin stimulates AMPK-mediated fatty acid oxidation, increases uncoupling protein 2 (UCP2) activity, and reduces reactive oxygen species, leading to NPY/Agrp neuron firing. Insulin and leptin activate the 3-phosphoinositide-dependent protein kinase 1 (Pdk1) to Akt pathway, which inactivates the transcription factor forkhead box-containing protein O1 (FoxO1). The FoxO1 stimulates transcription of NPY and Agrp; insulin and leptin suppress expression of these orexigenes. AICAR = AMP precursor 5′-aminoimidazole-4-carboxamide ribonucleoside. ObRb = obese receptor; InsR = insulin receptor; p = phosphate; Akt = protein kinase B; FGF21 = fibroblast growth factor 21.
CCK1 Receptor.
Cholecystokinin is secreted from the duodenum and jejunum and acts via 2 types of receptors, the peripheral (CCK-A or CCK-1 receptor) and the brain type receptor (CCK-B or CCK-2 receptor; Liddle, 1997). In the periphery, CCK excites vagal sensory neurons which release glutamate that acts on N-methyl-D-aspartate (NMDA) and α-amino-3-hydroxy-5-methyl-4-isoxazolepropionic acid (AMPA)/kainate receptors expressed by most postsynaptic neurons of the NTS (Berthoud et al., 2001). Activation of the extracellular regulated kinase 1/2 cAMP response element-binding protein cascade is required to modulating transcription of the immediate-early gene c-Fos which is critically involved in satiation and meal termination (Berthoud et al., 2006). In Otsuka Long-Evans Tokushima Fatty (OLETF) rats, which have a nonfunctional CCK1 receptor, CCK-8 did not increase Fos activity in neurons of the brain stem and myenteric neurons (Gulley et al., 2005). Consistent with the lack of the CCK1 receptor, OLETF rats did not reduce their feed intake in response to exogenously administered CCK and consumed larger than normal meals (Moran and Bi, 2006). Under conditions of pair-feeding to amounts consumed by control rats, dorsomedial hypothalamic NPY mRNA expression was significantly increased in OLETF rats (Moran and Bi, 2006). These observations suggest that the CCK1 receptor could be a critical molecule in a strategy to improve feed efficiency in livestock.
MC4R.
Cholecystokinin-induced satiety effects depend upon neuronal MC4R signaling (Fan et al., 2004). Administration of the MC3R and MC4R antagonist SHU9119 to the 4th brain ventricle completely restored CCK induced inhibition of feed intake (Fan et al., 2004). In Mc4r−/− mice, CCK did not suppress feed intake demonstrating that the melanocortin system is a major factor in satiety signaling (Fan et al., 2004). Disruption of the MC4 receptor in mice or infusion of the antagonist SHU9119 resulted in an obese phenotype, which was due to hyperphagia and reduced energy expenditure (Adan et al., 2006). These findings make MC4R a potential target for stimulating appetite in sheep (Sartin et al., 2005).
Y Receptors.
Surprisingly, mice with a knockout of NPY (Erickson et al., 1996) or 1 of the receptor subtypes such as Y1 (Kushi et al., 1998), Y2 (Naveilhan et al., 1999), or Y5 (Higuchi et al., 2008) showed either unchanged or increased feed intake, likely because of feedback mechanisms that regulate release of NPY. Conditional Y2 knockout mice had increased feed intake, whereas in Y2−/− mice feed intake was significantly decreased compared with wild type controls (Sainsbury et al., 2002).
Melanin-Concentrating Hormone 1 Receptor and GH Receptor.
The MCH 1 receptor (MCH1R) is 1 of 2 recently identified G protein-coupled receptors thought to be responsible for the biological function of MCH. Paradoxically, Mch1r−/− mice were hyperphagic when maintained on a regular diet, had normal BW, and had reduced fat mass. This was caused by general hyperactivity associated with an altered metabolism and a reduced susceptibility to diet-induced obesity (Marsh et al., 2002). Growth hormone receptor−/− mice showed increased feed intake associated with increased total and intraabdominal fat, greater plasma leptin concentrations, but a marked decrease in lipoprotein fractions (Egecioglu et al., 2006).
Apolipoprotein A-IV.
Apolipoprotein A-IV is a satiation protein synthesized in the small intestine and in the arcuate and ventromedial nuclei of the hypothalamus and the brain stem (Shen et al., 2008). Although Apo-IV does not cross the blood-brain barrier, downregulation of hypothalamic Apo A-IV has been proposed to contribute to hyperphagia in rats fed a high-fat diet (Woods et al., 2004).
Targets for Increased Feed Intake: Cytokines Derived from Gut and Liver
Ghrelin.
The role of ghrelin (GH release inducing) in the regulation of feed intake of ruminants has been reviewed (Roche et al., 2008a). Bovine ghrelin, a 29-AA peptide, is primarily produced by the abomasum. Acylation of ghrelin by the ghrelin O-acyltransferase links octanoate to the active form serine-3 of ghrelin, which binds to the GH secretagogue receptor and then crosses the blood-brain barrier (Murphy and Bloom, 2006). Ghrelin O-acyltransferase has been proposed as a target for novel therapeutics that could combat anorexia-cachexia, including anorexia nervosa and obesity (Chen et al., 2009).
Mice transgenic for ghrelin exhibited increased concentration of circulating active ghrelin that was associated with hyperphagia and increased energy expenditure (Bewick et al., 2009). Central and peripheral infusion of ghrelin in the rat model stimulated NPY and AgRP neurons in the hypothalamus and in turn increased feed intake (Shintani et al., 2001; Egecioglu et al., 2006). However, peripheral infusion of ghrelin had no effect on feed intake in early lactating dairy cows. Increased NEFA concentrations in plasma and reduction of BCS were explained by enhanced lipolysis (Roche et al. 2008b). However, adaptation to negative energy balance in early lactating dairy cows is associated with enhanced basal ghrelin secretion, which in turn increased energy intake, increased NEFA concentrations, and led to a greater GH response to ghrelin as compared with late-lactating dairy cows (Bradford and Allen, 2008). In beef cattle that are in a positive energy balance, subcutaneous ghrelin application increased plasma GH concentrations and DMI, whereas NEFA concentrations were not affected (Wertz-Lutz et al., 2006), suggesting that the actions of ghrelin on feed intake depend on the metabolic state of the animal.
Fibroblast Growth Factor 21.
Fibroblast growth factor 21 (FGF21) is a cytokine primarily secreted by the liver that has an important role in lipid and carbohydrate metabolism. Subcutaneous injection of FGF21 led to increased feed intake per gram of BW and increased hypothalamic expression of Agrp and NPY (Coskun et al., 2008; Figure 2). The FGF21 knockout mice showed increased POMC and reduced Agrp expression in the hypothalamus (Badman et al., 2009), suggesting that FGF21 has orexigenic characteristics. This assumption is supported by the fact that intracerebroventricular infusion of FGF21 into the lateral brain ventricle increased both feed intake and energy expenditure in rats (Sarruf et al., 2010). In early lactating dairy cows that usually have increased feed intake, hepatic FGF21 expression is markedly increased (Carriquiry et al., 2009).
Integrating Signaling Pathways for Increasing Feed Intake
PDK1/FoxO1.
Insulin and leptin signaling converge on the phosphatidylinositol 3-OH kinase (PI3K)/3-phosphoinositide-dependent protein kinase 1 (PDK1)/protein kinase B (PKB or Akt) pathway and inactivate the transcription factor forkhead box-containing protein O1 (FoxO1) in POMC neurons. Forkhead box-containing protein O1 stimulates transcription of NPY and Agrp (Figure 2), but inhibits transducer-activated transcript-3 (STAT3) activity and thus suppresses transcription of POMC (Kim et al., 2006). Forkhead box-containing protein O1 is a common factor in several pathways integrating feed intake. Along this line, POMC neuron-specific Pdk1 knockout mice showed increased feed intake (Iskandar et al., 2010), whereas Pomc-Foxo−/− mice revealed decreased feed intake (Plum et al., 2009).
Adenosine Monophosphate-Activated Kinase.
Adenosine monophosphate-activated kinase (AMPK) acts as cellular fuel gauge that is activated in response to an increased AMP/ATP ratio (Figure 2). The AMPK reacts upon several nutrient and hormonal signals that regulate the metabolism of peripheral organs and feed intake via the hypothalamus. In diabetic rats, adenoviruses mediated dominant-negative AMPK expression in the hypothalamus decreased feed intake, whereas increased AMPK activity was associated with hyperphagia (Namkoong et al., 2005). However, ICV injection of the AMP precursor 5′-aminoimidazole-4-carboxamide ribonucleoside (AICAR) or adenovirus-mediated gene transfer of a constitutively active form of AMPK into the rat mediobasal hypothalamus did not induce hyperphagy in normal rats (Kim et al., 2004). In the hypothalamus of early lactating dairy cows, the enzyme AICAR formyltransferase/IMP cyclohydrolase was upregulated after feed restriction (Kuhla et al., 2007), supporting the physiological significance of activated AMPK for increasing feed intake.
Malonlyl-CoA.
Malonyl-coenzyme A is a sensor for nutrient availability. The downstream target of AMPK, acetyl-CoA-carboxylase (ACC; Figure 2) converts acetyl-CoA to malonyl-CoA. The reverse reaction is catalyzed by malonyl-CoA decarboxylase (MCD), thus ACC and MCD determine cellular malonyl-CoA level. Adeno-associated virus mediated overexpression of MCD in the mediobasal hypothalamus induced a rapid increase in feed intake (He et al., 2006), whereas inhibition of ACC blocked leptin-mediated decrease in feed intake (Gao et al., 2007).
Uncoupling Proteins.
Uncoupling proteins (UCP) are carrier proteins of the inner membrane of the mitochondria that release protons in respiring mitochondria and thereby dissipate energy such as heat. Expression of these enzymes is nutritionally and hormonally regulated and plays a role in regulation of energy balance. Uncoupling protein 1 and UCP3 are downregulated during lactation indicative for the decrease in metabolic fuel oxidation that occurs to save energy for milk production (Xiao et al., 2004). Transgenic mice overexpressing UCP2 and UCP3 displayed decreased adiposity but increased hypothalamic NPY concentrations and feed intake (Horvath et al., 2003). In the brain, UCP2 mediates the appetite-promoting effects of ghrelin, leading to NPY/AGRP neuron firing (Figure 2) and inhibition of neurons that otherwise would produce the satiety hormone POMC (Andrews et al., 2008). The molecules discussed briefly above are summarized in Table 8 in their potential to change feed intake in farm animals, indicating potential options to apply transgenic strategy in livestock species.
Overview on transgenic rodent models showing aberrant feed intake
| Target molecule1 | Expression | Species2 | Transgenic expression in2 | Effect on feed intake3 | Primary candidatesfor applicationin farm animals |
|---|---|---|---|---|---|
| NPY | Knockin | Rat, mouse | PVN, LH | ↑ | x |
| NPY | Knockout | Mouse | Ubiquitous | = | |
| Agrp | Knockin | Mouse | Skeletal muscle | ↑ | x |
| Agrp | Knockout | Mouse | ARC | ↓ | |
| CART | Knockin | Rat | PVN | ↑ | |
| CART | Knockout | Rat | Ubiquitous | = | |
| POMC | Knockout | Mouse | Ubiquitous | ↑ | |
| MCH | Knockout | Mouse | Ubiquitous | ↓ | |
| GH | Knockin | Mouse | CNS | ↑ | x |
| ObRb | Knockout | Mouse | NTS | ↑ | |
| CCK1R | Knockout | OLETF rats | Ubiquitous | ↑ | |
| MC4R | Knockout | Mouse | Ubiquitous | ↑ | |
| Y2 | Knockout | Mouse | Ubiquitous | ↓ | |
| MCH1R | Knockout | Mouse | Ubiquitous | ↑ | |
| GHR | Knockout | Mouse | Ubiquitous | ↑ | |
| Ghrelin | Knockin | Mouse | Ubiquitous | ↑ | x |
| PDK1 | Knockout | Mouse | POMC neurons | ↑ | |
| FoxO1 | Knockout | Mouse | POMC neurons | ↓ | |
| AMPK | Dominant-negative | Rat | Hypothalamus | ↓ | |
| AMPK | Dominant-active | Rat | Hypothalamus | = | |
| MCD | Knockin | Rat | Hypothalamus | ↑ | x |
| UCP2 | Knockin | Mouse | Ubiquitous | ↑ | x |
| UCP3 | Knockin | Mouse | Ubiquitous | ↑ | x |
1NPY = neuropeptide Y; Agrp = agouti-related peptide; CART = cocaine- and amphetamine-regulated transcript; POMC = pro-opiomelanocortin; MCH = melanin-concentrating hormone; ObRb = obese receptor; CCK1R = cholecystokinin 1 receptor; MC4R = melanocortin-4-receptor; Y2 = NPY receptor subtype 2; MCH1R = melanin-concentrating hormone-1-receptor; GHR = growth homone receptor; PDK1 = 3-phosphoinositide-dependent protein kinase 1; FoxO1 = forkhead box-containing protein O1; AMPK= adenosine monophosphate-activated kinase; MCD = malonyl-CoA decarboxylase; UCP2 = uncoupling protein 2; UCP3 = uncoupling protein 3.
2PVN = paraventricular nucleus; ARC = arcuate nucleus; CNS = central nervous system; OLETF = Otsuka Long-Evans Tokushima Fatty; NTS = nucleus of the solitary tract.
3↑ increased feed intake; ↓ decreased feed intake; = no change in feed intake.
Polymorphisms Involved in Feed Intake Regulation: Lessons from Bovine Mutants
In Holstein cows, a specific leptin haplotype and a SNP in the leptin coding region and the GHR gene had a positive effect on feed and DMI (Lagonigro et al., 2003; Banos et al., 2008). Another specific nucleotide polymorphism in the leptin promoter of Holstein-Friesian cows was associated with a greater feed and DMI and concomitantly with a greater energy balance (Liefers et al., 2005).
An A/G-SNP in the GHR gene or in the promoter region of GHR, among 24 SNP evaluated in beef steers, had a significant effect on feed efficiency (Sherman et al., 2008). Several SNP located in the UCP2 gene, the NPY gene, or the ghrelin gene showed significant association with feed efficiency, whereas SNP in CART, POMC, MC4R, and GH did not have a specific phenotype (Sherman et al., 2008). In Angus steers selected for high or low feed intake, polymorphisms in the UCP2 and UCP3 gene were not related with different feed intake levels (Kolath et al., 2006).
Three whole genome association (WGA) studies uncovered 150, 161, and 111 specific nucleotide polymorphisms, respectively, that had significant allele substitution effects on residual feed intake in beef cattle (Barendse et al., 2007; Sherman et al., 2010; Bolormaa et al., 2011). These studies represent an important step toward future application in marker-assisted selection for feed efficiency but also provided hints on potential genomic sites.
PERSPECTIVES
Detailed genomic information and new genetic engineering tools will accelerate and improve transgenic animal production in the future. Genetic technology presents a major opportunity to improve agricultural production but also offers exciting prospects for medical research by exploiting large animals as models of human health and disease. Progress in animal genomics has broadly followed the route pioneered by the human genome project in terms of the assembly, publication, and use of the data. This is evident in the advanced drafts of the bovine, porcine, horse, canine, chicken, and honey bee genomic maps. The ability to engineer the genome is new, and the advent of new molecular tools and breeding technologies is benefiting this field. However, full realization of this exciting potential is handicapped by our currently limited understanding of epigenetic controls and the role of natural siRNA and microRNA in regulating gene expression.
The convergence of recent advances in reproductive technology with the tools of molecular biology opens a new dimension for animal breeding. Major goals are the continued refinement of reproductive biotechnology and a rapid completion of the various genome sequencing and annotation projects. Pluripotent cell lines from farm animal species will permit exploitation of the full power of recombinant DNA technology in animal breeding. This is critical for the development of sustainable and diversified animal production systems for the future. Here, we have discussed a panel of candidate genes that could be targeted with the goal to improve feed intake and thus overall efficiency in future livestock species. We anticipate that agricultural applications of genetically modified animals will play a significant role in shaping the future of a sustainable animal production, but will develop more slowly than the biomedical applications because of the complexity of many economically important traits.
LITERATURE CITED
Author notes
The authors are grateful for the expert assistance of Susanne Tonks (Institute of Farm Animal Genetics, Mariensee, Germany) in preparing this manuscript.
