


ABSTRACT
Dietary components and changes cause shifts in the gastrointestinal microbial ecology that can play a role in animal health and productivity. However, most information about the microbial populations in the gut of livestock species has not been quantitative. In the present study, we utilized a new molecular method, bacterial tag-encoded FLX amplicon pyrosequencing (bTEFAP) that can perform diversity analyses of gastrointestinal bacterial populations. In the present study, cattle (n = 6) were fed a basal feedlot diet and were subsequently randomly assigned to 1 of 3 diets (n = 2 cows per diet). In each diet, 0, 25, or 50% of the concentrate portion of the ration was replaced with dried distillers grain (DDGS). Ruminal and fecal bacterial populations were different when animals were fed DDGS compared with controls; ruminal and fecal Firmicute:Bacteroidetes ratios were smaller (P = 0.07) in the 25 and 50% DDG diets compared with controls. Ruminal pH was decreased (P < 0.05) in ruminal fluid from cattle fed diets containing 50% compared with 0% DDGS. Using bTEFAP, the normal microbiota of cattle were examined using modern molecular methods to understand how diets affect gastrointestinal ecology and the gastrointestinal contribution of the microbiome to animal health and production.
INTRODUCTION
Despite the importance of the gastrointestinal microbial population of ruminants to host health and productivity, knowledge about the gastrointestinal microbial diversity remains relatively rudimentary. Many assumptions about the importance of certain species of bacteria in the gastrointestinal ecosystem of ruminants have been based on correlations between culture-dependent population estimates and various end products such as VFA or CH4 (Hungate, 1966; Drasar and Barrow, 1985). Molecular methods utilizing rapid sequencing technologies, such as pyrosequencing, are now being used to evaluate differences in the microbial diversity of complex ecosystems (Roesch et al., 2007).
The industrial fermentation of corn to produce ethanol has increased more than 4-fold between 2001 and 2007, and its use is expected to double again by 2010 (Richman, 2007). Research has suggested a potential association between DDGS feeding and an increased prevalence and fecal shedding of the foodborne pathogen Escherichiacoli O157:H7 in cattle (Jacob et al., 2008a,b). Thus, with the economic incentive to increase the utilization of DDGS in cattle rations increasing rapidly, it is important to understand what effects DDGS may have on the microbial populations of the gastrointestinal tract of cattle. In the present study, a novel tag bacterial diversity amplification pyrosequencing method (bTEFAP; Dowd et al., 2008a,b) was utilized to evaluate the gastrointestinal microbial diversity in cattle that were fed diets containing 0, 25, and 50% of the concentrate component of their diet as DDGS. We hypothesized that there would be a significant shift in the gastrointestinal population of cattle in response to DDGS feeding that could potentially open a niche for pathogenic bacteria such as E. coli O157:H7 to occupy.
MATERIALS AND METHODS
All procedures in this study were approved by the Southern Plains Agricultural Research Center Animal Care and Use Committee.
Cattle Diets and Experimental Design
Cattle (n = 6) were housed individually in covered pens approximately 50 m2 with pipe fencing. Ruminally fistulated Jersey cows (n = 3) and Angus steers (n = 3) were adapted to a high grain diet (0% DDGS; Table 1) in a stepwise fashion over a 10-d period. Cows were fed once per day at 0800 h to meet NRC recommendations (NRC, 2000) and were allowed ad libitum access to water. Cattle were blocked by breed, and 1 of each breed was randomly assigned to 1 of 3 dietary treatments (n = 2 cows/diet; 0, 25, or 50% DDGS). The concentrate component of the cattle diets was changed beginning on d 0 in a stepwise fashion over a 7-d period to reach desired DDGS concentrations.
Dietary treatments for each group of cattle1
| Item, % | Dietary treatment (% of concentrate replaced by DDGS2) | ||
|---|---|---|---|
| 0 | 25 | 50 | |
| Commercial grain supplement3 | 80 | 60 | 40 |
| DDGS | 0 | 20 | 40 |
| Grass hay | 20 | 20 | 20 |
| Item, % | Dietary treatment (% of concentrate replaced by DDGS2) | ||
|---|---|---|---|
| 0 | 25 | 50 | |
| Commercial grain supplement3 | 80 | 60 | 40 |
| DDGS | 0 | 20 | 40 |
| Grass hay | 20 | 20 | 20 |
1Cattle were fed 2% of their BW daily.
2DDGS, dried distillers grains plus solubles.
3Commercial grain supplement had the following nutritional values: (CP 12%; crude fat minimum 1.5%; crude fiber maximum 26%; Ca minimum 0.5%, maximum 1.0%; P minimum 0.35%; trace mineral salt minimum 0.6%, maximum 0.9%; Na minimum 0.2%, maximum 0.4%; K minimum 0.6%; vitamin A minimum 5,600 IU/kg).
Sample Collection
Fecal and ruminal samples were collected on d 0, 9, and 21 relative to the inclusion of DDGS to obtain a baseline ruminal and fecal population 2 h after feeding. Ruminal contents were also aseptically collected by gloved hand from the ventral sac of all cattle, using a new palpation sleeve for each sample. Immediately after removal from the rumen, the contents from each cow were strained via a fine mesh nylon strainer (Reaves and Co., Durham, NC), and the liquid fraction was placed into a sealed 50-mL conical tube. Fecal samples (30 to 50 g each) were collected aseptically from the rectums of cattle with a new palpation sleeve used for each sample, which was quickly inverted and sealed. Fresh ruminal and fecal fluid contained approximately 1010 to 1011 cells/mL of total culturable anaerobes as determined by most probable number analysis. Ruminal pH was determined immediately upon return to the laboratory on each day of ruminal fluid collection using an Orion 2 Star meter (Thermo Scientific, Waltham, MA).
Bacterial Tag-Encoded FLX Amplicon Pyrosequencing Analysis
Bacterial tag-encoded FLX amplicon pyrosequencing (bTEFAP) was originally described by Dowd et al. (2008a,b). Total genomic DNA was extracted from fecal samples using a QIAamp stool DNA mini kit and its manufacturer's recommended methods (Qiagen, Valencia, CA; Table 2). The DNA samples were quantified using a Nanodrop spectrophotometer (Nyxor Biotech, Paris, France). All methods used in this study were as described previously (Dowd et al., 2008a,b).
Primer sequences utilized for fecal and ruminal samples during bacterial tag-encoded FLX amplicon pyrosequencing
| Name | Primer sequence (5′–3′) |
|---|---|
| 454-F30 | GCCTCCCTCGCGCCATCAGCGCACTACGTGTGCCAGCMGCNGCGG |
| 454-F31 | GCCTCCCTCGCGCCATCAGCGCAGCTGTTGTGCCAGCMGCNGCGG |
| 454-F32 | GCCTCCCTCGCGCCATCAGCGCATACAGTGTGCCAGCMGCNGCGG |
| 454-F33 | GCCTCCCTCGCGCCATCAGCGCATCTATAGTGCCAGCMGCNGCGG |
| 454-F34 | GCCTCCCTCGCGCCATCAGCGCATTGGTGGTGCCAGCMGCNGCGG |
| 454-F35 | GCCTCCCTCGCGCCATCAGCGCCAGAAAAGTGCCAGCMGCNGCGG |
| 454-F36 | GCCTCCCTCGCGCCATCAGTGTGACGTACGTGCCAGCMGCNGCGG |
| 454-F37 | GCCTCCCTCGCGCCATCAGTGTGTGCATAGTGCCAGCMGCNGCGG |
| 454-F38 | GCCTCCCTCGCGCCATCAGTGTGTCCTCAGTGCCAGCMGCNGCGG |
| 454-F39 | GCCTCCCTCGCGCCATCAGTGTGCATCACGTGCCAGCMGCNGCGG |
| 454-F40 | GCCTCCCTCGCGCCATCAGTGTGCCTAGAGTGCCAGCMGCNGCGG |
| 454-F41 | GCCTCCCTCGCGCCATCAGTGTACATAGTGTGCCAGCMGCNGCGG |
| 454-F42 | GCCTCCCTCGCGCCATCAGTGTACATTGAGTGCCAGCMGCNGCGG |
| 454-F43 | GCCTCCCTCGCGCCATCAGTGTACATTGTGTGCCAGCMGCNGCGG |
| 454-F44 | GCCTCCCTCGCGCCATCAGTGTACCAACAGTGCCAGCMGCNGCGG |
| 454-F45 | GCCTCCCTCGCGCCATCAGTGTACCAACTGTGCCAGCMGCNGCGG |
| 454-F46 | GCCTCCCTCGCGCCATCAGTGTACCAATCGTGCCAGCMGCNGCGG |
| 454-F47 | GCCTCCCTCGCGCCATCAGTGTACCAGATGTGCCAGCMGCNGCGG |
| 454-F48 | GCCTCCCTCGCGCCATCAGTGTACCCATAGTGCCAGCMGCNGCGG |
| 454-F49 | GCCTCCCTCGCGCCATCAGTGTACAGGGTGTGCCAGCMGCNGCGG |
| 454-F50 | GCCTCCCTCGCGCCATCAGTGTACCTATCGTGCCAGCMGCNGCGG |
| linkerB-1100R | GCCTTGCCAGCCCGCTCAGGGGTTNCGNTCGTTG |
Statistics
Statistics were performed using JMP 6.0 (SAS Inst. Inc., Cary, NC). Significance levels were predetermined as P < 0.05; trends were determined as 0.05 < P < 0.10.
RESULTS AND DISCUSSION
In spite of more than 60 yr of studies demonstrating the role played by of some ruminal bacteria in feedstuff degradation, the ruminal ecosystem still remains largely a black box especially as it relates to quantitative relationships between bacteria and the host animal. In the past decade, molecular methodologies have been developed that allow the gastrointestinal microbial diversity to be evaluated independent of growth-based culture methods (Dahllöf, 2002). In recent years, molecular data collected from a variety of environmental DNA sources have demonstrated that only 1% of gastrointestinal bacteria are currently known (Nocker et al., 2007). These powerful new technologies such as bTEFAP can elucidate the diversity of the gastrointestinal tract microbiome and can demonstrate how dietary changes affect the population dynamics of the microbial population of the ruminant (Dowd et al., 2008a). Furthermore, opportunities exist to determine how changes in specific microbial populations of the rumen and lower intestinal tract affect animal health, productivity, and food safety.
In the present study, the bTEFAP analysis of fecal samples from cattle fed diets typically fed in feedlots displayed an increased diversity of bacterial species and genera (Table 3). Ruminal and fecal bacterial populations before any dietary change were composed of 259 and 347 species from 74 and 86 genera, respectively. The 25 most common genera accounted for over 85% of the ruminal and fecal bacterial populations (Table 3). These results indicate that there is a large breadth of microbial diversity, but that a few genera predominate population-wise, most notably Prevotella (18.2% of total population) in the rumen and Clostridium (19.7% of total population) in the feces. The gastrointestinal microbial population of cattle are dominated by strict anaerobes, whereas facultative anaerobes have been reported to occur in numbers at least 100-fold less than the strict anaerobes (Drasar and Barrow, 1985); this is supported by these results in which the predominant ruminal and fecal genera were Clostridium, Bacteroides, Succinivibrio, Prevotella, and Ruminococcus (Table 3). Some bacterial species were exclusively found in the ruminal fluid samples, such as Megasphaera, Butyrivibrio, Ruminobacter, Cytophaga, Roseburia, and Selenomonas (Tables 3, 4, and 5). Because several thousand species sequences were obtained per sample (minimum 3, maximum 9,595), bacteria present below 0.1% of the total population were detected, giving a relatively deep and thorough examination of the important bacterial populations in these samples. However, care must be taken to ensure that the molecular methodologies are coupled synergistically with culture-based approaches, as well as analyses that address the functionality of the intestinal population from a quantitative perspective of animal production (Dahllöf, 2002).
Most common bacterial genera from cattle (n = 6) ruminal fluid and feces when fed feedlot ration before introduction of dried distillers grains plus solubles into rations
| Rank | Genera isolated from ruminal fluid | % of bacterial population | SD | No. of cows detected | Genera isolated from feces | % of bacterial population | SD | No. of cows detected |
|---|---|---|---|---|---|---|---|---|
| 1 | Prevotella | 18.21 | 2.67 | 6 | Clostridium | 19.74 | 1.35 | 6 |
| 2 | Succinivibrio | 11.81 | 1.50 | 6 | Bacteroides | 10.45 | 3.23 | 6 |
| 3 | Bacteroidales | 11.69 | 0.98 | 6 | Bacteroidales | 4.83 | 1.68 | 6 |
| 4 | Megasphaera | 4.51 | 1.05 | 6 | Acetivibrio | 4.80 | 1.26 | 6 |
| 5 | Butyrivibrio | 4.34 | 0.51 | 6 | Prevotella | 4.38 | 6.28 | 6 |
| 6 | Ruminobacter | 3.82 | 0.65 | 6 | Ruminococcus | 3.73 | 1.66 | 6 |
| 7 | Bacteroides | 3.78 | 0.20 | 6 | Dethiosulfovibrio | 3.55 | 0.99 | 6 |
| 8 | Clostridium | 3.14 | 1.12 | 6 | Eubacterium | 3.25 | 0.45 | 6 |
| 9 | Oscilispira | 2.97 | 0.77 | 6 | Akkermansia | 3.22 | 0.80 | 5 |
| 10 | Cytophaga | 2.83 | 1.66 | 6 | Alistipes | 3.12 | 1.14 | 6 |
| 11 | Enterococus | 2.49 | 0.38 | 6 | Ethanologenbacterium | 2.45 | 1.43 | 5 |
| 12 | Roseburaia | 2.34 | 1.29 | 6 | Capnocytophagia | 2.35 | 1.03 | 5 |
| 13 | Eubacterium | 2.08 | 0.78 | 5 | Papillibacter | 2.32 | 0.57 | 6 |
| 14 | Holdemania | 1.84 | 0.66 | 6 | Dysgonomonas | 2.22 | 0.59 | 6 |
| 15 | Porphyromonas | 1.63 | 0.91 | 5 | Porphyromonas-like | 2.17 | 1.17 | 6 |
| 16 | Acidaminococcus | 1.08 | 0.39 | 5 | Porphyromonas | 1.93 | 0.54 | 5 |
| 17 | Selenomonas | 1.06 | 0.35 | 6 | Oscillospira | 1.65 | 0.70 | 6 |
| 18 | Firmicutes | 0.95 | 0.31 | 6 | Catabacter | 1.46 | 0.52 | 5 |
| 19 | Spirochaeta | 0.88 | 0.34 | 5 | Treponema | 1.30 | 0.48 | 5 |
| 20 | Ruminococcus | 0.85 | 0.42 | 5 | Victivallis | 1.27 | 0.44 | 6 |
| 21 | Acinetobacter | 0.83 | 0.39 | 4 | Rhizobium | 1.06 | 0.42 | 5 |
| 22 | Acetanaerobacterium | 0.76 | 0.37 | 5 | Hespellia | 1.05 | 0.39 | 5 |
| 23 | Alistipes | 0.76 | 0.34 | 6 | Turicibacter | 0.88 | 0.29 | 5 |
| 24 | Desulfovibrio | 0.75 | 0.32 | 6 | Sporobacter | 0.88 | 0.37 | 5 |
| 25 | Akkermansia | 0.68 | 0.37 | 6 | Firmicutes | 0.86 | 0.36 | 6 |
| Total | 86.08 | Total | 84.92 | |||||
| Firmicutes | 28.41 | Firmicutes | 38.50 | |||||
| Bacteroidetes | 38.90 | Bacteroidetes | 32.51 | |||||
| Firmicutes:Bacteroidetes | 0.73 | Firmicutes:Bacteroidetes | 1.18 |
Most common genera (as a percentage of the total bacterial population) identified from ruminal fluid of cattle (n = 2/diet) fed ration where the concentrate component was replaced with 0, 25, or 50% dried distillers grains plus solubles (DDGS)1
| Genera | Proportion of the total bacterial population, % | SEM | P-value | ||
|---|---|---|---|---|---|
| 0% DDGS | 25% DDGS | 50% DDGS | |||
| Prevotella | 34.06 | 35.94 | 52.04 | 5.15 | |
| Succinivibrio | 19.49a | 12.72a | 4.80b | 2.76 | 0.043 |
| Enterococcus | 4.17 | 3.68 | 2.29 | 0.92 | |
| Bacteroides | 3.94a | 9.52ab | 10.09b | 2.73 | 0.038 |
| Bacteroidales | 3.61 | 2.82 | 2.15 | 0.35 | |
| Cytophaga | 3.34 | 1.59 | 1.15 | 0.11 | |
| Spirochaeta | 2.84 | ND2 | 0.41 | 3.14 | |
| Clostridium | 2.52 | 1.18 | 2.60 | 1.42 | |
| Porphyromonas | 2.33 | 1.55 | ND | 1.08 | |
| Ruminococcus | 2.30 | 0.75 | ND | 1.65 | |
| Eubacterium | 1.95 | 1.49 | 1.90 | 0.21 | |
| Roseburia | 1.53 | 0.93 | 1.99 | 0.59 | |
| Holdemania | 1.38 | 1.01 | 0.00 | 0.77 | |
| Succiniclasticum | 1.36 | 0.17 | 0.15 | 0.02 | |
| Selenomonas | 1.30 | 1.40 | 0.94 | 0.29 | |
| Firmicutes | 1.06 | 1.92 | 0.67 | 0.73 | |
| Total | 87.18 | 76.67 | 81.18 | ||
a,bRows with different superscripts differ by P < 0.05.
1The genera identified are ordered by most abundant sequences.
2ND indicates not detected.
Most common genera (as a percentage of the total bacterial population) identified from feces of cattle (n = 2/diet) fed ration where the concentrate component was replaced with 0, 25, or 50% dried distillers grains plus solubles (DDGS)1
| Genera | Proportion of the total bacterial population, % | SEM | P-value | ||
|---|---|---|---|---|---|
| 0% DDGS | 25% DDGS | 50% DDGS | |||
| Clostridium | 14.44 | 12.67 | 11.77 | 0.86 | |
| Bacteroides | 11.25 | 5.07 | 9.83 | 0.76 | |
| Bacteroidales | 8.42 | 6.11 | 5.14 | 0.38 | |
| Alistipes | 6.45 | 4.05 | 5.92 | 0.57 | |
| Akkermansia | 5.64 | 12.55 | 0.00 | 0.31 | |
| Prevotella | 3.61 | 5.79 | 2.54 | 0.13 | |
| Ruminococcus | 2.88 | 2.19 | 0.92 | 0.14 | |
| Acinetobacter | 2.84a | 10.74b | 10.35b | 0.11 | 0.01 |
| Eubacterium | 2.57 | 0.98 | 1.57 | 0.12 | |
| Enterococcus | 2.23 | 4.29 | 2.37 | 0.08 | |
| Acetivibrio | 2.09 | 3.87 | 1.02 | 0.11 | |
| Firmicutes | 2.04 | 0.00 | 1.27 | 0.13 | |
| Oscillospira | 2.00 | 1.09 | 0.93 | 0.14 | |
| Ethanologenbacterium | 1.72 | 0.93 | 0.57 | 0.11 | |
| Porphyromonas-like | 1.10 | 1.28 | 4.19 | 0.08 | |
| Acidaminococcus | 1.07 | 0.64 | 0.00 | 0.18 | |
| Papillibacter | 1.03 | 1.33 | 0.00 | 0.13 | |
| Desulfovibrio | 1.00 | 0.73 | 0.00 | 0.13 | |
| Total | 72.38 | 73.03 | 58.39 | ||
a,bValues within a row with different superscripts differ by P < 0.05.
1The genera identified are ordered by most abundant sequences.
Distillers grains are a coproduct feed from ethanol production that are used as cost-effective feed supplements for finishing and lactating cattle (Firkins et al., 1985). Yeast fermentation utilizes much of the starch component of the grain, thereby concentrating nutrients (e.g., bran, fat, minerals, and protein) nearly 3-fold (Spiehs et al., 2002), making DDGS a nutritionally attractive, cost-effective replacement for energy feeds. The inclusion of DDGS into cattle rations has been shown to be an effective replacement for common feedstuffs and has demonstrated an increased daily BW gain in beef cattle (Al-Suwaiegh et al., 2002) and milk yield and feed efficiency in dairy cows (Kleinschmit et al., 2006). Diet composition can also alter the microbial population of the rumen and gastrointestinal tract (Gouws and Kistner, 1965; Russell, 1984). Distillers grains are no exception to this and have been suggested to increase the fecal shedding of E. coli O157:H7 in cattle fed wet or dry distillers grains (Jacob et al., 2008a,b). Although E. coli O157:H7 was not detected in any of the present samples and Salmonella spp. and Campylobacter spp. were isolated in very small numbers sporadically from only 4 fecal and 2 ruminal samples, the data presented herein demonstrate that changes in rations can affect the microbial ecology of the rumen and intestinal tract of cattle, which can potentially affect food safety.
When cattle were fed rations that contained 0, 25, or 50% DDGS, bacterial populations were variable between animals on the same treatment, so individual animal data were pooled across breed (Tables 4 and 5). In ruminal samples collected across all 3 diets, more than 400 different bacterial species were detected that belonged to 56 separate genera. In all fecal samples, more than 540 different bacterial species were detected corresponding to 94 separate genera. Changing dietary DDGS levels did change relative microbial population proportions in the rumen and lower gut. In rumen fluid samples, the genus Succinivibrio populations were reduced by DDGS inclusion that only reached significance (P = 0.039) in cattle fed 50% DDGS, and Bacteroides populations were increased by DDGS feeding that reached significance (P = 0.047) in cattle fed 50% DDGS (Table 4). Meanwhile, Prevotella populations increased with increasing DDGS (P = 0.045). In fecal samples, Bacteroidales, Oscillispira, and Ruminococcus populations were decreased approximately 50% by feeding the greatest amount of DDGS, but none of these changes approached statistical significance (P > 0.10; Table 5). Only levels of Acinetobacter were significantly increased (P < 0.036) in the feces by DDGS feeding.
Clostridium spp. is a broad genus and was the most commonly detected from cattle feces, accounting for 11 to 14% of the fecal population on the various DDGS diets, yet accounted for <4% of the ruminal population (Tables 3, 4, and 5). Clostridium was the most diverse genus identified, and we detected total of 77 and 85 separate species of Clostridium spp. in the rumen and feces, respectively. Bacteroides are well-known gastrointestinal bacteria that were also identified in all cattle and diets and were represented by 28 and 27 species in the rumen and feces, respectively. Previous research into DDGS feeding indicated that a 15% dietary level caused total culturable, amylolytic, and lactilytic bacteria in the rumen to be increased approximately 2- to 7-fold (Fron et al., 1996). However, these types of effects were not observed in the present study, which may indicate that future studies should examine the microbial population from a functional guild perspective and remain focused on the role of the species in the gastrointestinal ecosystem.
Research has demonstrated that there is a relationship between dietary efficiency and gastrointestinal bacterial populations and diversity (Ley et al., 2006; Turnbaugh et al., 2006, 2009). These studies indicated that genetically obese mice contained a greater population of bacteria from the superkingdoms of Firmicutes than Bacteroidetes when compared with genetically lean mice (Ley et al., 2006). In the present study, we found no statistically significant differences in the ratios of Firmicutes:Bacteroidetes in the ruminal fluid or fecal populations, but we did observe a trend (P = 0.07) for smaller Firmicutes:Bacteroidetes ratios as the proportion of dietary DDGS increased (Figure 1). As the populations of ruminal and fecal bacteria in food animals are further quantified, researchers should be able to correlate microbial populations of kingdoms or nutrient-utilization guilds or both with production variables such as residual feed intake, growth, milk production, and animal health.
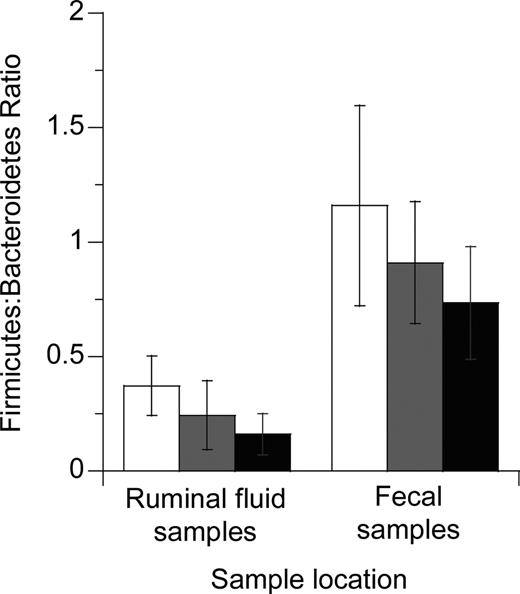
Effects of replacing concentrate with 0, 25, or 50% dried distillers grains with solubles (DDGS) in cattle rations on the Firmicutes:Bacteroidetes ratio in ruminal fluid and fecal samples collected 21 d after dietary switch. Open bars represent cattle fed a standard feedlot ration; gray bars indicate cattle fed 25% DDGS; and black bars show cattle fed 50% DDGS. Error bars represent SD.
Changes in the diet may alter the ruminal microbial profile and resulting fermentation end product profiles (Gouws and Kistner, 1965), which affect ruminal pH and the extent of ruminal digestibility and fermentation efficiency (Esdale and Satter, 1972; Mackie and Gilchrist, 1979; Shriver et al., 1986). In the present study, ruminal pH was decreased (P < 0.05) in cattle consuming a 50% DDGS ration compared with those consuming a 0% DDGS ration (6.58 vs. 7.18); however, the pH values on these diets were greater than is typically observed in cattle fed a feedlot ration. Other researchers found that distillers grains contained the organic acids fumarate, malate, and succinate (Fron et al., 1996), which have been reported to enhance lactate fermentation by Selenomonas ruminantium resulting in an increased ruminal pH (Martin, 1998). Yet in the current results, populations of S. ruminantium were not changed in the rumen on different levels of DDGS (Table 4).
Conclusions
Due to the need to culture bacteria from a normal gut and the inability of some of the bacterial species to grow in laboratory conditions, it has been unclear which members of the gastrointestinal microbial ecosystem are important to animal health and what role they may have in animal growth efficiency. Pyrosequencing (bTEFAP) such as used in this study is not limited to detecting organisms via culture methods and can be used to define what constitutes a healthy microbial ecosystem profile, and is capable of correlating populations of bacterial species with other traditional animal production variables (e.g., residual feed intake, dietary energy and protein utilization, host growth rate, and efficiency). However, the use of the molecular techniques is only a tool that can provide information for further examination by traditional microbiological and nutritional techniques. Pyrosequencing can provide a population estimate, but enzymatic and metabolic specific activities of the identified members of the microbial ecosystem in isolation and combination with mixed microbial populations must still be fully understood to make improvements in animal health, productivity, and food safety.
LITERATURE CITED
Footnotes
Proprietary or brand names are necessary to report factually on available data; however, the USDA neither guarantees nor warrants the standard of the product, and the use of the name by the USDA implies no approval of the product or exclusion of others that may be suitable.
