


ABSTRACT
Genetic selection for improved growth and overall meatiness has resulted in the occurrence of 2 major mutations in pigs, the Rendement Napole (RN) and Halothane (Hal) gene mutations. At the tissue level, these mutations influence energy metabolism in skeletal muscle and muscle fiber type composition, yet also influence total body composition. The RN mutation affects the adenosine monophosphate-activated protein kinase γ subunit and results in increased glycogen deposition in the muscle, whereas the Hal mutation alters sarcoplasmic calcium release mechanisms and results in altered energy metabolism. From a meat quality standpoint, these mutations independently influence the extent and rate of muscle energy metabolism postmortem, respectively. Even though these mutations alter overall muscle energy metabolism and histochemically derived muscle fiber type independently, their effects have not been yet fully elucidated in respect to myosin heavy chain (MyHC) isoform content and those enzymes responsible for defining energetics of the tissue. Therefore, the objective of this study was to determine the collective effects of the RN and Hal genes on genes and gene products associated with different muscle fiber types in pig skeletal muscle. To overcome potential pitfalls associated with traditional muscle fiber typing, real-time PCR, gel electrophoresis, and Western blotting were used to evaluate MyHC composition and several energy-related gene expressions in muscles from wild-type, RN, Hal, and Hal-RN mutant pigs. The MyHC mRNA levels displayed sequential transitions from IIb to IIx and IIa in pigs bearing the RN mutation. In addition, our results showed MyHC protein isoform abundance is correlated with mRNA level supporting the hypothesis that MyHC genes are transcriptionally controlled. However, transcript abundance of genes involved in energy metabolism, including lactate dehydrogenase, citrate synthase, glycogen synthase, and peroxisome proliferator-activated receptor α, was not different between genotypes. These data show that the RN and Hal gene mutations alter muscle fiber type composition and suggest that muscle fiber energy metabolism and speed of contraction, the 2 determinants of muscle fiber type, can be uncoupled.
INTRODUCTION
The Rendement Napole (RN) and Halothane (Hal) gene mutations alter myosin heavy chain (MyHC) composition, a determinant of muscle fiber type. These genes independently influence energy metabolism and meat quality development. The RN mutation leads to an increase in muscle glycogen and inferior pork quality, characterized by a low ultimate muscle pH. Rendement Napole mutant pigs have a point mutation in the adenosine monophosphate (AMP)-activated protein kinase (AMPK) γ3 subunit (Milan et al., 2000). Adenosine monophosphate-activated protein kinase is an energy sensor that plays an important role in glucose uptake, glycogen synthesis, and fat oxidation in skeletal muscle (Kahn et al., 2005). Adenosine monophosphate-activated protein kinase γ3 is predominantly expressed in type II fast-contracting myofibers (Mahlapuu et al., 2004). Thus, the increase in muscle glycogen content in RN mutant pigs is observed primarily in fast-twitch muscle fibers (Marinova et al., 1992). Yet, white muscles of RN mutant pigs exhibit greater oxidative capacities and decreased proportions of the fastest-contracting MyHC (IIb) as assessed by classical histological examination (Lebret et al., 1999). On the other hand, Hal-positive pigs (nn) possess mutated skeletal muscle calcium release channels, which allow for enhanced calcium release (Mickelson and Louis, 1996). Greater resting cytosolic calcium concentrations in Hal lead to altered energy metabolism but in a distinctly different manner than the RN mutation. Using antibodies against various MyHC, Fiedler et al. (1999) and Depreux et al. (2000) showed that Hal mutant pigs have increased IIb fibers at the expense of type I fibers, indicating the Hal mutation drives fiber-type transition to a faster, more glycolytic entity.
Indeed, both mutations influence muscle energy metabolism, but their effect on MyHC composition is unclear. Therefore, the purpose of this study was to determine the effects of the RN and Hal genes on porcine skeletal muscle MyHC profiles and establish whether energy metabolism and contractile speed is capable of being uncoupled.
MATERIALS AND METHODS
Experimental procedures with these animals were approved by the Purdue University Animal Care and Use Committee.
Animals
Animals for this study were maintained at the Purdue University Swine Research Unit. Only those pigs homozygous at both loci (NN/rn+rn+, normal; NN/RN−RN−, RN; nn/rn+rn+, Hal; nn/RN−RN−, Hal-RN; n = 10 per treatment) were used for this experiment. Genotypes were determined using the PCR-RFLP technique. Halothane and RN PCR products were digested with appropriate restriction enzymes and separated on agarose gel following the procedures of O'Brien et al. (1993) and Meadus et al. (2002), respectively. At approximately 120 kg of BW, pigs were killed and then exsanguinated following standard industry procedures. About 6 g of muscle was isolated from LM (area of 10th and 11th costae), chopped, and snap-frozen in liquid nitrogen.
RNA Isolation, cDNA Synthesis, and Real-Time PCR
Total RNA from LM was extracted using the single-step RNA isolation method (Chomczynski and Sacci, 1987) with modifications. Isolated RNA was treated with 4 U of DNase (Ambion, Indianapolis, IN) in 2 μL of a 10× DNase buffer containing 100 mM Tris-HCl (pH 7.5), 25 mM MgCl2, 5 mM CaCl2, and 3 μL of nuclease-free water to eliminate genomic DNA contamination. After 30 min of incubation, 5 μL of DNase inactivation reagent (Ambion) was added to the reaction. Ribonucleic acid was loaded into 0.22-μm SpinX centrifuge tube filters (VWR International, West Chester, PA) and centrifuged at 10,000 × g for 1 min at room temperature. One microliter of purified RNA (0.8 μg/μL) was then diluted in TE buffer (249 μL; 10 mM Tris-Cl, 1 mM EDTA, pH 8.0). Twenty-five microliters of diluted RNA, 75 μL of TE buffer, and 100 μL of Ribogreen (Molecular Probes, Carlsbad, CA) reagent were combined in a 96-well microplate, and fluorescence signal was measured at 480 (excitation) and 520 (emission) nm by GENios Pro fluoremeter (Tecan, Durham, NC). Complementary DNA was made using the random primed cDNA synthesis method. Total RNA (0.5 μg) in 5 μL nuclease-free water was added to 0.5 μL of 100 ng/μL random hexamers and 0.5 μL of 100 μM deoxynucleoside triphosphate. Samples were denatured at 65°C for 5 min after which 1 μL of 10 mM dithiothreitol (Invitrogen, Carlsbad, CA), 0.5 μL of 5 U Moloney murine leukemia virus reverse transcriptase (Invitrogen), 0.5 μL of 0.5 U SUPERase-In (Ambion), and 2 μL of 5× First Strand Buffer (Invitrogen) was added in a total volume of 10 μL. The cDNA mixture was incubated in the thermal cycler at 25°C for 10 min, 37°C for 50 min, and 70°C for 10 min; it was then chilled to 4°C. Complementary DNA samples were then diluted to 10 μg/mL in nuclease-free water. Real-time quantification was performed in duplicate 15-μL reactions containing 5 μL of cDNA and 10 μL of the gene-specific master mix. The PCR master mix consisted of 10 μM gene-specific primers and iQ SYBR Green Supermix (Bio-Rad, Richmond, CA) containing 100 mM KCl, 40 mM Tris-HCL (pH 8.4), 0.4 mM of each deoxynucleoside triphosphate, 50 U of iTaq DNA polymerase/mL, 6 mM MgCl2, 7.5 μL of SYBR Green I, 20 nM fluorescein stabilizers, and nuclease-free water. Primer sequences for β-actin and MyHC isoforms (type I, IIa, IIx, and IIb), citrate synthase, peroxisome proliferator activated receptor α, lactate dehydrogenase, and glycogen synthase are shown in Table 1. β-Actin was used as an internal control. Real-time quantification was performed for 40 cycles using the iCycler real-time PCR detection system (Bio-Rad) according to optimized gene-specific protocols shown in Table 2. Amplified real-time PCR products were sequenced to validate primer specificity. Samples were amplified in separate tubes, and the increase in fluorescence was measured in real time. The first cycle in the log-linear region of amplification in which a significant increase in fluorescence was detected above background was designated the threshold cycle (Ct). Therefore, with a greater initial amount of cDNA, the accumulated product was detected earlier in the PCR process, and a decreased Ct value was recorded. Gene expression data are presented as Ct values. Water was used as negative control, and no PCR product was detected.
Nucleotide sequences of the primers used for quantitative reverse transcription-PCR
| Gene1 | Sequence (5′-3′) | Accession no. | |
|---|---|---|---|
| MyHC I2 | Forward | GGC CCC TTC CAG CTT GA | L10129 |
| Reverse | TGG CTG CGC CTT GGT TT | ||
| MyHC IIa2 | Forward | TTA AAA AGC TCC AAG AAC TGT TTC A | U11772 |
| Reverse | CCA TTT CCT GGT CGG AAC TC | ||
| MyHC IIx2 | Forward | TGC TTC AAG TTC TGC CCC ACT | U90719 |
| Reverse | GGC TGC GGG TTA TTG ATG G | ||
| MyHC IIb2 | Forward | CAC TTT AAG TAG TTG TCT GCC TTG | U90720 |
| Reverse | AG GGC AGC AGG GCA CTA GAT GT | ||
| β-Actin | Forward | GGC ATC CAC GAG ACC ACC TTC AA | U07786 |
| Reverse | CAG ACA GCA CCG TGT TGG CGT AGA | ||
| Citrate synthase | Forward | TGC CAG TGC TTC TTC CAC GAA CTT | NM_214276 |
| Reverse | GTT GCC GTG TTG CTG CCT GAA G | ||
| PPARα | Forward | CAA GGG CTT CTT TCG GAG AAC CAT | AF175309 |
| Reverse | GCG CCC AAA TCG AAT TGC ATT AT | ||
| LDH | Forward | GTG CAT CCG ATT TCC ACC ATG ATT | U07178 |
| Reverse | CCA TTC TGT CCC AAG ATG CAA GGA | ||
| Glycogen synthase | Forward | CCC AGT GGG AGG AGG CAG TCT TG | AJ507152 |
| Reverse | GAA CCG CCG GTC CAG AAT GTA CA |
1MyHC = myosin heavy chain; PPARα = peroxisome proliferator-activated receptor α; LDH = lactate dehydrogenase.
Gene-specific protocols for real-time amplification conditions
| Gene1 | Hot start | Melting | Annealing | Synthesis |
|---|---|---|---|---|
| MyHC I | 95°C 15 s | 79°C 15 s | 72°C 30 s | 55°C 15 s |
| MyHC IIa | 95°C 15 s | 78°C 15 s | 72°C 30 s | 52°C 15 s |
| MyHC IIx | 95°C 15 s | 79°C 15 s | 72°C 30 s | 56°C 15 s |
| MyHC IIb | 95°C 15 s | 78°C 15 s | 72°C 30 s | 56°C 15 s |
| β-Actin | 95°C 15 s | 80°C 15 s | 72°C 30 s | 59°C 15 s |
| Citrate cynthase | 95°C 15 s | 78°C 15 s | 72°C 30 s | 59°C 15 s |
| PPARα | 95°C 15 s | 80°C 15 s | 72°C 30 s | 54°C 15 s |
| LDH | 95°C 15 s | 76°C 15 s | 72°C 30 s | 56°C 15 s |
| Glycogen synthase | 95°C 15 s | 83°C 15 s | 72°C 30 s | 59°C 15 s |
1MyHC = myosin heavy chain; PPARα = peroxisome proliferator-activated receptor α; LDH = lactate dehydrogenase.
SDS-Glycerol Gel Electrophoresis of MyHC
Myosin heavy chain isoforms were separated with SDS glycerol gel electrophoresis according to the method of Talmadge and Roy (1993) with modifications. Longissimus dorsi muscles (100 mg) were powdered in liquid nitrogen, and myosin was extracted with a high ionic strength buffer (pH 6.5) containing 0.3 M KCl, 0.1 M KH2PO4, 50 mM K2HPO4, 10 mM EDTA, and 50% glycerol. Samples were then centrifuged at 10,000 × g for 20 min at 4°C. Supernatants were diluted 1:1 (vol/vol) with glycerol. Concentration of the isolated protein was determined using a BCA Protein Assay kit (Pierce, Rockford, IL) according to the protocol of the manufacturer with BSA as a standard. Samples were then suspended in Laemmli buffer (pH 6.8) containing 10% SDS, 10% β-mercaptoethanol, and 20% glycerol in 0.5 M Tris and boiled for 5 min. Myosin heavy chain isoforms were separated onto 8% polyacrylamide gels. Stacking gels were composed of 30% glycerol, 4% acrylamide:N,N-methylene-bis-acrylamide (50:1), 0.5 M Tris (pH 6.8), 4 mM EDTA, and 0.4% SDS. The resolving gel consisted of 30% glycerol, 8% acrylamide:N,N-methylene-bis-acrylamide (50:1), 0.4 M Tris (pH 8.8), 0.1 M glycine, and 4% SDS. Equal amounts of protein (5 μg per lane) were then loaded onto gels set on a Mini-Protein II Dual Slab Cell electrophoretic system (Bio-Rad) and run for 30 h at 70 V at 4°C. After migration, the gels were silver- or Coomassie Blue-stained, and relative amounts of different MyHC isoforms were quantified using Kodak 1D Image Analysis Software (Kodak, New Haven, CT).
Western Blotting
Proteins (5 μg per lane) were separated electrophoretically as described above. Separated proteins were then transferred to polyvinylidene fluoride membranes at 200 mA for 2 h, and membranes were stained with Ponceau S (Sigma, St. Louis, MO) to ensure equal loading and transfer of proteins. Membranes were blocked for 1 h at room temperature in blocking solution (5% nonfat dry milk in Tris-buffered saline with 0.1% Tween-20). Membranes were incubated 1 h at room temperature with antibodies specific for MyHC type I (A4.840; Hughes and Blau, 1992), IIa (6B8; Depreux et al. 2000), IIb (BF-F3; Schiaffino et al. 1989), and fast all (My-32; Sigma) diluted 1:1,000 in the blocking solution. Secondary antibodies conjugated with horse-radish peroxidase (Jackson ImmunoResearch, West Grove, PA), diluted 1:1,000 in the blocking solution, were applied for 1 h. Bands were visualized using enhanced chemiluminescence (ECL; Amersham, Arlington Heights, IL). Several exposures of x-ray films were conducted. Densitometry (ImageJ software, National Institutes of Health, Bethesda, MD) was used to quantify bands that resulted from exposure times less than film saturation. All other chemicals were obtained from Sigma.
Statistics
Data are represented as the mean ± SE. Differences between genotypes were assessed utilizing individual Ct or band intensities with the GLM procedure (SAS Inst. Inc., Cary, NC). Values were analyzed as a factorial design with main effects of each Hal and RN gene to analyze the main effects and their interaction (Hal × RN). Least squares means were generated using LS-MEANS, and Tukey's adjustment was used for multiple comparisons. Statistical significance was established at P < 0.05.
RESULTS
The BW of the normal, RN, Hal, and Hal-RN genotypes were similar (Figure 1; P = 0.12). β-Actin gene expression, the control to test for experimental variation, did not differ between muscles from normal and mutant pigs (Figure 2A). Expression of slow-twitch type I MyHC was not different between genotypes (Figure 2B). There was an RN (P < 0.05) and Hal (P < 0.05) gene effect for MyHC IIa mRNA expression but no Hal × RN interaction (P = 0.34). Thus, the main effects of the RN (−/rn+rn+ vs. −/RN−RN−) and Hal (NN/−vs. nn/−) genes are presented separately in Figure 2C. Myosin heavy chain type IIa mRNA abundance was 1.5-fold greater in RN and 1.4-fold less in Hal compared with normal, respectively (Figure 2C). The RN mutation increased (P < 0.01) IIx mRNA expression (Figure 2D), and there was tendency for a Hal × RN interaction (P = 0.07) for type IIx MyHC mRNA. There was no Hal gene effect or Hal × RN interaction for MyHC IIb MyHC expression (Figure 2E). Myosin heavy chain IIb expression was decreased (P < 0.05) in pigs bearing the mutant RN genotype, and this level was approximately 4-fold less than that of normal pigs.
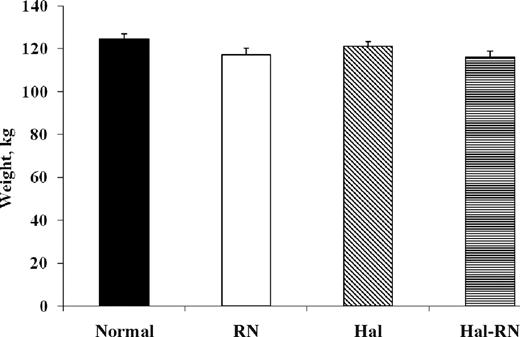
Body weights of normal, Rendement Napole (RN), Halothane (Hal), and Hal-RN double mutant pigs.
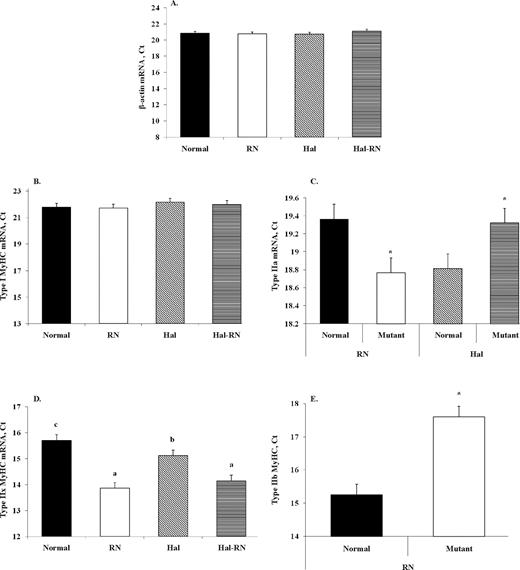
Real-time determination of β-actin (A), myosin heavy chain (MyHC) type I (B), IIa (C), IIx (D), and IIb (E) mRNA isoforms of LM from normal, Rendement Napole (RN), Halothane (Hal), and Hal-RN double mutant pigs. *P < 0.05 vs. control. a–cMeans with different letters differ (P < 0.05; n = 10 per group for A, B, and D and n = 20 per group for C and E). Ct = threshold cycle.
Separation of MyHC isoforms by SDS-PAGE showed MyHC composition similar to real-time PCR. Although we could not separate all 4 adult MyHC, 3 bands, including type IIa/IIx, type IIb, and type I, were clearly discernable using the protocol of Talmadge and Roy (1993). Scans of these gels (Figure 3) showed type I MyHC protein abundance did not vary across the genotypes. Expression of MyHC IIa/IIx proteins was greater in the Hal-RN genotype (P < 0.01). Type IIb protein expression was decreased in Hal-RN (P < 0.01), which is consistent with expression patterns of mRNA.
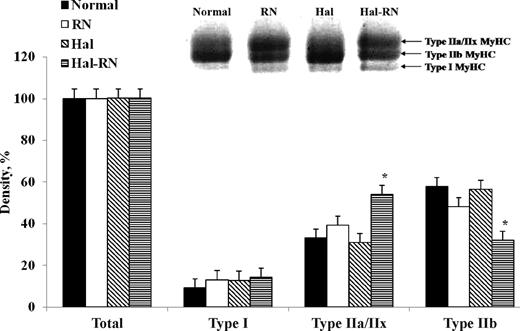
Myosin heavy chain (MyHC) isoform contents in normal, Rendement Napole (RN), Halothane (Hal), and Hal-RN double mutant pigs as determined by SDS-PAGE analysis. Bottom, middle, and top bands contain type I, IIb, and IIa/IIx MyHC, respectively. *P < 0.05 vs. other genotypes within a MyHC isoform (n = 3 per treatment).
Real-time PCR and SDS-PAGE data were confirmed by Western blot analysis (Figure 4). No difference in MyHC type I protein content was detected between normal, RN, Hal, and Hal-RN genotypes. The fast antibody reacts with all type II fibers and did not reveal any differences in type II total protein content between genotypes. In accord with real-time PCR and SDS-PAGE data, Western blot analysis revealed the RN mutation increased MyHC IIa and decreased IIb protein expression (P < 0.01). There was a Hal × RN interaction for MyHC IIb protein expression (P < 0.05). Myosin heavy chain IIb protein expression was decreased by 28% in the RN genotype and nearly 50% in the Hal-RN genotype compared with normal pigs. The RN and Hal-RN genotypes possess a greater proportion of oxidative MyHC, as evidenced by a decrease in IIb and an increase in IIa MyHC isoform protein expression (Figure 4).
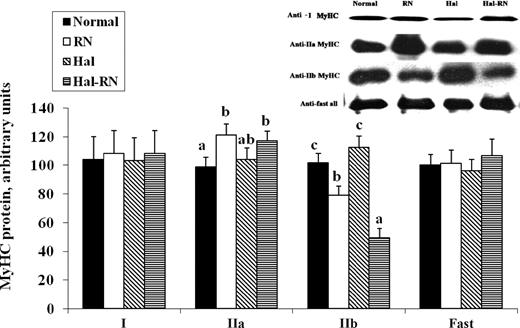
Detection of myosin heavy chain (MyHC) isoforms by Western blot analysis using anti-MyHC type I, IIa, and IIb. a–cMeans with different letters differ within a MyHC isoform (P < 0.05; n = 3 in each sample). RN = Rendement Napole; Hal = Halothane.
Levels of mRNA expression of MyHC I (Figure 5A; P < 0.01) and IIb (Figure 5B; P < 0.01) were correlated with protein abundance determined with SDS-PAGE (R2 = 0.52 and 0.57, respectively). No relationship (P > 0.3) was found between mRNA and protein abundance for IIa/IIx MyHC (data not shown).
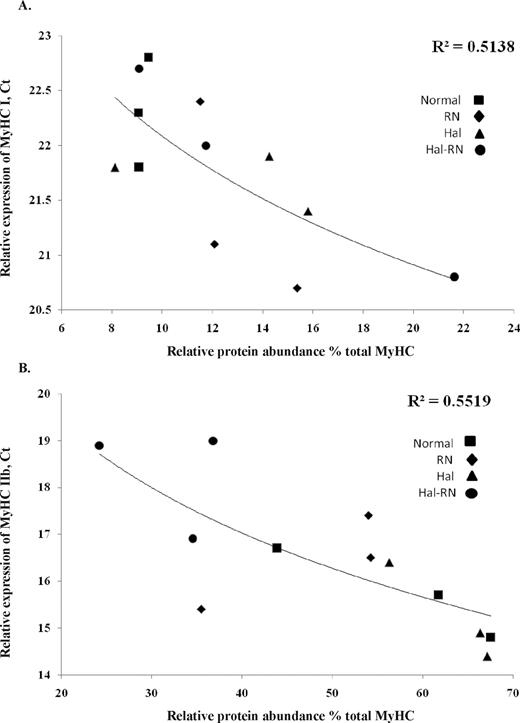
Relationship between mRNA expression (threshold cycle, Ct) and relative protein abundance (%) of type I (A) and IIb (B) in LM from normal, Rendement Napole (RN), Halothane (Hal), and Hal-RN double mutant pigs. Each data point represents 1 sample from 1 pig.
No difference between genotypes was found in mRNA expression level of citrate synthase, lactate dehydrogenase, peroxisome proliferator-activated receptor α, or glycogen synthase (Figure 6).
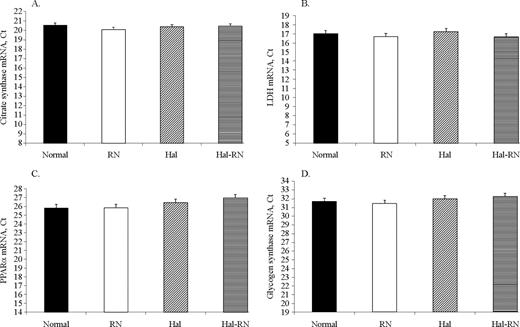
Real-time PCR analysis for mRNA expression level of citrate synthase (A), lactate dehydrogenase (LDH; B), peroxisome proliferator-activated receptor α (PPARα; C), and glycogen synthase (D) of LM from normal, Rendement Napole (RN), Halothane (Hal), and Hal-RN double mutant pigs. n = 10 in each group. Ct = threshold cycle.
DISCUSSION
Skeletal muscle fiber type diversity is represented, in part, by differences in MyHC isoforms. Four adult MyHC isoforms are expressed in the skeletal muscle of pigs: type I, IIa, IIx, and IIb (Lefaucheur et al., 2002). Slow-twitch type I myofibers consisting predominately of type I MyHC receive sustained, tonic contractile motor activity, whereas type II fast-contracting fibers containing type II MyHC are recruited by acute motor neuron activity (Hennig and Lomo, 1985). The type and abundance of cellular metabolic enzymes generally match the energetic demands of each fiber-based functional capacity. Type I fibers have greater oxidative capacity to support sustained contraction, whereas type IIb fibers are predominantly glycolytic and rapidly use glycogen for short bursts of activity. The IIa and IIx fibers are intermediate to type I and IIb fibers (Chang et al., 2003).
Skeletal muscle is a dynamic tissue and adapts to external cues by changing its metabolism and contractile ability. Transition of MyHC follows a sequential, yet reversible, pathway: I ↔ IIa ↔ IIx ↔ IIb (Pette and Staron, 2000). Interestingly, genetic selection for growth performance pushes fiber type to the right of this equation (Solomon and West, 1985; Weiler et al., 1995). Traditionally, muscle fiber type has been characterized using ATPase and enzymatic staining; however, type IIx fibers cannot be distinguished from IIb fibers. Enzymatic staining is also problematic, because metabolic activity is a continuum across muscle fibers (Pette and Staron, 2000). Antibodies against the various isoforms of MyHC have improved muscle fiber-typing protocols, yet reliable IIb and IIx MyHC antibodies are lacking. To overcome this, expression of each MyHC isoform (type I, IIa, IIx, and IIb), their respective protein abundance, and various enzymes can be used to study muscle fiber type (Gunawan et al., 2007).
The combined use of immunohistochemistry with specific antibodies and quantitative real-time PCR has been used for more accurate classification of pig MyHC isoforms (Lefaucheur et al., 2004; Toniolo et al., 2004). Here, we determined MyHC composition of muscles from RN and Hal mutant pigs at the mRNA and protein levels using real-time PCR and Western blotting techniques, respectively. There were limitations to quantifying MyHC protein in pig skeletal muscle because IIa and IIx MyHC could not be separated by SDS-PAGE, and a specific type IIx MyHC antibody is not yet available. Nonetheless, significant correlations were found in MyHC type I and IIb expression between mRNA and protein levels, which indicates, at least in type I and IIb MyHC, that MyHC genes are transcriptionally controlled. The positive correlation between MyHC protein expression and its corresponding mRNA level has also been shown by others (Cox and Buckingham, 1992; Schiaffino and Reggiani, 1996; McKoy et al., 1998; Gunawan et al., 2007). However, we found no relationship between mRNA and protein level for type IIa and IIx MyHC, likely due to the absence of a specific antibody to detect type IIx MyHC.
Real-time PCR data showed RN mutant pigs had a greater proportion of IIa/IIx MyHC. Gel electrophoresis and Western blots confirmed that patterns of MyHC protein expression were similar to mRNA expression. These results support the observations that RN pigs possess increased IIa isoform and greater relative area of IIa fibers at the expense of IIb fibers (Lebret et al., 1999). Fiber type shift from IIb to IIa in RN mutant pigs is consistent with the function of AMPK in skeletal muscle; AMPK is activated by muscle contraction by increased AMP:ATP ratio (Fujii et al., 2000). Once activated, AMPK increases glucose uptake, fatty acid oxidation, and mitochondrial biogenesis (Hayashi et al., 1998; Zong et al., 2002; Koistinen et al., 2003). Barnes et al. (2004, 2005) showed that the R225Q mutation is a loss-of-function mutation that abolishes AMP dependence, resulting in greater basal AMPK activity. They also demonstrated that increased AMPK activity in R225Q mutants resulted in enhanced glycogen content in skeletal muscle by shifting metabolism toward fatty acid oxidation, thereby sparing glucose and glycogen.
Muscles from Hal mutant pigs have been shown to contain a greater proportion of glycolytic fibers and type IIb MyHC isoforms (Fiedler et al., 1999; Depreux et al., 2000). We also found decreased IIa mRNA and increased MyHC IIx mRNA, indicating the Hal mutation increases the expression of glycolytic fibers. Increased sarcoplasmic calcium concentrations in Hal mutant muscle may stimulate hypercontraction of myofibrils and glycolysis, thereby increasing the population of glycolytic fibers. Major signaling molecules downstream of calcium include calcium/calmodulin-dependent kinases (Fluck et al., 2000), calcium-dependent protein kinase (Freyssenet et al., 1999), and calcineurin (Chin et al., 1998). These signaling molecules are known to be selectively activated by calcium in a frequency-dependent manner and play an important role in activating mitochondrial biogenesis, myosin isoform expression, and muscle hypertrophy. Therefore, it is possible that specific calcium frequency elicited by Hal mutant muscle activates genes for glycolytic muscle fiber through these calcium signals. However, Lopez et al. (1986) found that resting sarcoplasmic calcium concentration in Hal mutant muscle is greater than in normal pigs, but is not sufficient to cause contraction. If this is the case, subcontraction concentrations of calcium in Hal mutant pigs may directly regulate signaling molecules or gene expression without causing changes in contractile activity or energy status. Therefore, more work is necessary to understand the mechanism by which calcium frequencies and signaling pathways affect muscle adaptation in Hal mutant pigs.
We found fiber type transition from IIb to IIx in muscles from Hal-RN double mutant pigs. These data imply that the RN gene predominantly regulates fiber type transition by promoting a more oxidative phenotype. However, we could not detect a significant increase in IIa mRNA in Hal-RN double mutant pigs. This indicates that the RN gene may push fibers toward slower phenotypes, whereas the Hal gene may induce the opposite machinery and increase the proportion of fast-twitch fibers. Therefore, it is possible that RN and Hal pig mutations may interact with each other in regulation of MyHC gene expression.
Transcript abundance of genes related to energy metabolism may be used to define fast- and slow-twitch fiber types (Peter et al., 1972). Lactate dehydrogenase, citrate synthase, and glycogen synthase were measured to characterize glycolysis, fatty acid oxidation, and glycolytic capacity, respectively. Neither Hal nor RN genotype affected expression of these genes. Collectively, these data demonstrate that RN and Hal genotypes may directly regulate MyHC gene expression without causing changes in transcription of genes related to energy metabolism. In other words, contractile profiles are not coordinately regulated with gene expression of enzymes in energy metabolism and are, therefore, uncoupled in these pigs. Enzyme activity may be more dependent on substrate availability or posttranslational modifications rather than transcriptional regulation (Mandarino et al., 1995). Further study is needed to address the activities of metabolic enzymes, because enzymatic activities could be different between genotypes.
In conclusion, we evaluated muscle fiber type-specific genes and gene products and showed that the RN and Hal mutations alter muscle fiber type transition. Specifically, the RN mutation decreases IIb mRNA and increases IIa and IIx mRNA expression, which corresponds to associated changes in protein expression. This supports the notion that MyHC are transcriptionally regulated in porcine skeletal muscle. Also, these data suggest that metabolism and MyHC are independently regulated and capable of being uncoupled. Further studies are needed to determine the mechanisms by which calcium-mediated signaling events and AMPK activity regulate enzyme activity, energy metabolism, and the speed of contraction.
