


Abstract
This study aimed to evaluate the effects of storage and different temperatures on the antibacterial activity and physicochemical characteristics of several types of honey.
Honeys stored for 16 weeks at 37 and 45°C showed significant declines in antibacterial activity determined by minimum inhibitory concentrations, the loss of hydrogen peroxide, decreases in honey pH, and increases in honey colour, with changes most pronounced at 45°C. In contrast, honeys stored for 16 weeks at ambient (∼22°C) and cold (4, −20, and −80°C) temperatures showed only minor changes. In a second set of 12 honeys stored for 16–32 months at ambient temperature and then 4°C, honeys showed minor changes in antibacterial activity, increases in colour, and decreases in pH. For a third set of 17 honeys stored for five years at ambient temperature, the honeys showed almost complete loss of hydrogen peroxide and were all significantly darker in colour, but showed varied changes in antibacterial activity.
Heat was detrimental to the antibacterial activity of honeys, as was long-term storage at ambient temperatures for some honeys but not others.
Exposure of honeys to elevated temperatures and storage of honeys at ambient temperatures for excessive time should be avoided. Changes in honey that occur under these conditions could be due to Maillard reactions and the formation of polyphenolic compounds that interfere with hydrogen peroxide.
Introduction
Honey produced by the European honeybee Apis mellifera is becoming increasingly popular both as a health supplement and as a potential treatment for superficial skin ailments such as wounds (Šedík et al. 2019, Testa et al. 2019, Zanchini et al. 2022). These therapeutic uses are supported by data from numerous in vitro studies demonstrating properties such as antibacterial and antioxidant activity (Anastasiou et al. 2021). In addition, results from clinical studies suggest that honey may be beneficial for treating a range of conditions, including blepharitis (Craig et al. 2020) and skin wounds (Sankar et al. 2021).
It is possible that the beneficial therapeutic properties of honey may change over time, meaning that honey stored for substantial time periods may have altered clinical effectiveness. After honey is harvested, it may be stored for periods of weeks to months, or potentially even years, before being processed into products for consumers. This storage may be at ‘ambient’ temperature rather than in a temperature-controlled environment, depending on the available facilities and the volumes of honey. In temperate climates, which includes parts of Australia, North America, and Europe, ambient temperatures in summer may be higher than 40°C (104°F) during the day, meaning that honey may potentially be exposed to these relatively high ambient temperatures for days or weeks at a time.
Physical and chemical characteristics of honeys that have been shown to change when honeys are exposed to varying temperatures or when stored over time include the important honey quality parameters diastase (α-amylase) and hydroxymethylfurfural (HMF), as well as crystallization and colour (Bulut and Kilic 2009, Kedzierska-Matysek et al. 2017). For example, the colour (measured by net absorbance A560–A720) of seven Canadian honeys (borage, fireweed, clover, dandelion, blueberry, blackberry, and pumpkin) increased from an average of ∼0.095–0.128 after storage at ambient temperature (∼24°C) for two years (Brudzynski and Kim 2011). Also, levels of HMF in a Turkish multifloral honey changed from 4.05 to 7.5 mg/kg after storage for only 10 days at 40°C (Bulut and Kilic 2009), indicating that some compositional changes can occur quite rapidly. Similarly, changes in the antibacterial activity of different types of honey over time have been observed (Brudzynski and Kim 2011, Chen et al. 2012, Majkut et al. 2021, Villacres-Granda et al. 2021). For example, one of these studies showed decreases in the antibacterial activity of four honeys after six months of storage at ambient temperature, with minimum inhibitory concentrations (MICs) for all four honeys changing from 6.25% to 12.5% against Escherichia coli, whereas for Bacillus subtilis, only one honey lost activity, with MICs changing from 12.5% to 25% (Brudzynski and Kim 2011). Many studies investigating the stability of honey focus on the effects of short-term heating, which may be part of the processing and bottling of honey (Chen et al. 2012, Karabagias et al. 2018), and fewer studies have investigated longer-term storage, particularly at ambient or near-ambient temperatures (Brudzynski and Kim 2011). In addition, studies characterizing changes in hydrogen peroxide generation in stored honey have also largely focused on short-term storage (Wang et al. 2004, Villacres-Granda et al. 2021) rather than long-term storage.
Given the gaps in our current knowledge of changes in antibacterial activity and hydrogen peroxide generation in honeys stored for longer time periods, this study aimed to characterize changes occurring in honeys stored at ambient to hot temperatures over time. For comparison, changes at several cool temperatures were evaluated in parallel. Changes in the antibacterial activity of stored honeys were investigated using both Gram-positive and Gram-negative test bacteria, and the study also explored the underlying physical and chemical characteristics of the honeys, which may help to explain the observed changes in antibacterial activity.
Methods
Honeys
Three groups of honeys (A, B, and C) were analysed in this study. Group A comprised 10 honeys: six from the floral source Jarrah (Eucalyptus marginata) and four from Marri (Corymbia calophylla). Group B comprised 12 honeys derived from eight different floral sources, and Group C comprised 17 honeys derived from nine different floral sources (Supplementary Table S1). All honeys, with the exception of two manuka honeys (Group C), were derived from Western Australian endemic flora. Floral sources were determined from jar labels or directly from the beekeeper. Floral sources were also investigated using high performance thin layer chromatography (HPTLC) analysis conducted as described previously (Locher et al. 2017, Locher et al. 2018, Islam et al. 2021). Briefly, extracts of aqueous honey solutions were obtained with dichloromethane and chromatographed on silica gel 60 F254 HPTLC plates using toluene, ethyl acetate, and formic acid (6:5:1, v/v) as mobile phases. The chromatographic images were analysed at 254 and 366 nm, then derivatized using vanillin spraying reagent and again analysed under white light at 366 nm. Images (or fingerprints) of different types of honey were then analysed visually. Based on the characteristic bands present in the HPTLC fingerprints, it was determined whether honeys were typical of a particular floral source or not or were from mixed floral sources. Floral sources for most honeys in Groups A and B were confirmed by HPTLC fingerprinting, as indicated in Supplementary Table S1. Group C honeys were not analysed by HPTLC fingerprinting as the reliability of HPTLC fingerprinting data for honeys that have been stored long-term has not yet been determined.
Storage conditions
Short-term storage (group A)
Samples of ∼15 g of each honey were dispensed into plastic tubes and sealed with sealing film, with one sample prepared for each time point and temperature. Samples were then stored at −80, −20, 4, ∼22 (ambient), 37, and 45°C. Samples were stored for 16 weeks and analysed at 0, 4, 8, 12, and 16 weeks, with the exception of −20 and −80°C, for which samples were examined at 0, 8, and 16 weeks only. Fewer time points were selected for frozen samples as these temperatures are not practically relevant to beekeepers and commercial honey storage. Samples stored at 22°C were re-examined at an additional time point of 48 weeks. At each sampling time, one tube of each honey was removed and analysed, and any honey remaining in that tube was discarded. This meant that multiple cycles of freezing and thawing, or heating and cooling for each of honey were avoided. All honeys were stored protected from light during the testing period.
Medium-term storage (group B)
Honeys stored medium-term (Group B) were selected from a historical collection of honeys obtained previously from 2017 to 2018. These honeys were stored under mixed temperature conditions: initially they were stored at ambient temperature (∼22°C) and then at 4°C. Unfortunately the length of time for which honeys were stored under each temperature was not recorded. Honeys were stored in plastic or glass jars and were protected from light at both storage temperatures.
Long-term storage (group C)
Group C honeys were identified from a second historical collection of honeys obtained from 2015 to 2017. These honeys were stored in plastic or glass jars at ambient temperature (∼22°C) and were protected from light during the entire storage period. The time elapsed between the initial (baseline) testing and repeat testing was five years.
Physicochemical parameters
Colour in milli-absorbance units (mAU) was determined by dissolving honey in distilled water (50% w/v) then passing through a 0.7 µm glass fibre filter to remove debris (Green et al. 2022). The optical density (OD) was measured at 450 and 720 nm, and the difference in OD measurements was multiplied by 1000 (Bogdanov et al. 1997). The pH of each honey was measured by dissolving 1 g of honey in 7.5 ml of carbon dioxide-free water (Bogdanov et al. 1997), then determining the pH with a calibrated pH metre. Brix values for neat honey were determined using a digital refractometer. Hydrogen peroxide levels were determined in 30% (w/v) solutions of honey in distilled water as described previously (Bang et al. 2003, Kwakman et al. 2011, Lehmann et al. 2019). Briefly, honey solutions were incubated at ∼22°C, and samples were analysed at 1, 2, 4, 6, and 24 h using o-dianisidine and horseradish peroxidase reagents. Levels of a hydrogen peroxide in honey samples were then determined from a standard curve (550–2.1 µM hydrogen peroxide).
For honeys in group C, minor changes to methodology were required to ensure that the data generated during the repeat testing were directly comparable to the data generated originally at baseline. Specifically, for colour determination, honey solutions were centrifuged for 1 min at 1500 rcf prior to determination of colour (instead of filtration), and hydrogen peroxide was determined for a solution of 25% (w/v) honey rather than a 30% (w/v) solution as was done for group A and B honeys. All measurements for all honeys were determined at least twice on different days, and mean values were calculated.
Antibacterial activity
MICs of each honey were determined against Staphylococcus aureus (ATCC 29213), Enterococcus faecalis (ATCC 29212), E. coli (ATCC 25922), and Pseudomonas aeruginosa (ATCC 27853) according to previously described methods (Green et al. 2020, Green et al. 2022). Total activity was determined using S. aureus (ATCC 25923) as described previously (Allen et al. 1991). All assays were conducted twice on different days and were repeated a third time if the initial results were not in agreement.
Statistical analyses
Data for group A (short-term study) honeys were statistically analysed as a single group rather than by individual floral source due to low numbers within each floral source group. For S. aureus and E. coli, a total of 10 honeys were analysed, and for E. faecalis and P. aeruginosa, there were a total of six honeys. MICs for each organism were analysed by two-way repeated measures ANOVA with multiple comparisons using the two-stage linear step-up procedure of Benjamini, Krieger, and Yekutieli. Hydrogen peroxide data for each honey were analysed by a two-way ANOVA mixed model with Dunnett’s multiple comparison test. Colour and pH were also analysed by two-way mixed model ANOVA with the two-stage linear step-up procedure of Benjamini, Krieger, and Yekutieli. For group B and group C honeys, paired data were analysed using paired t-tests (two-tailed, assuming equal variance). For the purposes of analyses, any off-scale MICs of >30% were allocated a value of 32%, any TA values of <7 were allocated a value of 6, and any hydrogen peroxide values of <10 were allocated a value of 9. All statistical analyses were performed using GraphPad Prism (version 9.3.1), with P < 0.05 considered significant.
Results
Short-term storage (16 weeks)
At baseline, MICs of the six Jarrah honeys ranged from 4% to 6.7% for S. aureus, 11% to 15% for E. faecalis, 8.7% to 12% for E. coli, and 7% to 9% for P. aeruginosa. For Marri honeys (n = 4), MICs ranged from 4% to 6% for S. aureus, 14% to 18% for E. faecalis, 10% to 14% for E. coli, and 8% to 10% for P. aeruginosa. Mean MICs are shown in Tables 1 and 2 to provide an overview of antibacterial activity rather than showing all MICs for each individual honey sample at each time point. Relatively minor changes in MICs were seen at ambient and below ambient temperatures over the 16 weeks (Tables 1 and 2), whereas larger changes in MICs were observed at above-ambient temperatures. Although statistical analysis of MIC data (described below) showed that some changes in MICs were statistically significant, it is important to note that many of these changes were relatively minor in magnitude. The largest changes in activity occurred after storage at 45°C, with changes in MIC exceeding 5% (w/v) after 12 weeks for S. aureus and E. coli and after 16 weeks for E. faecalis and P. aeruginosa. For the remaining storage conditions and time points, differences in MIC from baseline were of <5% w/v.
Antibacterial activity of honeys (n = 10) stored under short-term, controlled conditions against S. aureus (ATCC 29213) and E. coli (ATCC 25922).
| Organism and | Mean MIC ± standard deviation (% w/v) at each time point (weeks) | Mean change1 (range) | ||||||
|---|---|---|---|---|---|---|---|---|
| honey type | Temp. | 0 week | 4 weeks | 8 weeks | 12 weeks | 16 weeks | 8 weeks | 16 weeks |
| Staphylococcus aureus (ATCC 29213) | ||||||||
| Jarrah (n = 6) | −80°C | 5.1 ± 1.0 | – | 6.0 ± 1.6 | – | 6.5 ± 1.6 | −0.9 (0–2) | −1.4 (0–2.7) |
| −20°C | 5.1 ± 1.0 | – | 6.7 ± 1.9 | – | 6.7 ± 2.2 | −1.6 (0–2.7) | −1.6 (0–2.7) | |
| 4°C | 5.1 ± 1.0 | 4.4 ± 0.5 | 5.9 ± 1.5 | 6.1 ± 1.8 | 6.6 ± 2.1 | −0.8 (0–2) | −1.4 (0–2.7) | |
| 22°C | 5.1 ± 1.0 | 5.3 ± 1.7 | 6.2 ± 1.8 | 6.0 ± 2.2 | 6.7 ± 2.1 | −1.1 (0–2) | −1.6 (0–2.7) | |
| 37°C | 5.1 ± 1.0 | 6.2 ± 1.8 | 6.4 ± 1.9 | 6.9 ± 2.3 | 7.7 ± 2.5 | −1.3 (0–2.7) | −2.6 (0–4) | |
| 45°C | 5.1 ± 1.0 | 7.8 ± 2.9 | 8.7 ± 3.0 | 10.2 ± 1.9 | 12.0 ± 1.3 | −3.6 (0–5.3) | −6.9 (5.3–10) | |
| Marri (n = 4) | −80°C | 4.5 ± 1.0 | – | 4.3 ± 0.5 | – | 5.3 ± 1.5 | +0.2 (−1–2) | −0.8 (0–2) |
| −20°C | 4.5 ± 1.0 | – | 4.0 ± 0.0 | – | 5.0 ± 1.2 | +0.5 (−2–0) | −0.5 (0–2) | |
| 4°C | 4.5 ± 1.0 | 4.3 ± 0.5 | 4.0 ± 0.0 | 4.8 ± 1.0 | 5.3 ± 1.5 | +0.5 (−2–0) | −0.8 (0–2) | |
| 22°C | 4.5 ± 1.0 | 4.0 ± 0.0 | 4.0 ± 0.0 | 4.5 ± 0.6 | 4.5 ± 0.6 | +0.5 (−2–0) | 0.0 (−1–1) | |
| 37°C | 4.5 ± 1.0 | 4.0 ± 0.0 | 4.3 ± 0.5 | 5.5 ± 0.6 | 5.8 ± 1.3 | +0.2 (−1–0) | −1.3 (0–2) | |
| 45°C | 4.5 ± 1.0 | 5.5 ± 1.0 | 6.3 ± 1.5 | 10.3 ± 2.4 | 13.8 ± 4.6 | −1.8 (1–4) | −9.3 (4–14) | |
| Escherichia coli (ATCC 25922) | ||||||||
| Jarrah (n = 6) | −80°C | 9.9 ± 1.1 | – | 10.0 ± 0.8 | – | 11.0 ± 1.6 | −0.1 (−1–1) | −1.1 (0–3) |
| −20°C | 9.9 ± 1.1 | – | 10.4 ± 1.0 | – | 11.3 ± 1.8 | −0.5 (−1–2) | −1.4 (0.7–2) | |
| 4°C | 9.9 ± 1.1 | 10.2 ± 1.2 | 10.7 ± 1.3 | 10.3 ± 0.7 | 11.3 ± 1.5 | −0.8 (0–1.3) | −1.4 (0.7–2) | |
| 22°C | 9.9 ± 1.1 | 10.2 ± 1.2 | 10.3 ± 0.8 | 10.8 ± 0.7 | 11.4 ± 0.7 | −0.4 (0–1.3) | −1.6 (0–2.7) | |
| 37°C | 9.9 ± 1.1 | 10.7 ± 0.9 | 11.4 ± 0.5 | 12.1 ± 1.0 | 13.3 ± 1.0 | −1.5 (0–2.7) | −3.4 (2.7–4) | |
| 45°C | 9.9 ± 1.1 | 13.1 ± 0.8 | 13.6 ± 0.5 | 15.2 ± 1.2 | 17.5 ± 4.0 | −3.7 (2–4.7) | −7.6 (4.7–12) | |
| Marri (n = 4) | −80°C | 12.3 ± 1.7 | – | 11.5 ± 1.0 | – | 13.3 ± 2.4 | +0.8 (−2–1) | −1.0 (0–3) |
| −20°C | 12.3 ± 1.7 | – | 11.5 ± 1.0 | – | 12.8 ± 2.2 | +0.8 (−2–0) | −0.5 (−1–2) | |
| 4°C | 12.3 ± 1.7 | 12.0 ± 1.6 | 11.3 ± 1.0 | 13.3 ± 1.0 | 13.3 ± 1.5 | +1.0 (−3–0) | −1.0 (−1–2) | |
| 22°C | 12.3 ± 1.7 | 12.0 ± 1.4 | 11.5 ± 1.0 | 13.3 ± 1.0 | 13.3 ± 1.0 | +0.8 (−2–0) | −1.0 (−1–3) | |
| 37°C | 12.3 ± 1.7 | 12.3 ± 1.0 | 12.8 ± 1.5 | 13.8 ± 0.5 | 15.3 ± 1.5 | +0.5 (−1–2) | −3.0 (1–4) | |
| 45°C | 12.3 ± 1.7 | 13.8 ± 1.7 | 15.0 ± 1.2 | 18.5 ± 1.7 | 22.3 ± 2.6 | −2.7 (1–4) | −10.0 (7–12) | |
A negative value denotes a loss of antibacterial activity compared to baseline and positive indicates a gain.
Antibacterial activity of honeys (n = 6) stored under short-term, controlled conditions against E. faecalis (ATCC 29212) and P. aeruginosa (ATCC 27853).
| Mean MIC (% w/v) | Mean change1 (range) | |||
|---|---|---|---|---|
| Organism | Temp. | 0 week | 16 weeks | 16 weeks |
| Enterococcus faecalis | −80°C | 14.8 ± 1.6 | 18.0 ± 3.4 | −3.2 (0–7) |
| (ATCC 29212) | −20°C | 14.8 ± 1.6 | 17.2 ± 3.1 | −2.4 (0–6) |
| 4°C | 14.8 ± 1.6 | 18.3 ± 2.6 | −3.5 (2–7) | |
| 22°C | 14.8 ± 1.6 | 17.2 ± 2.9 | −2.4 (0–8) | |
| 37°C | 14.8 ± 1.6 | 19.0 ± 3.0 | −4.2 (1–7) | |
| 45°C | 14.8 ± 1.6 | 30.0 ± 1.8 | −15.2 (14–17) | |
| Pseudomonas aeruginosa | −80°C | 9.0 ± 1.1 | 11.0 ± 1.5 | −2.0 (0–4) |
| (ATCC 27853) | −20°C | 9.0 ± 1.1 | 10.7 ± 1.2 | −1.7 (0–3) |
| 4°C | 9.0 ± 1.1 | 10.8 ± 1.2 | −1.8 (1–3) | |
| 22°C | 9.0 ± 1.1 | 10.3 ± 1.2 | −1.3 (0–3) | |
| 37°C | 9.0 ± 1.1 | 12.2 ± 1.9 | −3.2 (1–5) | |
| 45°C | 9.0 ± 1.1 | 17.3 ± 2.7 | −8.3 (5–11) | |
The six honeys included two Jarrah honeys (JAR-A5, JAR-A6) and four Marri honeys (MAR-A1, A2, A3, and A4). 1A negative value denotes a loss of antibacterial activity compared to baseline and positive indicates a gain
Statistical analysis of MICs by ANOVA showed that time and temperature were both significant sources of variation for each of the four test organisms. Post-hoc statistical comparisons showed that for S. aureus, MICs at −20, −80, 4, and 22°C did not differ significantly over the 16-week period, whereas at 37°C, MICs differed significantly from baseline from week 8 onwards and at 45°C from week 4 onwards. For E. coli, MICs at −20, −80, 4, and 22°C differed significantly from baseline at 16 weeks; however, changes were relatively minor and ranged from −0.5% to 1.6% (w/v) honey. At 37 and 45°C, MICs differed significantly from baseline from week 4 onwards. For E. faecalis and P. aeruginosa, MICs at 16 weeks differed significantly from baseline for every storage temperature, including ambient.
Re-testing of honeys stored at ambient temperature for 48 weeks showed mean S. aureus MICs of 4.0 (± 0.0)% for Jarrah honeys and 4.5 (± 1.2)% for Marri honeys, and for E. coli, the mean MICs were 10.0 (± 2.0)% for Jarrah honeys and 14.0 (± 1.4)% for Marri honeys. These values did not differ significantly from baseline for either S. aureus (P = 0.277) or E. coli (P = 0.1169) using paired two-tailed t tests. For E. faecalis and P. aeruginosa, mean MICs for the six honeys (two Jarrah and four Marri) after 48 weeks were 18.8 (± 3.9)% for E. faecalis and 11.2 (± 1.0)% for P. aeruginosa, with both differing significantly from baseline (E. faecalis: P = 0.0282; P. aeruginosa: P = 0.0128).
The colour of each type of honey (0–16 weeks) is shown in Table 3. Time and temperature were both statistically significant factors when colour was analysed by mixed-model ANOVA. Post-hoc tests showed that from 4 weeks onwards, the colour of honey samples stored at 45°C differed significantly from baseline. At 12 weeks, the colour of honey samples stored at 22, 37, and 45°C differed significantly from baseline, and at 16 weeks, data from all temperatures differed significantly from baseline. Colour at 16 weeks differed by <10% compared to baseline, with the exception of 37 and 45°C, for which relative changes were substantially larger. After 48 weeks at ambient temperature, the mean colour was 381 mAU for Jarrah honeys and 308 mAU for Marri honeys, neither of which differed significantly from baseline data.
Mean colour and pH of honeys stored under short-term, controlled conditions.
| Parameter and honey type | Time point (weeks) | Change1 16 weeks | |||||
|---|---|---|---|---|---|---|---|
| Temp. (°C) | 0 week | 4 weeks | 8 weeks | 12 weeks | 16 weeks | ||
| pH | |||||||
| Jarrah (n = 6) | −80°C | 5.48 ± 0.56 | – | 5.41 ± 0.55 | – | 5.43 ± 0.55 | −0.05 |
| −20°C | 5.48 ± 0.56 | – | 5.49 ± 0.63 | – | 5.54 ± 0.64 | +0.05 | |
| 4°C | 5.48 ± 0.56 | 5.47 ± 0.54 | 5.48 ± 0.61 | 5.54 ± 0.64 | 5.55 ± 0.61 | +0.07 | |
| 22°C | 5.48 ± 0.56 | 5.44 ± 0.52 | 5.34 ± 0.50 | 5.26 ± 0.42 | 5.14 ± 0.43 | −0.34 | |
| 37°C | 5.48 ± 0.56 | 5.02 ± 0.24 | 4.85 ± 0.15 | 4.72 ± 0.13 | 4.64 ± 0.10 | −0.84 | |
| 45°C | 5.48 ± 0.56 | 4.86 ± 0.13 | 4.70 ± 0.08 | 4.67 ± 0.08 | 4.59 ± 0.07 | −0.89 | |
| Marri (n = 4) | −80°C | 4.52 ± 0.16 | – | 4.51 ± 0.14 | – | 4.48 ± 0.14 | −0.04 |
| −20°C | 4.52 ± 0.16 | – | 4.49 ± 0.18 | – | 4.47 ± 0.13 | −0.05 | |
| 4°C | 4.52 ± 0.16 | 4.49 ± 0.13 | 4.46 ± 0.17 | 4.51 ± 0.13 | 4.46 ± 0.12 | −0.06 | |
| 22°C | 4.52 ± 0.16 | 4.46 ± 0.09 | 4.45 ± 0.16 | 4.51 ± 0.14 | 4.45 ± 0.17 | −0.07 | |
| 37°C | 4.52 ± 0.16 | 4.46 ± 0.10 | 4.42 ± 0.16 | 4.45 ± 0.12 | 4.39 ± 0.13 | −0.13 | |
| 45°C | 4.52 ± 0.16 | 4.45 ± 0.11 | 4.43 ± 0.16 | 4.42 ± 0.10 | 4.39 ± 0.09 | −0.13 | |
| Colour (mAU) | |||||||
| Jarrah (n = 6) | −80°C | 368 ± 49 | – | 336 ± 56 | – | 353 ± 41 | −15 |
| −20°C | 368 ± 49 | – | 340 ± 62 | – | 352 ± 42 | −14 | |
| 4°C | 368 ± 49 | 364 ± 50 | 366 ± 48 | 359 ± 52 | 348 ± 42 | −20 | |
| 22°C | 368 ± 49 | 359 ± 48 | 365 ± 46 | 366 ± 44 | 349 ± 34 | −19 | |
| 37°C | 368 ± 49 | 367 ± 34 | 415 ± 43 | 466 ± 56 | 538 ± 64 | +170 | |
| 45°C | 368 ± 49 | 524 ± 69 | 844 ± 157 | 1298 ± 295 | 1825 ± 370 | +1457 | |
| Marri (n = 4) 2 | −80°C | 253 ± 138 | – | 267 ± 143 | – | 257 ± 138 | +4 |
| −20°C | 253 ± 138 | – | 268 ± 138 | – | 258 ± 137 | +5 | |
| 4°C | 253 ± 138 | 260 ± 142 | 262 ± 141 | 255 ± 140 | 257 ± 135 | +4 | |
| 22°C | 253 ± 138 | 264 ± 141 | 274 ± 143 | 269 ± 147 | 272 ± 146 | +19 | |
| 37°C | 253 ± 138 | 306 ± 170 | 376 ± 218 | 439 ± 256 | 514 ± 294 | +261 | |
| 45°C | 253 ± 138 | 467 ± 271 | 794 ± 390 | 1207 ± 470 | 1760 ± 632 | +1507 | |
A negative value indicates a decrease compared to baseline.
Samples differed widely in baseline colour values (147, 165, 248, and 449 mAU), which explains the standard deviation.
For pH, data are shown in Table 3, and furthermore, honeys (n = 10) stored at ambient temperature (22°C) and re-tested after 48 weeks had mean pH values of 5.22 for Jarrah honeys and 4.44 for Marri honeys. Time and temperature were both sources of statistically significant variation, and significant differences in pH from baseline were observed from 4 weeks onwards at 37 and 45°C and at ambient temperature from 8 weeks onwards, with the exception of 48 weeks, for which pH did not differ significantly from baseline. There were no significant changes in pH at 4, −20, or −80°C.
The mean Brix value for all 10 honeys was 83.10 (± 0.900 standard deviation) at baseline, and values at 16 weeks were 82.72, 83.40, 83.79, 82.60, 82.79, and 82.72 for 22, 37, 45, 4, −20, and −80°C, respectively. Statistical analysis of Brix data from all time points and temperatures showed no significant differences. This indicated that no significant water loss occurred under any of the conditions.
Hydrogen peroxide production within a solution of honey has been shown to vary over time (Bang et al. 2003, Lehmann et al. 2019), meaning that it is highly desirable to measure it at multiple time points per honey sample. Examination of baseline hydrogen peroxide production in the 10 honey samples revealed two distinct trends. For three honeys (JAR-A1, A3, and A4), maximal hydrogen peroxide was produced at 24 h, whereas for the remaining seven honeys, the highest levels were produced at 6 h and by 24 h had declined (Supplementary Fig. S1). Therefore, the time point at which maximal hydrogen peroxide was produced (either 6 or 24 h) was selected for subsequent statistical analysis. Honeys (n = 3) that produced <300 mM at any time point at baseline were not analysed due to data variability. Data for the remaining honeys are shown in Fig. 1. At 45°C, levels of hydrogen peroxide had declined to negligible levels by 8 weeks for all honeys. A similar but slower decline in hydrogen production was seen after storage at 37°C. In addition, levels of hydrogen peroxide for honeys stored at 22°C and re-tested at 48 weeks were 324, 1082, and 16 (at the maximum time point of 24 h) for honeys JAR-A1, JAR-A3, and JAR-A4, and were 174, 239, 178, and <10, respectively, for honeys JAR-A5, JAR-A6, Mar-A1, and MAR-A4 at their maximal time point of 6 h.
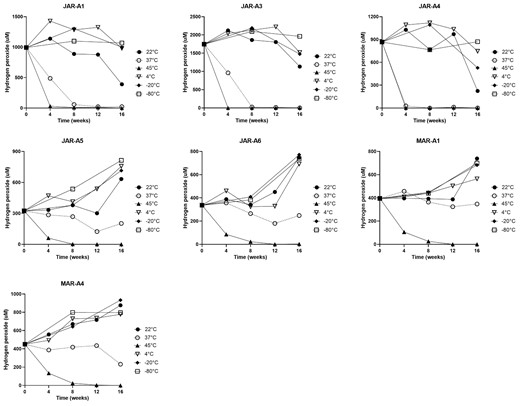
Levels of hydrogen peroxide in honey stored for 16 weeks at several temperatures, including ambient (22), 37, 45°C, and at 4, −20, and −80°C.
Analysis of hydrogen peroxide values by mixed model ANOVA showed that temperature was a significant source of variation for all honeys, whereas storage time was a significant factor for only three honeys. Hydrogen peroxide levels after storage at 22°C differed significantly from baseline for one honey (JAR-A4) at 8 weeks and for four honeys (JAR-A3, A4, A5, and A6) at 16 weeks. Storage at 37 and 45°C both resulted in substantial decreases in hydrogen peroxide. After storage at 37°C, hydrogen peroxide differed significantly from baseline for two honeys from 4 weeks onward and for a third honey from 8 weeks onward. At 45°C, hydrogen peroxide in all honeys differed significantly from baseline at 4, 8, and 12 weeks, whereas at 16 weeks, values for only five honeys differed significantly. Storage at 4, −20, and −80°C resulted in few significant changes in hydrogen peroxide, with JAR-A5 stored for 16 weeks at both 4 and −80°C being the only samples to differ significantly from baseline.
Medium-term storage (16–32 months)
Antibacterial activity, colour, and pH data for honeys stored for the medium-term at 22/4°C are shown in Table 4. For MICs, almost all differences in MIC were <5% (w/v), the exception being MICs of one of the Marri honeys against E. faecalis, where there was an apparent increase in activity of 7% (w/v). Paired t-tests of MICs for each organism, and of TA values showed no significant differences in data obtained at baseline and after storage. Interestingly, Karri honey showed an apparent change in activity using the TA test, but in contrast, the MICs of Karri honey against all organisms remained practically unchanged.
Antibacterial activity and colour of honeys (n = 12) after medium-term (16–32 months) storage at ambient temperature (∼22°C) and 4°C.
| MICs (% w/v honey) | ||||||||||||||||||||||
|---|---|---|---|---|---|---|---|---|---|---|---|---|---|---|---|---|---|---|---|---|---|---|
| Storage (months) | Staphylococcus aureus (ATCC 29213) | Enterococcus faecalis (ATCC 29212) | Escherichia coli (ATCC 25922) | Pseudomonas aeruginosa (ATCC 27853) | Total activity | Colour (mAU) | pH | |||||||||||||||
| Honey | Tx | T0 | Tx | Δ | T0 | Tx | Δ | T0 | Tx | Δ | T0 | Tx | Δ | T0 | Tx | Δ | T0 | Tx | Δ | T0 | Tx | Δ |
| BLC-B1 | 30 | 12 | 14 | −2 | 30 | 30 | 0 | 28 | 27 | +1 | 13 | 17 | −4 | 21 | 27 | +6 | 241 | 260 | +19 | 4.89 | 4.70 | −0.19 |
| BLF-B1 | 16 | 4 | 4 | 0 | 16 | 18 | −2 | 12 | 10 | +2 | 9 | 9 | 0 | 31 | 34 | +3 | 436 | 497 | +61 | 5.27 | 5.18 | −0.09 |
| JAR-B1 | 22 | 5 | 5 | 0 | 16 | 20 | −4 | 10 | 11 | −1 | 8 | 9 | −1 | 27 | 32 | +5 | 279 | 411 | +132 | 4.84 | 4.73 | −0.12 |
| JAR-B2 | 18 | 4 | 5 | −1 | 21 | 21 | 0 | 8 | 10 | −2 | 8 | 11 | −3 | 31 | 26 | −5 | 350 | 507 | +157 | 5.24 | 4.86 | −0.39 |
| KAR-B1 | 32 | 10 | 6 | +4 | 23 | 22 | +1 | 14 | 14 | 0 | 15 | 12 | +3 | 40 | 24 | +16 | 205 | 263 | +58 | 4.76 | 4.67 | −0.09 |
| MAR-B1 | 25 | 5 | 6 | −1 | 30 | 30 | 0 | 16 | 16 | 0 | 12 | 13 | −1 | 22 | 21 | −1 | 177 | 227 | +50 | 4.72 | 4.56 | −0.17 |
| MAR-B2 | 25 | 5 | 4 | +1 | 26 | 17 | +7 | 14 | 12 | +2 | 10 | 10 | 0 | 22 | 29 | −7 | 189 | 282 | +93 | 4.46 | 4.41 | −0.06 |
| PAR-B1 | 23 | 9 | 11 | −2 | >30 | >30 | – | 18 | 18 | 0 | 16 | 16 | 0 | 13 | <7 | −6 | 190 | 342 | +152 | 4.99 | 4.75 | −0.25 |
| RED-B1 | 23 | 5 | 6 | −1 | 24 | 24 | 0 | 11 | 14 | −3 | 11 | 11 | 0 | 21 | 23 | +2 | 465 | 585 | +120 | 4.48 | 4.31 | −0.17 |
| WAN-B1 | 32 | 3 | 5 | −2 | 13 | 16 | −3 | 12 | 9 | +3 | 8 | 8 | 0 | 54 | 44 | −10 | 174 | 224 | +50 | 4.52 | 4.45 | −0.07 |
| WAN-B2 | 31 | 5 | 3 | +2 | 23 | 19 | +4 | 14 | 12 | +2 | 10 | 10 | 0 | 23 | 31 | −8 | 185 | 231 | +46 | 4.61 | 4.51 | −0.10 |
| WAN-B3 | 23 | 5 | 7 | −2 | 28 | 29 | −1 | 13 | 16 | −3 | 11 | 13 | −2 | 17 | 19 | −2 | 156 | 214 | +58 | 4.73 | 4.59 | −0.15 |
| Mean | 25 | 6.0 | 6.3 | -0.3 | 22.7 | 22.4 | 0.2 | 14.2 | 14.1 | 0.1 | 10.9 | 11.6 | -0.7 | 27 | 28 | -0.6 | 254 | 337 | +83 | 4.79 | 4.64 | -0.15 |
For the purposes of calculations, MICs of >30 were given a value of 32, and TA values of <7 were given a value of 6. BLC Blackbutt (Coastal); BLF Blackbutt (Forest); JAR Jarrah; KAR Karri; MAR Marri; PAR Parrot bush (Banksia); RED Red Bell; WAN Wandoo.
Significant increases in colour after storage were observed, and changes in pH also differed significantly (paired t-tests; P < 0.0001). For hydrogen peroxide (Fig. 2), eight of the 12 honeys showed no significant differences between time points, whereas differences for the remaining four honeys (JAR-B1, JAR-B2, MAR-B2, and WAN-B1) were significant (P < 0.05).
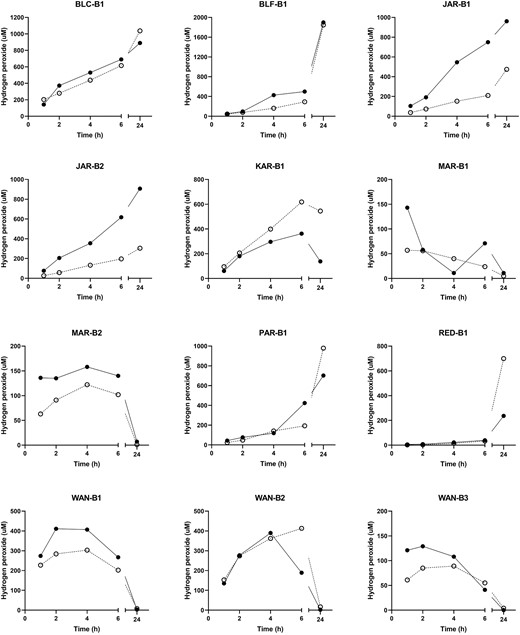
Levels of hydrogen peroxide in honey samples stored for 16–32 months at ambient temperature then at 4°C. The solid line shows baseline (t = 0) levels, and the dashed line shows levels after re-testing. Significant differences between baseline and re-testing were seen for honeys JAR-B1, JAR-B2, MAR-B2, and WAN-B1.
Long-term storage (5 years)
Several important changes were observed in honeys stored long-term at ambient temperature (Table 5). Overall, MICs for S. aureus differed significantly between time points by paired t-test (P = 0.025), and for seven of the honeys, changes in MIC from baseline exceeded 10% (w/v). For one honey, this was a loss of activity, whereas for the remaining six honeys, there was an increase in activity. TA values also differed significantly (P = 0.0008) and showed an overall trend of a loss of activity with the exception of honey WAN-C3, which showed a minor increase. Most of the honeys that showed an increase in activity by the MIC test showed no corresponding increase in activity by the TA test, suggesting a lack of correlation between the tests. Honeys were all substantially darker, and hydrogen peroxide levels were lower after storage and relative to baseline values, and both differed significantly (P < 0.0001).
Antibacterial activity, colour, and hydrogen peroxide content of honeys (n = 17) stored long-term (5 years) at ambient temperature.
| Staphylococcus aureus (ATCC 25923)MIC (% w/v) | Total activity | Colour (mAU) | Hydrogen peroxide1 (µM) | ||||||||||
|---|---|---|---|---|---|---|---|---|---|---|---|---|---|
| Honey | T0 | T5 | Change | T0 | T5 | Change | T0 | T5 | -fold change | Tmax (h) | T0 | T5 | Change |
| BAN-C1 | 8 | 21 | −13 | 11 | <7 | −5 | 249 | 470 | 1.9 | 2 | 205 | <10 | −195 |
| BOT-C1 | 8 | 6 | +2 | 18 | 10 | −8 | 621 | 1323 | 2.1 | 4 | 310 | <10 | −300 |
| HEA-C1 | >30 | 10 | +22 | 13 | <7 | −7 | 114 | 299 | 2.6 | 2 | 267 | 39 | −228 |
| JAR-C1 | 6 | 8 | −2 | 18 | <7 | −12 | 693 | 1420 | 2.0 | 4 | 130 | <10 | −120 |
| JAR-C2 | 10 | 8 | +2 | 13 | <7 | −7 | 597 | 1259 | 2.1 | 2 | 93 | <10 | −83 |
| JAR-C3 | 6 | 6 | 0 | 22 | <7 | −16 | 562 | 1256 | 2.2 | 4 | 306 | <10 | −296 |
| JAR-C4 | 24 | 20 | +4 | <7 | <7 | – | 675 | 1620 | 2.4 | 2 | 56 | <10 | −46 |
| JAR-C5 | 6 | 4 | +2 | 29 | 18 | −12 | 341 | 820 | 2.4 | 2 | 321 | <10 | −311 |
| MAN-C1 | 6 | 6 | 0 | 19 | 18 | −2 | 893 | 2036 | 2.3 | 4 | 45 | <10 | −35 |
| MAN-C2 | 6 | 7 | −1 | 18 | 15 | −4 | 956 | 2063 | 2.2 | 4 | 44 | <10 | −34 |
| MAR-C1 | 20 | 6 | +14 | <7 | <7 | – | 429 | 992 | 2.3 | 2 | 33 | <10 | −23 |
| MAR-C2 | 4 | 4 | 0 | 33 | 21 | −13 | 357 | 862 | 2.4 | 4 | 330 | 15 | −315 |
| RIV-C1 | 22 | 9 | +13 | 11 | <7 | −5 | 223 | 512 | 2.3 | 2 | 238 | <10 | −228 |
| WAN-C1 | >30 | 10 | +22 | <7 | <7 | – | 452 | 1264 | 2.8 | 2 | 44 | <10 | −34 |
| WAN-C2 | 6 | 6 | 0 | 23 | 14 | −10 | 271 | 518 | 1.9 | 2 | 258 | 13 | −245 |
| WAN-C3 | 22 | 4 | +18 | 11 | 14 | +3 | 360 | 701 | 1.9 | 2 | 52 | <10 | −42 |
| WIL-C1 | >30 | 11 | +19 | <7 | <7 | – | 275 | 674 | 2.5 | 2 | 49 | <10 | −39 |
| Mean | 14.7 | 8.6 | 6.0 | 15.5 | 10.0 | -7.5 | 475 | 1064 | 2.3 | – | 163.6 | 12.2 | -151.4 |
For the purposes of calculations, MICs of >30 were given a value of 32, TA values of <7 were given a value of 6, and hydrogen peroxide values of <10 were given a value of 10. 1 Determined for a solution of 25% (w/v) honey. BAN Banksia; BOT Bottlebrush; HEA Coastal Heath; JAR Jarrah; MAN Manuka; MAR Marri; RIV River gum; WAN Wandoo; WIL Wildflower.
Discussion
This study found that the exposure of honeys to elevated temperatures is detrimental to antibacterial activity, and we also demonstrated that declines in activity were more pronounced at 45°C than at 37°C. Data also showed that the trends in loss of antibacterial activity were similar between bacterial test species and the two honey types. Several previous studies have investigated the effects of heat and storage on honeys, with many focusing on quality parameters such as diastase activity and HMF (Bertoncelj et al. 2005, Kedzierska-Matysek et al. 2016) and also antioxidant activity (Karabagias et al. 2018, Islam et al. 2022). Relatively few studies have investigated antimicrobial activity.
Comparison of antibacterial activity data to previous studies is limited by differences in storage conditions between studies, meaning that they are not directly comparable. Previous studies have tended to examine the effects of relatively high temperatures (60–80°C) and comparatively short exposure periods (minutes to hours) (Chen et al. 2012, Karabagias et al. 2018), as these relate directly to conditions used for the processing of commercial honeys. Comparisons are also limited by differences between antibacterial testing methods. A number of studies have utilized agar-well diffusion methods, which, whilst relatively easy to perform and high throughput, are considered to be semi-quantitative and do not necessarily provide a high level of discrimination. Also, high-molecular-weight compounds found in honey, such as melanoidins, may not diffuse through agar, leading to an underestimation of activity. In contrast, broth dilution methods provide quantitative results but can only provide sufficient discrimination if many different dilutions of honey are used. Doubling dilutions such as 6.25%, 12.5%, and 25% honey are unlikely to provide a sufficient level of discrimination.
Changes in the antibacterial activity of honey after exposure to heat have been shown to occur relatively quickly in several previous studies. For example, Majkut et al. (2021) found that exposing honeys to 42°C for 2 h decreased the antibacterial activity of multifloral, buckwheat, rapeseed, and lime honeys against one or more of the six test bacteria determined using a broth dilution assay. The largest changes were seen for two S. aureus strains, where minimum bactericidal concentrations (MBCs) for multifloral and lime honeys changed from ≤6.25% or 12.5% at baseline to 50% after heat treatment (Majkut et al. 2021). Similarly, Chen et al. (2012) exposed honeys to 45°C for 8 h and showed decreases in antibacterial activity for four samples of red stringybark (Eucalyptus macrorhyncha) honey using an agar-well diffusion assay. The mean zone of inhibition before heat treatment was 15.5 mm and was 11.3 mm afterwards (Chen et al. 2012). Another study exposed 30 samples of Eucalyptus honey to 45°C until thermal liquefaction was complete, which was on average 23 h (range 3.7–52 h) (Villacres-Granda et al. 2021). These heat-treated honeys showed a significant decrease in their capacity to inhibit biofilm formation by P. aeruginosa at concentrations of 5%, 10,% and 20% honey, compared to untreated honeys. In contrast, no change in anti-biofilm activity was observed after heat treatment against S. aureus at the same honey concentrations. A similar study investigated ten Slovakian rapeseed and wildflower honeys that were heated at 45, 55, and 65°C until liquefied (up to 120 h or 5 days) but found no significant changes in antibacterial activity against P. aeruginosa and against S. aureus no significant changes were observed for eight honeys, whereas significant increases in antibacterial activity were found for the remaining two honeys (Bucekova et al. 2018). Whilst these studies indicate that for some honeys, changes in antibacterial activity can occur relatively rapidly even at moderately elevated temperatures of 42–45°C, they also indicate that this is not a universal trend for all honeys and all bacteria and that further studies are required to understand the factors underlying the changes (or lack of changes) in antibacterial activity.
Examining the physicochemical data for heat-treated honeys may provide insight into the observed decline in antibacterial activity. Specifically, at 45°C, we showed that hydrogen peroxide was no longer detectable after 4 weeks, which likely impacted antibacterial activity. Hydrogen peroxide generation in honey is catalyzed by the enzyme glucose oxidase, although alternative pathways of hydrogen peroxide generation in honey have been suggested (Brudzynski 2020). There are therefore two possibilities: that the enzyme itself is adversely affected or that any hydrogen peroxide produced is inactivated within the honey matrix. Enzyme damage is unlikely, given that glucose oxidase is known to have high stability (Bauer et al. 2022) and has been shown to be largely unaffected at 45°C (Villacres-Granda et al. 2021), with temperatures of 55°C or higher required to elicit a decline in enzyme activity (Kretavicius et al. 2010). The other possibility is that phenolic compounds within the honey that have antioxidant activity react with and degrade the hydrogen peroxide almost as soon as it is produced (Guttentag et al. 2021). This explanation is supported by several studies showing that the antioxidant activity of honey increases with exposure to heat (Kuś et al. 2016, Karabagias et al. 2018, Molaveisi et al. 2019). The increased antioxidant capacity of some honeys after exposure to heat or after long-term storage may therefore explain the corresponding decline in hydrogen peroxide levels.
Physicochemical factors other than hydrogen peroxide may help to explain the continued decline in antibacterial activity beyond the initial four weeks. Honey colour is well-known to change over time or upon exposure to heat (Gonzales et al. 1999, Kedzierska-Matysek et al. 2016). The darkening of honey is proposed to be due to the degradation of phenolic compounds (Bulut and Kilic 2009) and the formation of Maillard reaction products, which form as a result of sugars reacting with amino acids (in early stage Maillard reactions), leading to the formation of compounds such as HMF (an advanced reaction product) and eventually melanoidins (final reaction products). The darkening of honey occurs naturally via these non-enzymatic mechanisms at ambient temperatures and is accelerated by heating (Brudzynski and Miotto 2011 ). It is thought that the formation of these compounds essentially ‘sequesters’ antimicrobial polyphenols and proteins, reducing their availability to interact with bacterial cells and contributing to a decrease in antibacterial activity (Brudzynski and Miotto 2011). It is the formation of these products that also contributes to the increase in antioxidant activity of some honeys.
We also observed significant decreases in the pH of honey over time at several storage temperatures, which has also been shown previously by others (Castro-Vazquez et al. 2012, Kedzierska-Matysek et al. 2016). It is possible that this may occur as a result of complex changes in honey composition over time, including reductions in glucose and fructose content and the associated increase in di- and oligosaccharides (White et al. 1961). The relationship between declining honey pH and antibacterial activity remains unclear. Since most bacteria prefer a near-neutral pH, it could be hypothesized that an increase in acidity (or decrease in pH) would result in greater inhibition of bacterial growth, which was paradoxically not seen. It is also possible that the decline in pH was too small to have an observable effect on antibacterial activity.
Whilst only a few physicochemical parameters were quantified in the current study, other studies examining the effect of mild heating (40–45°C) on honey parameters have shown changes in pH, electrical conductivity, and colour in several Greek honeys after heating for 30 min (Karabagias et al. 2018) and increases in antioxidant activity, brown pigment, and total phenolic content after heating Iranian jujube honeys for 10 days at 45 and 55°C (Molaveisi et al. 2019). Importantly, a recent study showed that Western Australian honeys stored at 40°C had levels of HMF exceeding 80 mg/kg after two months for a Marri honey and after four months for a peppermint (Agonis flexuosa) honey (Islam et al. 2022). These data demonstrate that changes in chemical characteristics can occur over a short time frames and, in turn, may potentially affect antibacterial activity and honey quality.
The discussion has so far focused on changes in honey samples that occurred at 45°C, as these were the most pronounced. However, we also observed changes in honey characteristics at 37°C, although not to the same extent as at 45°C. It is likely that the underlying chemical changes that were occurring at 45°C were also occurring at 37°C and potentially also at 22°C, albeit at much slower rates, since many of the processes described above are accelerated by heating (Bulut and Kilic 2009, Brudzynski and Miotto 2011). For example, differences in the decline in diastase activity have been noted, with the decline being most rapid at 35°C, followed by 25°C, then 4°C (Chou et al. 2020).
The relatively slow rate of change at ambient temperatures hypothesized above is supported by our observations that negligible changes in the antibacterial activity of the Jarrah and Marri honey types occurred over the 16 weeks, and re-testing at 48 weeks (∼11 months) also did not show any substantial loss of antibacterial activity. In a study assessing similar time frames and temperatures, Brudzynski et al. (2011) showed that the antibacterial activity of three honeys stored for three months in the dark at room temperature was unchanged for E. coli, with all MICs remaining at 6.25%, whereas for B. subtilis, MICs for two honeys were unchanged from baseline (at 12.5%), and for the third honey (light buckwheat), the MIC had changed to 25%. Testing at further time points showed that MICs for E. coli for all honeys decreased to 12.5% after both 6 and 12 months of honey storage. For B. subtilis, no further changes in MICs were seen at 6 or 12 months. With regard to physiochemical changes, we showed relatively minor changes in colour and pH of honeys stored at ambient temperature, whereas hydrogen peroxide data was more variable. Similarly, increases in colour and UV-absorbing materials in honeys stored for two years at room temperature have been noted (Brudzynski and Kim 2011), as has an increase in free acidity and HMF accompanied by decreases in pH and diastase activity in canola (Brassica napus) honeys stored at room temperature for 18 months (Kedzierska-Matysek et al. 2016). These data indicate that although numerous physicochemical changes are occurring in honey at ambient temperatures, the impact on antibacterial activity over a time frame of about 12 months appears to be relatively minor.
In contrast, different honeys stored for five years at ambient temperature showed a range of changes in antibacterial activity, some of which were quite substantial. Antibacterial activity was either substantially increased, decreased, or unchanged. However, less variation between honeys was seen for changes to physicochemical attributes. For example, hydrogen peroxide generation was uniformly almost completely absent, and all honeys were substantially darker compared to baseline. This suggests that all honeys have undergone similar physicochemical changes over the storage period and that all have likely formed melanoidins via Maillard reactions. The variation in antibacterial activity may therefore be due to variation in the different types of melanoidins formed in the individual honeys, as the antibacterial activity of different melanoidin compounds is known to vary considerably (Kukuminato et al. 2021). In addition, most honeys that showed a substantial increase in activity by the broth dilution method did not show a corresponding increase in activity by the agar-well diffusion (phenol equivalence) assay. This may have occurred because the high-molecular-weight antibacterial melanoidins formed during storage were unable to diffuse through the agar and were therefore unable to inhibit bacterial growth.
At temperatures below ambient (4, −20, and −80°C), we observed only minor changes in antibacterial activity, pH, and colour of honeys over the 16 weeks, and hydrogen peroxide levels did not decline, although results for the latter varied between honeys. Data from the group B honeys represent a combination of effects that occur at ambient temperature and at 4°C. These honeys had moderate increases in colour, decreases in pH, and losses of hydrogen peroxide, but relatively minor changes in antibacterial activity. These changes could potentially have occurred whilst honeys were stored at ambient temperature, and then the changes would have slowed considerably when storage conditions were changed to 4°C. These results suggest that the cold temperatures markedly slowed chemical reactions or interactions and that the different honeys had become largely inert. Decreases in antibacterial activity at cold temperatures have been shown previously by Kus et al. (2016), who stored 50% solutions of nine Polish and two manuka honeys at 4°C for 4 weeks and tested for activity against S. aureus by broth dilution. No changes in activity were found for three of the Polish honeys and the two manuka honeys. Decreases in activity were observed for the remaining six Polish honeys, with decreased activity after two weeks for three of the honeys (MICs changed from 3.12% to 6.25%) and after four weeks for the remaining three honeys (MICs changed from 6.25% to 12.5%) (Kuś et al. 2016). Loss of antibacterial activity may have occurred due to honeys being stored as 50% solutions rather than neat honeys, as this is likely to have impacted the underlying chemical dynamics. Changes in honey chemistry at cold and ultra-cold temperatures have also been reported previously. For example, after storage of seven canola (B. napus) honey samples at −20°C for 18 months, the mean pH decreased from 4.20 to 3.93, and there were also minor decreases in diastase activity and HMF (Kedzierska-Matysek et al. 2016). In that study, the honeys increased in colour from 417 mAU at baseline to 476 mAU after 18 months at −20°C, whereas after 18 months at ambient temperature, the mean colour had increased to 662 mAU (Kedzierska-Matysek et al. 2016). These data indicate that changes in honey do not completely cease at cold temperatures and still occur, albeit slowly. Whilst cold temperatures may be beneficial for stabilizing the honeys, they are also somewhat impractical due to the large volumes of honey that may require storage and the crystallization of honey at cooler temperatures, which is considered undesirable by consumers (Hunter et al. 2021).
In summary, these antibacterial and physicochemical data indicate that honeys are relatively stable at cold temperatures and also at ambient temperatures over ∼12 months, but that between one and five years, a range of changes may occur that result in profound changes in the honey’s characteristics. Exposure to or storage at elevated temperatures may be tolerable for short periods if unavoidable, but longer periods and temperatures of 45°C are to be avoided. For some of the characteristics measured after storage or heat treatment of honey, such as HMF, diastase, and free acid, quality control reference ranges are available, meaning that it is possible to determine whether the quality of honey is no longer acceptable after storage or treatment. For other characteristics, such as antibacterial activity, no such guidelines exist. It is therefore difficult to determine the implications of these losses in antibacterial activity. This is further complicated by the absence of a scientifically established relationship between the antibacterial activity that honey demonstrated in vitro and the therapeutic benefits shown in vivo, such as the speed of wound healing. Thus, the biological, clinical, and therapeutic relevance of losses of antibacterial activity in honey are currently unknown.
Acknowledgement
The authors acknowledge the traditional custodians of the lands, the Noongar people, on which this research was conducted and from which these honeys were collected. We recognize their continued connection to country and pay respects to their elders past, present and future.
The authors thank Western Australian beekeepers for providing many of the honeys examined in this study.
Conflict of interest
The authors have no conflicts of interest to declare.
Funding
This research was funded by the Cooperative Research Centre for Honey Bee Products (CRC HBP) (Grant PRJ-12).
Author contributions
Zachary J. M. Jones (Data curation, Formal analysis, Investigation, Writing—review & editing), Yina Huang (Investigation, Writing—review & editing), Kathryn J. Green (Data curation, Formal analysis, Investigation, Writing—review & editing), and Katherine A. Hammer (Conceptualization, Formal analysis, Funding acquisition, Project administration, Supervision, Writing—original draft, Writing—review & editing)
Data Availability
The data underlying this article are available in the article and in its online supplementary material.
