


Abstract
Next-generation sequencing (NGS)-based genomic profiling is becoming widespread in determining treatment policies for patients with tumors. Commercially available gene panels for pan-tumor targets comprise hundreds of tumor-related genes but frequently lack genes of interest in specific tumor types. In this study, we demonstrate a method for extending target regions of genomic profiling by combining a custom probe pool with a commercial targeted panel.
We used TruSight Oncology 500 (TSO500) as a commercial targeted panel and a custom probe pool designed for all exons of the SMARCA2 gene. Sequencing libraries of custom targets were constructed using a portion of the TSO500 library solution before the hybridization-capture process. After hybridization capture, both libraries were combined and sequenced using a next-generation sequencer.
Sequencing results showed that >96.8% and 100% of the target exons were covered at a depth of over 100× using the TSO500 and custom panels, respectively. The custom panels had slightly better median exon coverage than the TSO500. The combined libraries of the custom and TSO500 panels showed a mapped read ratio close to the mixing ratio. Analysis of mutation-free regions showed similar accuracies between the TSO500 and custom panels regarding variant calling.
Our devised method easily and affordably extends the targets beyond a ready-made panel. This method provides a valuable solution until the widespread adoption of whole-exome sequencing, which is costly for large target sizes.
This study demonstrates a method for expanding target regions in genomic profiling of patients with tumors by combining a custom probe pool with a commercially available gene panel. The custom panel achieved excellent coverage of the target exons using a portion of the existing library solution. The hybridization-capture-based approach effectively maintained accurate variant calling between the 2 panels. This method provides a valuable solution for analyzing specific genes of interest in tumor types not covered by ready-made panels, offering an alternative until whole-exome sequencing becomes more widely accessible in clinical settings.
INTRODUCTION
Next-generation sequencing (NGS)-based genomic profiling is being used with increased frequency to establish treatment policies for patients with tumors (1–3). Several gene panels (e.g., Foundation Medicine’s FoundationOne CDx and Illumina’s TruSight Oncology 500, TSO500) targeting hundreds of gene regions are commercially accessible for pan-tumor research on common cancers, including lung, colon, and breast cancers. They comprise most of the tumor-related genes but frequently lack the genes of interest in specific tumor types (for example, rare tumors such as mesenchymal chondrosarcoma and lipoma). Therefore, a second panel analysis using a customized gene set is necessary for the unmounted genes, with additional sample materials to generate sequencing libraries.
Multiplexed amplicon-based (4) and hybridization-capture-based (5–7) approaches are available for target sequencing using gene panels. Both can target many areas simultaneously, but the latter can detect most variants (including novel genomic rearrangements, such as translocations) adjacent to the probes.
In the hybridization-capture-based method, a sequencing library is first prepared by combining sample materials (genomic DNA or cDNA synthesized from RNA) and adapter sequences of the NGS system, amplifying with adapter primers, and enriching targets by hybridization capture using pools of target probes (5–7). Before hybridization, the created library contains all genomic regions and can be used to select and enrich the target genomic sequences with probes other than ready-made ones in gene panel kits. Using a portion of the library, another enrichment process can easily extend the targeted loci; however, to our knowledge, such trials have not yet been conducted.
In this report, we demonstrate a hybridization-capture-based targeted sequencing method that combines a ready-made gene panel (Illumina TSO500) with a customized probe pool without the need for additional sample materials or library re-preparation (fragmentation, end-repair, and adapter ligation). Our technique can easily expand the number of loci analyzed.
MATERIALS AND METHODS
DNA Samples
DNA was extracted from 8 formalin-fixed, paraffin-embedded (FFPE) lung cancer tissue sections using the QIAamp DNA FFPE Advanced UNG Kit (Qiagen, Venlo, Netherlands). All methods were performed in accordance with relevant guidelines and regulations including the Declaration of Helsinki. The Ethics Committee of the Osaka International Cancer Institute approved this study, and informed consent was obtained from all patients (approval number 19205-3) (8).
Workflow of Our Method
Target-enriched fragments from the TSO500 and custom panels were combined and sequenced using NextSeq 550 (Illumina). Because reads from both panels had identical sample indices and unique molecular index (UMI) tag sequences, they were simultaneously analyzed using the TruSight Oncology 500 Analysis Module of the Local Run Manager (Illumina) and converted into a single BAM file per sample. The BAM files were then subjected to multiple processes, including read-collapsing (collapsing reads into representative sequences using UMI tags), alignment of collapsed reads to the reference genome, indel realignment, and read stitching (referring to the Local Run Manager TruSight Oncology 500 Analysis Module Workflow Guide) (9).
We used the variant caller, VarScan2 (10), to detect variants in the SMARCA2 region because the TSO500 module, which has a variant filtering technique that combines statistical modeling of error rates with database annotations (9), does not call variants for custom regions.
Preparation of Next-Generation Sequencing Library
The extracted DNA was sheared using a Covaris M220, microtube-50 AFA Fiber Screw-Cap, and M220 Holder XTU Insert microTUBE 50 μL (Covaris), according to the TruSight Tumor 170 DNA Shearing Quick Guide (Covaris), with slight modifications (repeat/iterations: 16). The sheared DNA was used to construct NGS libraries using the TSO 500 DNA Kit, according to the manufacturer’s instructions (document no. 1000000067621 v04, Illumina).
Preparation of Custom Probe Pool Libraries
A customized xGen Lockdown Probe Pool (SMARCA2 probe pool) was designed and synthesized for all protein-coding exons of the SMARCA2 gene using the Design tool (Integrated DNA Technologies [IDT]) (Supplemental Tables 1 and 2). The length of each probe was 120 bases. The probe concentration was 400 attomole/probe/μL. We excluded the (CAG)n repeat region in exon4 from the analysis because of the difficulty in probe designing. Ten microliters of the sample indexed libraries (the products before the first hybridization of TSO 500 libraries) were purified using 0.9× volume of AMPure XP (Beckman-Coulter) and then amplified using KAPA HiFi HS ReadyMix (KAPA Biosystems) and P5/P7 primers (P5: AAT GAT ACG GCG ACC GAG ATC TAC AC, P7: CAA GCA GAA GAC GGC ATA CGA GAT). The PCR reaction was carried out for 3 cycles in a 50 μL reaction volume. After cleaning with AMPure XP and measuring the concentration with Qubit dsDNA HS (Thermo Fisher Scientific), 8 libraries (each 500 ng) and 7.5 μL of Human Cot DNA (xGen Human Cot DNA, IDT) were combined and concentrated with AMPure XP. The libraries/Human Cot DNA mixture, 2 μL of blocking oligonucleotides (xGen Universal Blockers-TS Mix, IDT), 9.5 μL of xGen 2× Hybridization Buffer (IDT), 3 μL of xGen Hybridization Buffer Enhancer (IDT), and 4 μL of the SMARCA2 probe pool (described above) were pooled in 19 μL of solution. The first hybridization (14.5 h) with the SMARCA2 probe pool and washing were performed according to the IDT protocol (xGen hybridization capture of DNA libraries: for NGS target enrichment, document v.4). After washing, the product was amplified for 18 cycles in two 50-μL PCR reactions using the xGen Library Amplification Primer (IDT) and purified with 1.5× volume of AMPure XP. Next, the purified product (500 ng) was combined with Human Cot DNA and blocking oligonucleotides, and a second hybridization (4 h) with the SMARCA2 probe pool was performed. After washing, the final PCR reaction was carried out for 10 cycles and purified using 1.2× volume of AMPure XP.
Next-Generation Sequencing and Data Analysis
The 8 TSO500 libraries were diluted to 4 nM and pooled in equal volumes. The pooled TSO500, SMARCA2, and PhiX control libraries (Illumina) were then diluted to 1.2 pM and mixed in a 96:2:2 ratio. The mixed library was sequenced using the TSO 500 protocol on the NextSeq 550 instrument.
Raw sequencing data were automatically processed using the Local Run Manager TruSight Oncology 500 Analysis Module (Illumina) on a NextSeq 550 instrument. The module performs the following operations: quality control, generation of FASTQ files, alignment to the hg19 human reference genome, error collection using UMI tags, indel-realignment/read-stitching, variant calling, and calculation of microsatellite instability status/tumor mutation burden (Local Run Manager TruSight Oncology 500 Analysis Module Workflow Guide, document no. 10000000099600 v00, Illumina). Variants in the SMARCA2 gene region were not called; therefore, we extracted the region data (chr9:2,029,000-2,192,800) from BAM files located in the StitchedRealigned (final alignment files) folders in the TSO500 results directory using SAMtools and conducted variant calling with VarScan2 (10). The Integrative Genomics Viewer was used to visualize sequencing readings (11). The sequencing data are available from the corresponding author upon reasonable request.
Statistical Analysis
A two-sided t-test in Excel (Microsoft) was used to determine statistically significant differences. A P value <0.05 was considered statistically significant.
RESULTS
Targeted Sequencing that Combines a Ready-Made Gene Panel with a Customized Probe Pool
To demonstrate our devised approach (Fig. 1 and the workflow in the Methods section), we designed and synthesized 59 custom DNA oligonucleotide probes corresponding to 36 coding regions of the SMARCA2 exons (Supplemental Tables 1 and 2). As shown in Table 1, we obtained 100–140 million reads, more than 98.5% of which mapped to the genome. Over 96.8% and 100% of the target exons were covered at >100× depth on the TSO500 and custom panels, respectively. Although there were differences in the depth among probes, it was confirmed that all probes functioned well (Supplemental Table 3). The custom panels had a little more median exon coverage (P = 0.02, two-sided t-test) (Table 1).
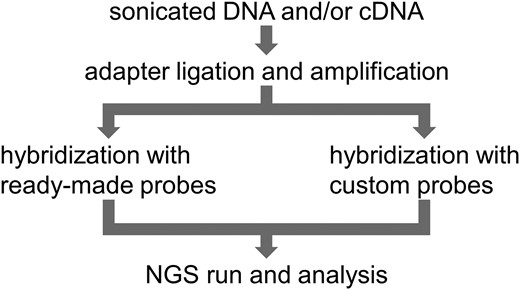
A scheme of our method.
Run statistics of 8 samples.
| SMARCA2 region | ||||||||
|---|---|---|---|---|---|---|---|---|
| Sample | SD01 | SD02 | SD03 | SD04 | SD05 | SD06 | SD07 | SD08 |
| mapped reads | 2 255 172 | 2 058 891 | 2 257 060 | 2 464 949 | 1 540 413 | 1 704 765 | 2 026 829 | 1 925 858 |
| stitched reads | 31 161 | 45 350 | 115 443 | 56 604 | 49 234 | 40 630 | 44 510 | 78 890 |
| mapped reads/stitched reads | 72.4 | 45.4 | 19.6 | 43.5 | 31.3 | 42.0 | 45.5 | 24.4 |
| median exon coverage (depth) | 364 | 488 | 1195 | 615 | 550 | 442 | 512 | 896 |
| % of exon coverage (>50X) | 100.0 | 100.0 | 100.0 | 100.0 | 100.0 | 100.0 | 100.0 | 100.0 |
| % of exon coverage (>100×) | 100.0 | 100.0 | 100.0 | 100.0 | 100.0 | 100.0 | 100.0 | 100.0 |
| TSO500 DNA analysis region | ||||||||
|---|---|---|---|---|---|---|---|---|
| sample | SD01 | SD02 | SD03 | SD04 | SD05 | SD06 | SD07 | SD08 |
| total reads | 110 294 530 | 118 576 568 | 137 144 786 | 118 239 548 | 114 973 216 | 103 119 614 | 123 955 698 | 112 883 678 |
| mapped reads | 109 581 991 | 118 333 571 | 136 166 620 | 117 440 322 | 113 390 773 | 102 063 071 | 123 724 343 | 112 101 474 |
| stitched reads | 10 665 244 | 17 638 667 | 38 221 321 | 20 087 633 | 25 110 366 | 18 651 809 | 19 152 380 | 27 382 606 |
| mapped reads/stitched reads | 10.3 | 6.7 | 3.6 | 5.8 | 4.5 | 5.5 | 6.5 | 4.1 |
| median exon coverage (depth) | 261 | 493 | 1113 | 514 | 572 | 424 | 429 | 731 |
| % of exon coverage (>50×) | 98.9 | 99.3 | 99.4 | 99.3 | 99.5 | 99.5 | 99.5 | 99.6 |
| % of exon coverage (>100×) | 96.8 | 98.8 | 99.1 | 98.8 | 99.2 | 99.1 | 99.2 | 99.4 |
Sequencing of the SMARCA2 Target Regions
As shown in Fig. 2, all SMARCA2 target regions were sequenced with sufficient sequencing depth. The average length of 36 target exons is 136 bp, and all targets were sequenced over 147× average depth (Supplemental Table 3). We combined custom and TSO500 libraries at a 2:96 ratio (described in the Methods section), and the ratio of mapped reads from panels was 1.7% on average, which was close to the mixing ratio. The number of stitched reads (representative reads after processing with UMI tags and realignment, ref. Illumina’s manual) from the custom panel was 0.26% of the TSO500 (the average ratio of stitched reads between panels), and the mapped reads reflected the panel size ratio (4.88 kb for custom and 1.94 Mb for TSO500) (Table 1). This indicates that the TSO500 analysis module, including the “read-collapsing” process, performed effectively on custom panel procedures because it used the same index-UMI-attached libraries as TSO500.
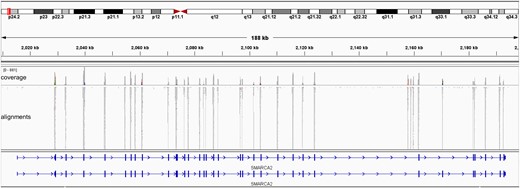
Distribution of sequencing reads in the SMARCA2 region. All targeted exons were covered with sufficient reads. Stitched read data from the samples were illustrated using Integrative Genomics Viewer as an example.
Comparison of the Accuracies between TSO500 and Custom Panels
Next, we investigated whether there were differences in the accuracy of calls in mutation-free regions between the TSO500 and custom panels. We extracted reads mapped to coding regions on chromosome 9 (23 TSO500 target loci excluding SMARCA2) from stitched BAM files of the TSO500 data and variant-called them using VarScan2 to compare the results under identical analysis conditions. When calling somatic variants from FFPE samples, variants with ≥5% variant allele fraction (VAF) were typically identified as actual variants, whereas others (<5%) were regarded as errors (12–14). Since most sites in the targets lacked variants (VAF = 0%), we collected all variants (VAF > 0%) at sites with >100 read depths in the coding regions and calculated the median and interquartile range of VAFs for each sample (Table 2). The values from both panels were quite similar regarding base-calling accuracy (P = 0.11, two-sided t-test). For the TSO500 gene set, 7–18 potential somatic variants per sample were detected (Supplemental Table 4) but not in SMARCA2 region (8).
Comparison of variants/erroneous sites between the SMARCA2 region and other genic regions in chr9.
| SMARCA2 (custom panel) | ||||||||
|---|---|---|---|---|---|---|---|---|
| Sample | SD01 | SD02 | SD03 | SD04 | SD05 | SD06 | SD07 | SD08 |
| sequence changesa | 1335 | 1645 | 2368 | 2038 | 1642 | 1689 | 1760 | 2155 |
| median of read depth (IQRb) | 463 (192) | 575 (376) | 1308 (566) | 666 (266) | 586 (260) | 486 (213) | 544 (154) | 955 (311) |
| VAF, median (IQRb) | 0.25% (0.12%) | 0.20% (0.10%) | 0.08% (0.04%) | 0.17% (0.08%) | 0.19% (0.07%) | 0.23% (0.09%) | 0.20% (0.07%) | 0.12% (0.05%) |
| chr9 (TSO500) | ||||||||
|---|---|---|---|---|---|---|---|---|
| Sample | SD01 | SD02 | SD03 | SD04 | SD05 | SD06 | SD07 | SD08 |
| chr9 (TSO500) | ||||||||
| sample | SD01 | SD02 | SD03 | SD04 | SD05 | SD06 | SD07 | SD08 |
| sequence changesa | 4281 | 7213 | 19 191 | 9173 | 11 133 | 10 849 | 12 839 | 17 159 |
| median of read depth (IQRb) | 277 (116) | 485 (237) | 1015 (359) | 526 (164) | 610 (323) | 546 (300) | 496 (193) | 792 (262) |
| VAF, median (IQRb) | 0.38% (0.18%) | 0.22% (0.11%) | 0.11% (0.05%) | 0.20% (0.06%) | 0.18% (0.10%) | 0.21% (0.12%) | 0.23% (0.10%) | 0.14% (0.06%) |
| chr9 (TSO500) | ||||||||
|---|---|---|---|---|---|---|---|---|
| Sample | SD01 | SD02 | SD03 | SD04 | SD05 | SD06 | SD07 | SD08 |
| chr9 (TSO500) | ||||||||
| sample | SD01 | SD02 | SD03 | SD04 | SD05 | SD06 | SD07 | SD08 |
| sequence changesa | 4281 | 7213 | 19 191 | 9173 | 11 133 | 10 849 | 12 839 | 17 159 |
| median of read depth (IQRb) | 277 (116) | 485 (237) | 1015 (359) | 526 (164) | 610 (323) | 546 (300) | 496 (193) | 792 (262) |
| VAF, median (IQRb) | 0.38% (0.18%) | 0.22% (0.11%) | 0.11% (0.05%) | 0.20% (0.06%) | 0.18% (0.10%) | 0.21% (0.12%) | 0.23% (0.10%) | 0.14% (0.06%) |
Sequence changes with more than 0% of VAF were counted.
IQR, interquartile range.
DISCUSSION
We conducted Illumina TSO500 gene panel analysis of FFPE samples from 8 patients with lung cancer to detect mutations. According to the manufacturer’s instructions, a library containing UMI and index sequences was generated as a 30 μL solution, followed by a hybridization-capture process using 10 μL of the solution. Custom panel analyses can be performed on the remaining solution as it is no longer needed. In our method, TSO500 fragments and custom panel libraries shared the same indices and UMI tags and were simultaneously evaluated in the same NGS run and analysis procedure. Although our modification was an unexpected application of the manufacturer’s method, the capturing efficiency of the panels was unaffected by one another because each hybridization-capture process was conducted in a separate tube. After NGS run, the TSO500 analysis module performed mapping/alignment to the reference genome, read-collapsing, and read-stitching, regardless of the panel-designed genes (9). Therefore, the TSO500 and custom panel targets were error-corrected and read-stitched independently. There were no accumulated/repeated data for erroneous positions or the filtering process; thus, a statistical model of error rates could not be applied to the custom panels. However, the suppression of technical noise resulting from experimental artifacts produced results comparable to those of the TSO500 (Table 2).
At the present, the target regions of TSO500 and the custom panel are not processed for variant detection in the same analysis flow, making them unsuitable for clinical testing. It would be better to create a statistical model of error rates for all regions, including the custom regions, using many samples and build a system in which all panel regions are analyzed similarly by a variant caller using that model. Although the added custom panels cannot be used immediately in clinical practice, they can help speed up developmental studies to improve existing panels for clinical use.
Our custom panel targeted relatively small regions (4.88 kb). Hybridization-capture approaches do not scale to small target regions (<50 kb) and result in recovery of targets of 5% or less; thus, we enriched the targets using the double-capture approach developed by Schmitt et al. (15).
Although our custom panel size was 0.25% of the TSO500 targets, we included approximately 2% of the TSO500 in panel library inputs to prevent NGS read acquisition failure. However, the ratio of stitched reads between the panels reflected differences in the target size, indicating that we employed too many reads for the read-collapsing process (Table 1) and that more genes could be analyzed using a custom panel. In the original method, the TSO500 can simultaneously handle the DNA panel (523 genes) and the RNA panel (55 genes) in a library-mixture (3:1 ratio) during the NGS run according to the manufacturer’s protocol. At least 55 genes can be analyzed using a custom panel if only the DNA is targeted without reducing read depth. It is then considered safer to input approximately 3 times the amount of custom library than the percentage based on size (for example, library-mixture ratio 3:1 vs DNA and RNA panel genes ratio 523:55). When both DNA and RNA are targets, reducing the number of samples per NGS run may be necessary.
In conclusion, our devised method easily and affordably extends targets beyond ready-made panels. This applies to various hybridization-capture-based panel assays (such as IDT’s xGen Pan-Cancer Hyb Panel and Agilent’s SureSelect NCC oncopanel) owing to the similar processes of NGS library preparation. In that case, the ratio between the custom panel and the ready-made panel can be designed with a proportional calculation using the number of targets and the NGS run procedure recommended by manufacturers. Alternatively, reducing the number of samples per NGS run might be necessary. Although whole-exome sequencing is a promising approach for detecting variants in multiple genes in each patient, the target size is approximately 50 Mb, necessitating the sequencing of a more than 25-fold region compared to panel assays (e.g., TSO500). Using a large target size is currently impractical in clinical settings because of its high cost; therefore, our ingenuity is valuable until whole-exome sequencing becomes popular.
Supplemental Material
Supplemental material is available at The Journal of Applied Laboratory Medicine online.
Nonstandard Abbreviations: NGS, next-generation sequencing; TSO500, TruSight Oncology 500; FFPE, formalin-fixed, paraffin-embedded; UMI, unique molecular index; VAF, variant allele.
Human Genes:SMARCA2, SWI/SNF related, matrix associated, actin dependent regulator of chromatin, subfamily a, member 2.
Author Contributions:The corresponding author takes full responsibility that all authors on this publication have met the following required criteria of eligibility for authorship: (a) significant contributions to the conception and design, acquisition of data, or analysis and interpretation of data; (b) drafting or revising the article for intellectual content; (c) final approval of the published article; and (d) agreement to be accountable for all aspects of the article thus ensuring that questions related to the accuracy or integrity of any part of the article are appropriately investigated and resolved. Nobody who qualifies for authorship has been omitted from the list.
Yoji Kukita (conceptualization—equal, data curation—lead, funding acquisition—equal, investigation—equal, methodology—equal, project administration—equal, validation—equal, writing—original draft-lead, writing—review and editing—equal), Kei Kunimasa (conceptualization—equal, funding acquisition—equal, investigation—equal, resources—lead, writing—review and editing—equal), Takashi Akazawa (investigation—equal, resources—equal, writing—review and editing—equal), Yu Mizote (investigation—equal, resources—equal, writing—review and editing—equal), and Hideaki Tahara (project administration—equal, supervision—equal, writing—review and editing—equal).
Authors’ Disclosures or Potential Conflicts of Interest:Upon manuscript submission, all authors completed the author disclosure form.
Research Funding: This study was partly supported by Japan Society for the Promotion of Science KAKENHI Grant Numbers JP19K17694 (K. Kunimasa) and JP22K09368 (Y. Kukita).
Disclosures: K. Kunimasa has received honoraria for lectures from AstraZeneca, Chugai Pharma, and Novartis.
Role of Sponsor: The funding organizations played a direct role in the design of study and preparation of manuscript. The funding organizations played no role in the choice of enrolled patients, review and interpretation of data, or final approval of manuscript.
Acknowledgments
We would like to thank Editage (www.editage.com) for English language editing.
