


Abstract
Placental dysfunction is important to recognize, and more evidence is needed on the dynamics of the placental biomarkers, soluble fms-like tyrosine kinase-1 (sFlt-1) and placental growth factor (PlGF), in early pregnancy. This study aimed to establish reference intervals for placental biomarkers in early pregnancy.
This was a retrospective cohort study of pregnant women (n = 702) in the North Denmark Region, 2013, who had blood samples drawn in early pregnancy including measurements of sFlt-1 and PlGF (Kryptor Compact, Thermofisher Scientific). Reference intervals were established, and the association between sFlt-1 and PlGF and maternal characteristics (age, body mass index [BMI], country of birth, and smoking in pregnancy) was evaluated using linear regression analyses and reported as adjusted beta coefficient (aβ) with 95% confidence intervals (CIs).
The placental biomarkers showed a dynamic trend with higher levels for increasing week of pregnancy; however, sFlt-1 reached a plateau around week 10 of pregnancy. Higher maternal age associated with higher sFlt-1 and PlGF (sFlt-1: aβ 1.02 [95% CI, 1.01–1.03], PlGF: aβ 1.02 [95% CI, 1.01–1.03]), and higher maternal BMI associated with lower sFlt-1 (aβ 0.97 [95% CI, 0.96–0.98]). Furthermore, the level of PlGF was higher among women born outside of Denmark (aβ 1.17 [95% CI, 1.03–1.34]) compared to women born in Denmark and among smokers (aβ 1.56 [95% CI, 1.38–1.78]) compared to nonsmokers.
In a large cohort of pregnant women in Denmark, levels of sFlt-1 and PlGF increased during early pregnancy and were influenced by a series of maternal characteristics.
The potential role of placental biomarkers (placental growth factor and soluble fms-like tyrosine kinase-1) in first trimester screening models for preeclampsia has been brought forward. More evidence is needed across populations on the dynamics and predictors of the placental biomarkers in early pregnant women to substantiate their use in such a screening model. This study provides early pregnancy week-specific reference intervals for placental biomarkers and evaluates the impact of maternal characteristics using data from a Danish regional biobank.
INTRODUCTION
Placental dysfunction in pregnant women is a concern as it may cause adverse pregnancy outcomes (1). Placental dysfunction and placenta-related diseases are associated with an imbalance in circulating placental biomarkers in the maternal system (2, 3). Placental biomarkers include the antiangiogenic soluble fms-like tyrosine kinase-1 (sFlt-1) and the proangiogenic placental growth factor (PlGF). In normal pregnancies it has been found that sFlt-1 increases and PlGF decreases from pregnancy week 30 to 35, which causes an increase in the sFlt-1/PlGF ratio (4–7). Increasing sFlt-1/PlGF ratio can be used for short-term prediction, diagnosing, and monitoring of preeclampsia in the second half of a pregnancy, as sFlt-1 increases and PlGF decreases earlier in late pregnancy among women developing preeclampsia as compared to normal pregnancies (2, 3).
A role of the placental biomarkers in early pregnancy has also been brought forward as the magnitude of a decrease in PlGF in early pregnant women has been associated with later development of preeclampsia (2, 8). This association has introduced PlGF as part of first trimester screening models for preeclampsia in a combined risk algorithm with maternal characteristics, mean arterial pressure, and ultrasound measurement of uterine artery pulsatility index (2, 8–10). A similar approach is used in prenatal screening programs for chromosomal anomalies in which the pregnancy-associated biomarkers, β-human chorionic gonadotropin (β-hCG) and pregnancy-associated plasma protein A (PAPP-A), are combined with maternal characteristics and ultrasound measurement of nuchal translucency thickness (11). More evidence is needed across populations on the levels of sFlt-1 and PlGF in early pregnancy and the role of maternal characteristics to substantiate their use in an early pregnancy screening model for preeclampsia.
In Denmark, routine screening of pregnant women for fetal chromosomal anomalies is part of clinical practice with an algorithm that includes the assessment of β-hCG and PAPP-A in a blood sample drawn in early pregnancy (12). On the other hand, systematic early pregnancy screening for preeclampsia has not yet been implemented in clinical care (13, 14). The North Denmark Region Pregnancy Cohort (NDRPC) (15) is an established biobank with serum residues from early pregnancy screening. The aim of this study was to establish pregnancy week-specific reference intervals for sFlt-1 and PlGF in early pregnancy and to investigate the role of different maternal characteristics. The evaluation was performed within the NDRPC and the early pregnancy findings for the placental biomarkers sFlt-1 and PlGF were compared with the dynamics and trends of the pregnancy-associated biomarkers β-hCG and PAPP-A.
MATERIALS AND METHODS
We conducted a retrospective cohort study using biobank samples collected from 2011 to 2015 among early pregnant women (median pregnancy week 10 [range 4 to 20]) in the NDRPC (n = 17 647) (15). The pregnancy-associated biomarkers, β-hCG and PAPP-A, were analyzed as part of the Danish prenatal screening program for chromosomal anomalies, which consists of a blood sample and a prenatal ultrasound and is offered to every pregnant woman in Denmark during routine care (12). The serum residues were subsequently stored at −80°C, and in 2021, we measured the placental biomarkers, sFlt-1 and PlGF, in a study cohort of randomly chosen singleton pregnant women with live births (n = 702) who had the blood sample drawn from April to July 2013. The samples were consecutively included, and the time period was chosen to ensure enough serum was left for the study analyses. Some of the pregnant women had the blood sample repeated in early pregnancy due to initial uncertainty regarding the length of the pregnancy and thereby incorrect timing of the first sample in relation to the prenatal ultrasound (16) and were included in the present study as a repeated blood sample cohort (n = 39). The study was approved by the North Denmark Region Committee on Health Research Ethics (N-20150015) and registered according to the General Data Protection Regulation in the North Denmark Region (2015-34, 2016-76).
The biochemical measurements were performed in the Department of Clinical Biochemistry, Aalborg University Hospital (Aalborg, Denmark) using an automatic immunoassay on Kryptor Compact (Thermofisher Scientific). For β-hCG and PAPP-A, the analytical measurement ranges were 0.16 to 150 IU/L and 0.004 to 6 IU/L, respectively, and the long-term precision coefficient of variation (CV) was less than 2% (validated as part of laboratory routine performances). For the placental biomarkers, internal validation was performed before the study was initiated, and sFlt-1 had a CV <2% whereas PlGF showed the following level-dependent CV: <7% (30 pg/mL), <3% (100 pg/mL), and <2% (400 pg/mL). The analytical measurement ranges were 22 to 90 000 pg/mL for sFlt-1 and 3.6 to 7000 pg/mL for PlGF, and PlGF values <3.6 pg/mL were replaced by half the value (1.8 pg/mL) prior to study analyses (17).
All biochemical results were linked to information in the Danish Medical Birth Register (MBR) (18) and demographics available at Statistics Denmark using the encrypted, unique 10-digit personal identification numbers. The information obtained via data linkage to the registers included outcome of pregnancy, gestational age at birth, maternal age, pre-pregnancy body mass index (BMI), country of birth, smoking in pregnancy, and parity. Furthermore, pregnant women with hospital diagnoses of preeclampsia in the pregnancy under study were identified in the Danish Nationwide Hospital Register (19) via the 10th International Classification of Disease system (all O14 and O15 codes).
We established early pregnancy week-specific reference intervals in the study cohort after the exclusion of 41 unique women who had outlying values for the biomarkers using Tukey outer fences (sFlt-1 n = 1, PlGF n = 9, β-hCG n = 7, and PAPP-A n = 24), thereby including 661 singleton pregnant women with live births for these calculations who had the sample drawn in median pregnancy week 10 (range 6 to 14). We established reference intervals with the nonparametric method (2.5th to 97.5th percentiles) with 90% confidence intervals (CIs) for sFlt-1, PlGF, β-hCG, and PAPP-A stratified by weeks of pregnancy (6–8, 9, 10, 11, 12–14), and the most early and late weeks were collapsed to obtain enough samples in the group. In a sub-analysis, we investigated the reference intervals when further excluding pregnant women with preeclampsia or preterm birth (gestational age at birth <37 full weeks and zero days).
To substantiate the dynamics observed in the reference intervals in early pregnancy, we subsequently studied the individual longitudinal change over time in each of the biomarkers among women in the repeated blood sample cohort. We calculated the median difference (with 95% CI) for each of the placental and pregnancy-associated biomarkers between sample 1 and sample 2 and made statistical comparison using the Wilcoxon signed-rank test.
Furthermore, we evaluated a series of maternal characteristics as predictors of sFlt-1, PlGF, β-hCG, and PAPP-A in the study cohort using multivariate linear regression. The placental and pregnancy-associated biomarkers were deemed continuous outcome variables and were log-transformed before the analyses to account for skewed distributions. We regarded maternal age and pre-pregnancy BMI as continuous explanatory variables, and their crude associations with the 4 biomarkers were illustrated using marginsplots showing exponentiated means with 95% CI. We reported the adjusted exponentiated beta coefficient (β) with 95% CI, which corresponds to the multiplicative factor of the biomarker for every one-unit increase in maternal age or BMI.
We also evaluated maternal country of birth (born in Denmark/not born in Denmark) and smoking in pregnancy (nonsmoking/smoking) as dichotomous explanatory variables and the associations with the 4 biomarkers. Results were reported as crude and adjusted β with 95% CI, which correspond to the ratio of geometric means of the biomarker between the explanatory variable (not born in Denmark or smoking in pregnancy) and the reference group (born in Denmark or nonsmoking in pregnancy).
Statistical analyses were performed using STATA version 18.0 (StataCorp LLC).
RESULTS
Altogether 661 unique pregnant women with singleton live births were included for establishment of early pregnancy reference intervals after the exclusion of outliers (Table 1). The upper and lower reference limits for PlGF and PAPP-A increased with increasing week of pregnancy (Table 1), which was also reflected by the median (Fig. 1). The reference intervals and median levels for sFlt-1 and β-hCG increased until week 10 of pregnancy after which sFlt-1 seemed to reach a plateau whereas β-hCG declined (Table 1, Fig. 1). Further exclusion of women with preeclampsia or preterm birth in the pregnancy (n = 41) did not change the dynamics of the reference intervals (data not shown).
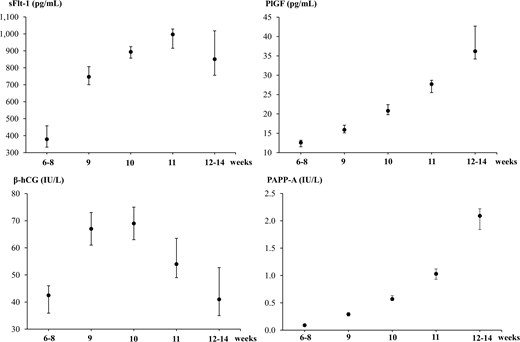
Medians with 90% confidence intervals established in early pregnancy for soluble fms-like tyrosine kinase-1 (sFlt-1), placental growth factor (PlGF), β-human chorionic gonadotropin (β-hCG), and pregnancy-associated plasma protein A (PAPP-A) and stratified by weeks of pregnancy.
Reference intervals as reflected by the 2.5th and 97.5th percentiles (pc) with 90% confidence intervals (CIs) established in early pregnancy among 661 pregnant women for placental and pregnancy-associated biomarkers and stratified by weeks of pregnancy.
| n | 2.5th pc | 90% CIa | 97.5th pc | 90% CIa | |
|---|---|---|---|---|---|
| sFlt-1, pg/mL | |||||
| Week 6–8 | 64 | 42 | 36–55 | 960 | 866–1046 |
| Week 9 | 187 | 323 | 276–339 | 1665 | 1383–1852 |
| Week 10 | 229 | 401 | 333–453 | 2021 | 1775–2442 |
| Week 11 | 118 | 370 | 344–467 | 1983 | 1772–2304 |
| Week 12–14 | 63 | 470 | 458–543 | 1857 | 1640–1866 |
| PlGF, pg/mL | |||||
| Week 6–8 | 64 | 1.8 | 1.8–3.2 | 28.9 | 23.8–29.2 |
| Week 9 | 187 | 4.5 | 1.8–6.5 | 35.1 | 34.2–40.2 |
| Week 10 | 229 | 6.5 | 5.0–8.3 | 43.2 | 37.6–53.6 |
| Week 11 | 118 | 11.9 | 8.8–14.2 | 58.0 | 50.9–63.4 |
| Week 12–14 | 63 | 11.0 | 10.3–16.0 | 73.6 | 67.0–74.2 |
| β-hCG, IU/L | |||||
| Week 6–8 | 64 | 2.7 | 0.4–5.5 | 222 | 123–234 |
| Week 9 | 187 | 23.7 | 21.8–27.9 | 184 | 164–215 |
| Week 10 | 229 | 24.5 | 18.1–28.4 | 180 | 161–207 |
| Week 11 | 118 | 20.0 | 11.0–21.0 | 156 | 131–187 |
| Week 12–14 | 63 | 14.2 | 13.0–18.9 | 173 | 95–223 |
| PAPP-A, IU/L | |||||
| Week 6–8 | 64 | 0.01 | 0.01–0.01 | 0.33 | 0.30–0.35 |
| Week 9 | 187 | 0.08 | 0.07–0.10 | 1.05 | 0.91–1.20 |
| Week 10 | 229 | 0.19 | 0.14–0.21 | 1.74 | 1.48–2.04 |
| Week 11 | 118 | 0.31 | 0.16–0.39 | 3.06 | 2.98–3.15 |
| Week 12–14 | 63 | 0.64 | 0.62–0.80 | 3.23 | 3.08–3.24 |
aLower and upper confidence limit held at minimum and maximum of the sample in “Week 6–8,” “Week 11,” and “Week 12–14.”
The longitudinal individual changes in the biomarkers observed in the repeated blood sample cohort substantiated the dynamics found in the reference intervals. Thus, significantly higher levels of sFlt-1, PlGF, and PAPP-A as well as slightly increased β-hCG in sample 2 compared with sample 1 were found (Table 2).
Longitudinal levels of placental and pregnancy-associated biomarkers in early pregnancy among pregnant women in the repeated blood sample cohort (n = 39). Data are presented as medians with 95% confidence intervals.
| Sample 1 | Sample 2 | P valuea | Differenceb | |
|---|---|---|---|---|
| Pregnancy weekc | 8 (8–8) | 11 (11–12) | <0.01 | 3 (3–4) |
| sFlt-1, pg/mL | 402 (333–612) | 1136 (957–1313) | <0.01 | 569 (447–808) |
| PlGF, pg/mL | 12.2 (11.1–13.4) | 28.6 (22.6–33.1) | <0.01 | 14.9 (8.93–22.0) |
| β-hCG, IU/L | 44.0 (34.3–54.2) | 51.0 (44.0–65.1) | 0.09 | 10.0 (−10.2; 28.4) |
| PAPP-A, IU/L | 0.09 (0.07–0.17) | 1.69 (1.11–2.32) | <0.01 | 1.60 (0.97–2.15) |
aP value for comparison of sample 1 and sample 2 using the Wilcoxon signed-rank test.
bThe difference corresponds to the result of sample 2 minus the result of sample 1.
cThe week when the blood sample was drawn.
The impact of different maternal characteristics on the levels of sFlt-1, PlGF, β-hCG, and PAPP-A in early pregnancy was then evaluated among the full study cohort of 702 pregnant women. The pregnant women studied had a median age of 29 years (ranging from 18 to 46 years) when giving birth and 50.0% were nulliparous. Increasing maternal age was associated with higher sFlt-1, PlGF, and PAPP-A in multivariate linear regression (sFlt-1: aβ 1.02 [95% CI, 1.01–1.03], PlGF: aβ 1.02 [95% CI, 1.01–1.03], PAPP-A: aβ 1.03 [95% CI, 1.01–1.05]), but no association with β-hCG was shown (aβ 1.00 [95% CI 0.99–1.02]) (Fig. 2).
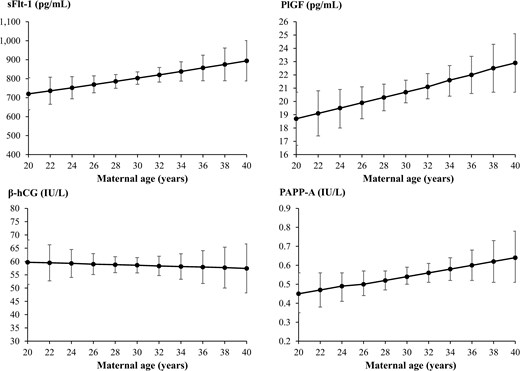
Means with 95% confidence intervals (CIs) for the association between maternal age and soluble fms-like tyrosine kinase-1 (sFlt-1), placental growth factor (PlGF), β-human chorionic gonadotropin (β-hCG), and pregnancy-associated plasma protein A (PAPP-A) in early pregnancy using linear regression. On the y axes are the crude linear predictions of the biomarker with 95% CIs.
Considering maternal pre-pregnancy BMI, most of the women in the study cohort had a normal BMI of 18.5 to 24.9 kg/m2 (56.7%) or were classified as overweight/obese with a BMI at or above 25 kg/m2 (39.0%). Increasing BMI associated with lower sFlt-1, β-hCG, and PAPP-A (sFlt-1: aβ 0.97 [95% CI, 0.96–0.98], β-hCG: aβ 0.97 [95% CI, 0.96–0.98], PAPP-A: aβ 0.95 [95% CI, 0.94–0.97]), and no association with PlGF was found (aβ 1.00 [95% CI, 0.99–1.01]) (Fig. 3).
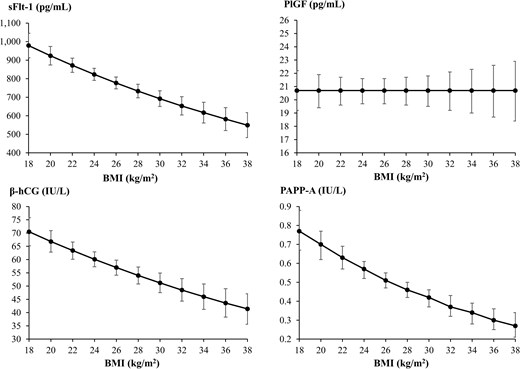
Means with 95% confidence intervals (CIs) for the association between maternal pre-pregnancy body mass index (BMI) and soluble fms-like tyrosine kinase-1 (sFlt-1), placental growth factor (PlGF), β-human chorionic gonadotropin (β-hCG), and pregnancy-associated plasma protein A (PAPP-A) in early pregnancy using linear regression. On the y axes are the crude linear predictions of the biomarker with 95% CIs.
A subgroup of the pregnant women studied were not born in Denmark (13.4%), and the levels of PlGF and PAPP-A were higher in this group of women compared to women born in Denmark, whereas no significant difference in sFlt-1 and β-hCG according to maternal country of birth was found (Table 3). The pregnant women not born in Denmark had a median age of 30 years (ranging from 18 to 40 years) when giving birth, and they were less often obese (26.5%) or smoking in pregnancy (10.6%) compared to the full study cohort. Altogether 14.1% of the pregnant women in the study cohort were smoking during pregnancy, and solely PlGF was significantly influenced by smoking (Table 3). This was indicated by higher levels of PlGF among women smoking in pregnancy, whereas no significant association between maternal smoking and sFlt-1, β-hCG, and PAPP-A was found (Table 3).
The association between maternal country of birth as well as smoking in pregnancy and placental and pregnancy-associated biomarkers in early pregnancy.
| Crude model | Adjusted modela,b | |||
|---|---|---|---|---|
| n | βc | aβd | 95% CIe | |
| Country of birtha | ||||
| sFlt-1 | ||||
| Born in Denmarkf | 608 | Ref. | Ref. | |
| Not born in Denmark | 94 | 1.17 | 1.10 | 0.97–1.24 |
| PlGF | ||||
| Born in Denmarkf | 608 | Ref. | Ref. | |
| Not born in Denmark | 94 | 1.16 | 1.17 | 1.03–1.34 |
| β-hCG | ||||
| Born in Denmarkf | 608 | Ref. | Ref. | |
| Not born in Denmark | 94 | 0.97 | 0.91 | 0.78–1.06 |
| PAPP-A | ||||
| Born in Denmarkf | 608 | Ref. | Ref. | |
| Not born in Denmark | 94 | 1.49 | 1.33 | 1.02–1.74 |
| Smoking in pregnancyb | ||||
| sFlt-1 | ||||
| Nonsmokingf | 603 | Ref. | Ref. | |
| Smoking | 99 | 0.96 | 1.01 | 0.90–1.13 |
| PlGF | ||||
| Nonsmokingf | 603 | Ref. | Ref. | |
| Smoking | 99 | 1.51 | 1.56 | 1.38–1.78 |
| β-hCG | ||||
| Nonsmokingf | 603 | Ref. | Ref. | |
| Smoking | 99 | 1.01 | 1.01 | 0.88–1.16 |
| PAPP-A | ||||
| Nonsmokingf | 603 | Ref. | Ref. | |
| Smoking | 99 | 1.06 | 1.15 | 0.90–1.46 |
aAdjusted model included maternal age, pre-pregnancy body mass index, smoking in pregnancy, and parity.
bAdjusted model included maternal age, pre-pregnancy body mass index, country of birth, and parity.
cExponentiated beta coefficient.
dAdjusted exponentiated beta coefficient.
e95% confidence interval.
fRef.; reference group.
DISCUSSION
In a large cohort of pregnant women in Denmark, we established early pregnancy week-specific reference intervals for the placental biomarkers sFlt-1 and PlGF. Our findings depicted a dynamic trend with increasing levels of sFlt-1 and PlGF for increasing week of early pregnancy, and sFlt-1 reached a plateau around week 10 of pregnancy, whereas PlGF continued to increase. Higher maternal age associated with higher sFlt-1 and PlGF. On the other hand, higher maternal BMI associated with lower sFlt-1, and the level of PlGF was higher among women born outside of Denmark and among smokers.
The placental biomarkers, sFlt-1 and PlGF, are linked to the development of preeclampsia, which is defined as maternal hypertension and proteinuria in the second half of a pregnancy. The disorder can lead to severe complications such as maternal organ failure, fetal growth restriction, and preterm delivery. Therefore, preeclampsia is important to recognize, and the development and severity of the disease can be reduced with prophylactic use of treatment with aspirin starting in early pregnancy (2, 8). The current clinical practice for identifying pregnant women at risk of preeclampsia is based on maternal factors; however, more studies have recently investigated combined first trimester risk algorithms for preeclampsia that include placental biomarkers (2, 8). Even if higher levels of the antiangiogenic sFlt-1 in late pregnancy are associated with the development of preeclampsia, most studies evaluating first trimester levels of sFlt-1 in relation to preeclampsia did not find any correlation (2, 8). On the other hand, a reduced first trimester level of the proangiogenic PlGF has been associated with development of preeclampsia, and a first trimester screening model for preeclampsia combining PlGF, maternal factors, mean arterial pressure, and ultrasound assessment has shown a superior performance compared to the screening model including maternal characteristics only (2, 8, 10, 13). Alternatively, PAPP-A can be used in the model with or without PlGF as PAPP-A is often already used as part of the prenatal screening for chromosomal anomalies (2, 8). The Fetal Medicine Foundation (FMF) has developed such a first trimester screening algorithm for preeclampsia including PlGF that has been validated across countries (9, 13). Moving towards an implementation of early pregnancy screening for preeclampsia in clinical practice, more knowledge on population specific reference intervals for the placental biomarkers is needed.
In this study, we established early pregnancy-week specific reference intervals for the placental biomarkers sFlt-1 and PlGF in a study cohort in Denmark, and we found that the early pregnancy levels of PlGF increased with advancing week of pregnancy, which has also been described in previous studies (4, 5, 20). Considering the dynamics of sFlt-1, we found an increase in the earliest weeks of pregnancy after which the level reached a plateau around week 10 of pregnancy. Previous studies described the level of sFlt-1 as being relatively constant (4, 6) or even decreasing in early pregnancy (5). These studies included a smaller number of samples, and some of the studies combined weeks 8 to 12 (4–6), which may blur the changes observed week by week in our study. The NDRPC (15) included measurements of β-hCG and PAPP-A, and we also established reference intervals for these pregnancy-associated biomarkers in early pregnancy. PAPP-A has previously been found to increase in the first trimester of uncomplicated pregnancies (21) which aligns with our findings. The established reference intervals for β-hCG showed an increase until week 10 of pregnancy followed by a decline in line with the known dynamics of hCG/β-hCG (21, 22). In addition to the establishment of population-specific reference intervals, we had the possibility to evaluate the individual changes in the biomarkers with increasing week of early pregnancy because some of the women had the sample repeated within a few weeks. Even if the repeated sample cohort was relatively small, the trends we observed in the established reference intervals for the placental and pregnancy-associated biomarkers were corroborated. Thus, PlGF showed an increasing trend in early pregnancy when assessed longitudinally in individual women, and this observation substantiates that the timing of blood sampling in a first trimester screening model for preeclampsia is important (8, 10, 14).
Another important aspect when considering the use of biomarkers in an early pregnancy screening model relates to the role of maternal characteristics such as demographics and environmental factors because these factors may influence the levels of the biomarkers independently of the disorders that are to be screened for. Firstly, we observed that early pregnancy levels of sFlt-1 and PlGF increased with higher maternal age, which aligns with results from previous large studies on PlGF (23, 24), although a smaller study found no association (25). A large study from the United Kingdom reported that maternal age did not have a substantial effect on sFlt-1 (26); however, the positive association with maternal age has been described in another large UK study performed in late pregnancy (27). We found increasing levels of PAPP-A with higher maternal age, whereas a previous study including almost 100 000 first trimester samples did not find evidence of a strong association (28). Considering maternal age and β-hCG, no association was found in our study and previously (29). Secondly, sFlt-1 decreased with increasing maternal BMI in our cohort, and this trend has been described across populations (26, 30, 31). Moreover, we found that increasing maternal BMI was associated with lower levels of β-hCG and PAPP-A that aligns to some extent with observations from previous studies (28, 29, 32); however, PAPP-A levels were not significantly different across BMI categories in one report (33).
In our study, PlGF was the only biomarker not influenced by maternal BMI, which aligns with some reports (30, 33), whereas others found that PlGF decreased with increasing BMI (23–25, 31, 34). We found that levels of PlGF and PAPP-A were significantly higher in women born outside of Denmark corroborating the impact of ethnicity found in other populations (24, 28, 34–36). However, we could only report on the country of birth (born in Denmark/not born in Denmark) and not elaborate on specific subgroups or countries. Furthermore, information on social determinants of health were not available in this register-based design. Further studies across populations are needed to expand the findings regarding maternal ethnicity and the possible interplay with other determinants. Lastly, PlGF was significantly influenced by maternal smoking in pregnancy in our study with higher levels among smokers, which is in line with other reports (24, 34). Although we did not observe significant differences in levels of sFlt-1, β-hCG, and PAPP-A among smokers, previous reports on these associations were diverse and found lower levels of sFlt-1 (26), higher (34) and lower levels of PAPP-A (28, 36, 37), and lower levels of β-hCG among smokers (29, 36, 37).
In summary, our results emphasize the role of maternal factors in relation to levels of the pregnancy-associated and placental biomarkers in early pregnancy. The findings support clarification of previous reports that show substantial heterogeneity across studies. Methodological considerations may be of importance including the timing of blood sampling in pregnancy and the choice of variables included in adjusted models. However, it is to be noted that the screening algorithm for preeclampsia developed by the FMF does consider maternal age, height, weight, racial origin, and smoking in pregnancy (9). Our and previous results suggest a need for considering maternal characteristics when first trimester screening for preeclampsia is applied in laboratories and clinical settings.
This was a reference interval study, and it was not designed and powered to determine outcomes of preeclampsia. Thus, we established reference intervals for evaluation across weeks of early pregnancy and maternal characteristics. On the other hand, our study did not establish clinical decision limits. More and large studies are needed to evaluate the clinical value of reference intervals and clinical decision limits for the investigated biomarkers as part of clinical care and early pregnancy screening models. Our study cohort was randomly chosen from the NDRPC, and blood samples were drawn as part of the Danish prenatal screening program in which the rate of participation is high (12). We obtained information on the pregnancy outcome and maternal characteristics from the Danish MBR, and the validity is considered high (18). The biobank samples were stored at −80°C for eight years prior to the measurement of the placental biomarkers which have been shown to be stable for three years of frozen storage (38). More studies are warranted to assess the long-term stability for sFlt-1 and PlGF. The study cohort included pregnant women with singleton live births that may introduce a risk of selection bias. Furthermore, the earliest (week 6 to 8) and latest parts (week 12 to 14) were collapsed to achieve sufficient sample size.
CONCLUSIONS
In a large cohort of pregnant women in Denmark, the levels of sFlt-1 and PlGF increased during early pregnancy and were influenced by maternal characteristics. Results provide pregnancy week-specific reference intervals for the biomarkers in early pregnancy and emphasize a focus on maternal characteristics in first trimester screening models for preeclampsia that rely on placental biomarkers.
Nonstandard Abbreviations: sFlt-1, soluble fms-like tyrosine kinase-1; PlGF, placental growth factor; BMI, body mass index; β-hCG, β-human chorionic gonadotropin; PAPP-A, pregnancy-associated plasma protein A; NDRPC, North Denmark Region Pregnancy Cohort.
Author Contributions: The corresponding author takes full responsibility that all authors on this publication have met the following required criteria of eligibility for authorship: (a) significant contributions to the conception and design, acquisition of data, or analysis and interpretation of data; (b) drafting or revising the article for intellectual content; (c) final approval of the published article; and (d) agreement to be accountable for all aspects of the article thus ensuring that questions related to the accuracy or integrity of any part of the article are appropriately investigated and resolved. Nobody who qualifies for authorship has been omitted from the list.
Authors’ Disclosures or Potential Conflicts of Interest: Upon manuscript submission, all authors completed the author disclosure form.
Research Funding: This work was supported by the Novo Nordisk Foundation (grant number: NNF20OC0059465).
Disclosures: None declared.
Role of Sponsor: The funding organization played no role in the design of study, choice of enrolled patients, review and interpretation of data, preparation of manuscript, or final approval of manuscript.
