


Abstract
Since 2014, almost all African countries have experienced an increase in public debt and a change in its nature. The ratio of public debt to GDP has doubled, and sovereign debt is changing from concessional credit provided by official agencies to market-based loans from private institutions. This paper attempts to answer three questions that are being asked with increasing urgency in this setting. First, has the quality of institutions and policies, critical to sustaining higher levels of debt, improved since the debt relief era of the early 2000s? Second, will debt markets get to know emerging Africa well enough before the next crisis? Third, have resolutions of defaults in Africa been orderly so that debtor governments are not herded into traps set by foreign creditors? Our calculations suggest that the answer to all three questions is ‘no’. To avoid another debt crisis, the paper recommends preventive measures. The policy responses involve full transparency in debt accounting, greater realism in growth forecasts and diligence in matching the region’s seemingly limitless public investment needs with limited long-term development finance and weak public-sector capacity to manage infrastructure investments. More specifically, we recommend that African governments treat increases in commodity prices as temporary—not permanent—shocks; that in deciding how to finance public investment, governments compare the marginal cost of funds from taxation with market terms; and that governments not finance long-term infrastructure projects with short-term money from abroad, regardless of the conditions on which these loans can be contracted.
This is an intentionally speculative paper. It deals with questions about public debt that have become common since the middle of 2014, when global oil prices crashed, African economic growth slowed and sovereign debt problems became more frequent. The World Bank and the International Monetary Fund say that, since 2013, the number of African economies in or near debt distress has grown from 6 to 15. This is prompting a number of questions: is Africa headed for another debt crisis? If it is, what will it look like this time? Will a debt crisis reduce Africa’s dependence on China, or increase it? Should African governments borrow less until their exports and economies start growing faster? Should they rely more on domestic resource mobilisation? These questions have come up because they are obviously important. They have persisted because, equally obviously, they have not been answered.
As we write this, some people believe that public debt dynamics in the continent are becoming benign. The International Monetary Fund (IMF)’s October 2018 World Economic Outlook projects a decline in median debt levels over the next 3 years (IMF, 2018). Coulibaly et al. (2019) warn against the pace of increase in debt and the related servicing burden but also reassure us that ‘commodity prices have retracted their declines, economic growth is recovering, exchange rates have strengthened, and in many cases, fiscal consolidation is under way’. The African Development Bank’s chief economist says that it is time ‘to stop the misleading, generalizing, and stereotyping narrative about an ‘African’ debt crisis fueled by China “threatening” Africa and the world economy’. The markets seem to agree. A year ago, Kenya’s $2 billion bond was seven times oversubscribed. Earlier this year, Ghana’s $3 billion bond offering was six times oversubscribed.
We are not convinced. Even as stories of success in accessing bond markets proliferate, researchers have been compiling evidence that African governments are paying more than other, comparable countries to borrow. A study that examined all sovereign bond issues between 2000 and 2014 suggests that the unexplained ‘Africa Premium’ was almost 3 percentage points after controlling for the length of loans, credit ratings and macroeconomic fundamentals. This means that governments of sub-Saharan Africa would pay roughly $300 million of ‘unjustified’ interest each year and suffer a net loss of $2.2 billion on about $14 billion worth of loans. African bond issuers have lower foreign reserves and trade surpluses so people worry that, since foreign currency loans were financing investments that would not immediately yield foreign currency earnings, these countries would have trouble repaying them. The fear is justified. Seychelles defaulted as soon as Europe slumped, and Chad, Eritrea, Mozambique, Republic of Congo, South Sudan and Zimbabwe became distressed soon after.
On the other hand, there is equally compelling evidence that Africa has massive transport, energy, health and education needs, and debt has to be a major source of development finance. With global interest rates at historic lows, it seems too good an opportunity for Africa to miss. New lenders like China appear keen to get into the game. Commodity prices are recovering and, with 1.4 billion Indians joining the world of big spenders, they might remain high for decades. Disconcertingly, though, some of these arguments are the same ones that got African governments into trouble a few decades ago. A year ago, when we sounded the alarm (see Gill and Karakülah, 2019 and Devarajan, 2018), the IMF’s Africa chief essentially told us to chill. ‘Out of 45 countries in sub-Saharan Africa it is only 15 countries who have high levels of debt or are in debt distress. The rest of the debt levels are manageable.’
When the agency charged with ensuring stability in global financial markets tells everyone to stop worrying, the right response is to examine its own record. There is a simple way to do this. The ability of a country to repay its debt depends on many things, but the most important is economic output. Since the debt has to be repaid in the future, what matters most is future GDP. The most watched number is the forecasted growth of a debtor’s gross domestic product, and the forecasts that are taken the most seriously are those of the IMF. So the obvious first check is to see if the IMF is providing reliable information to markets; we take this up later in the paper. Our findings provide reason for being skeptical not just of government bureaucrats who both monitor national economies and borrow on their behalf but also of well-intentioned foreign experts who provide both surveillance and emergency loans.
To decide whether the worries about public debt in Africa are overblown, we actually need to know three things. One is the increase in indebtedness during the past decade the result of (temporary) creditworthiness due to sweeping debt relief for Africa a decade ago, or improved policies and institutions that have made these economies legitimately better bets since then? Two, do markets know enough about African economies so that there will not be a repeat of the contagion caused by investor ignorance—the ‘Buenos Aires is the capital of Brazil’ disorder—during the Latin American debt crisis of the 1980s? Three, in the event of a crisis, is there a danger of African taxpayers being pushed into a trap set by creditors, among whom Chinese banks are seen as prime suspects?
This paper provides some suggestive statistics to help answer these questions. What we find leaves us less sanguine than the African Development Bank (AfDB), IMF, World Bank and others. The probability of a generalised debt crisis in Africa remains high and steady. Such a crisis will only need a combination of suddenly poor global economic performance—caused, say, by a prolonged trade dispute between the United States and China—and debt distress in one of Africa’s large economies, say Angola or Sudan. The likelihood of one of these developments is not trivial. Based on the similarity in the terms on which debt is being contracted in African countries with strikingly different economic and institutional fundamentals, we are not assured that, when panicked, investors in far away New York and London will distinguish between the Republics of Kenya and Congo. And a quick survey of some economies such as Mozambique and Zambia in Africa’s ‘belt of distress’ does not persuade us that the resolutions will be orderly (Nhamire, 2018).
So, what can be done to make this story end well? The strategy sounds simple: borrow when it is cheaper than raising development finance through taxes, spend wisely on things that yield results before the loans come due and repay as much as you can when times are good—especially if they are unexpectedly good. That’s the IMF’s advice to Malawi, for example, a government with some of the worst debt dynamics in sub-Saharan Africa.1 In the second half of this paper, we explain how difficult it is to implement this advice, viz., to adopt policies that distinguish temporary from permanent shocks, estimate accurately the marginal cost of funds (MCF) to decide when to contract debt and when to rely on taxes and ‘rigorously prioritize’ debt-financed infrastructure projects. In short, there are no easily implementable solutions. But we need to make a start.
1. Into the unknown
Questions about public debt are not easy to answer because they involve making judgments about whether a country—more precisely, its taxpayers—will be able to service its debts without compromising growth and stability. This depends on how much a government decides to borrow and at what terms, how well it uses the money and how capable it is in making taxpayers pay their dues. It requires making judgments about the quality of public institutions in a country. It means making assumptions about how much bankers and investors know about their debtors. It depends also on luck—unexpectedly discovering oil or a sudden spike in the price of copper or cocoa can make even bad borrowing look benign.
To answer questions about Africa’s public debt, then, we will have to be speculative. The payoff is not precision but a functional understanding of debt-related policies that will increase growth and stability in a country. Nevertheless, it does help to start by being precise about what we need to know.
First, we need to know the reasons for the run-up in public debt. One of the main developments during the past decade has been the growing commercialisation of sovereign debt. That is, unlike the past, African governments have been borrowing more on the markets. Deciding if Africa is heading for a crisis involves figuring out whether the rise in public debt is because of a temporary increase in creditworthiness brought about by debt relief in the 1990s and 2000s, or because of durable improvements in policies and institutions that have made them better borrowers. Our findings indicate that in some cases it is the former, in others the latter. So it is likely that some countries will experience debt distress—Mozambique and Zambia have already defaulted—while others ought to do just fine.
Second, we need to know not just how well African governments know the markets, but how well the markets know the region. African governments are generally newcomers to international capital markets, and neither the markets nor African economies know each other well. What then does the commercialisation of sovereign debt mean for the risk of contagion? In other words, what is the likelihood that debt distress in a few African countries will trigger a continent-wide crisis, much like what happened in Latin America in the 1980s? Our conjecture is that if one or more of the region’s largest economies—Nigeria, South Africa, Angola, Kenya and Sudan—get in trouble, the crisis would envelope objectively solvent economies. Phrases like ‘Lusaka is the capital of Angola’ might then join the lexicon of international finance.
Third, we need to know what will happen when both the debtors and creditors are developing countries. The larger economies in Africa have become dependent on China for financing transport, energy and mining investments. In 2008, only 6 percent of Africa’s loans were from China; by 2018 this was up to 15 percent. Relatedly, this ratio rose most sharply in countries with the highest ratios of public debt to GDP, like Angola, Congo, Ethiopia, Ghana, Kenya, Sudan and Zimbabwe. Debt ratios are still low, but debt dynamics are troubling. Notably, indebtedness to China has gone up faster in countries vulnerable to overall debt distress.
We take up these issues in turn. What makes any such exercise useful for policymakers is whether it identifies actions that are feasible, and which can make the problems easier to handle. We do that in the second part of the paper.
2. Have institutions and policies improved since debt relief?
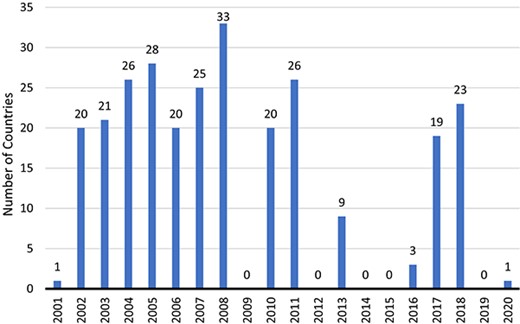
One way to determine whether the increase in public debt is being driven by reforms (and not relief) is to determine if the countries with the biggest increases in debt have also improved their policies and institutions the most. Fortunately, the World Bank’s Country Policy and Institutional Assessments (CPIA) are publicly available for all low-income countries in the region, i.e., except for Botswana, Eswatini, Equatorial Guinea, Gabon, Mauritius, the Seychelles and South Africa. As illustrated in Figure 1, the CPIA scores in most countries in Sub-Saharan Africa deteriorated throughout the 2010-2019 period.
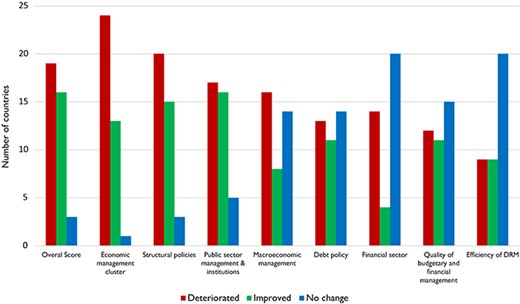
The Quality of Policies and Institutions Has Deteriorated Over 2010–2019. Source: Author’s calculations, based on World Bank reports and World Bank (2020, 2021). Note: The figure includes 38 countries.
Appendix Table A1 ranks the countries by the change in public debt to GDP ratios between 2010 and 2019. The table reports the cumulative change in per capita GDP, poverty rates and the quality of policies and institutions for all these countries. Except for 14 countries, per capita income has increased during the last decade. Extreme poverty headcount ratios have come down in all but ten countries. Table 1 summarises the findings.
Debt Increases Have Outpaced the Improvements in Policies and Institutions
| Number of countries | Change in overall CPIA from 2010 to 2019 | |||||||
|---|---|---|---|---|---|---|---|---|
| ≤−0.3 and ≥−0.8 | ≤0 and >−0.3 | ≤0.3 and >0 | ≤0.6 and >0.3 | ≤0.9 and >0.6 | ≤1.1 and >0.9 | No data | ||
| More than 100% of GDP | 3 | 2 | 0 | 0 | 0 | 0 | 1 | |
| More than 50% of GDP | 1 | 8 | 5 | 1 | 0 | 1 | 6 | |
| More than 30% of GDP | 5 | 3 | 4 | 1 | 1 | 0 | 1 | |
| Gross public debt (% of GDP; 2020) | Less than 30% of GDP | 0 | 0 | 2 | 0 | 0 | 0 | 1 |
| PD deteriorated more than 50% of GDP | 3 | 2 | 0 | 0 | 0 | 0 | 2 | |
| PD deteriorated up to 50% of GDP | 2 | 3 | 2 | 0 | 0 | 1 | 5 | |
| PD deteriorated up to 30% of GDP | 4 | 8 | 7 | 1 | 1 | 0 | 1 | |
| Change in gross public debt (PD) from 2010 to 2019 | PD improved | 0 | 0 | 2 | 1 | 0 | 0 | 1 |
| More than 50% of population | 2 | 7 | 1 | 0 | 0 | 0 | 1 | |
| More than 30% of the population | 4 | 3 | 6 | 1 | 0 | 1 | 0 | |
| More than 10% of the population | 1 | 3 | 3 | 1 | 1 | 0 | 4 | |
| Extreme poverty (% of population; 2019) | Extreme poverty is less than 10% of population | 2 | 0 | 1 | 0 | 0 | 0 | 4 |
Source: Author’s calculations, based on World Bank and IMF data.
But the most important finding in Table 1 is that the quality of policies and institutions are more likely to have declined in countries that have had the biggest increases in public debt to GDP ratios. Given that GDP has increased in all but a couple of these countries, the increase in debt ratios is the result of policy choices—the result of borrowing, not a collapse of output. With no exception, the countries where public debt decreased improved their CPIA scores as let them decline. Almost without exception, the countries with an increase in debt ratios of more than 30 percentage points experienced declining CPIA scores. Countries where this ratio increased by up to 30 percentage points were as likely to improve their CPIA scores as let them decline. The quality of policies and institutions is more likely to have increased for countries that had small increases or declines in public indebtedness.
Appendix Table A2 reports changes in CPIA subcategories, paying special attention to economic management (especially macroeconomic stability and debt policy), structural policies (especially the financial sector) and public sector management (especially the quality of budgetary and public financial management and the efficiency of domestic resource mobilisation). With just a few exceptions (such as Cote d’Ivoire, Rwanda, Togo, Comoros and Zimbabwe), the quality of the policies and institutions most relevant for managing debt, taxes and spending has deteriorated across the subcontinent.
It would be fair to conclude that the rise in indebtedness in sub-Saharan Africa since 2008 has coincided with a deterioration of economic policies and structures and public sector management. These findings would be consistent with the argument that public debt has grown because of temporarily better public accounts due to debt relief accompanied by high commodity prices. That is, the growth of market debt in Africa does not reflect durable improvements in public management and administration.
This finding has two implications. The first is that countries where the quality of governance has slipped (or has not improved enough) but where debt has grown are risking another debt crisis. This should bother Africans. The second is that the fate of many African economies continues to be decided by public officials and private markets in other parts of the world. This should bother Africans even more.
3. Will debt markets get to know emerging Africa in time?
It would be fair to say that, with the exception of South Africa and Mauritius, global markets are still getting to know sovereign debt markets in sub-Saharan Africa. Bonds spreads reported by JP Morgan for Cote d’Ivoire, Gabon, Ghana Nigeria and Senegal all lie in a fairly narrow range between 400 and 500 basis points; only the spread for South Africa is below 300. Until 2014, Africa’s governments paid an average premium of 2.9 percentage points after accounting for global conditions and country-specific risk factors (Olabisi and Stein, 2015). If this is the full extent of the Africa risk premium, it is good news for borrowers in the region.
But this was during 2004–2014, a period of economic expansion in Africa. Annual GDP growth in sub-Saharan Africa fell below 3 percent in 2015 and—if the expected growth rate percent of 2.9 percent persists in 2019—it would have stayed below population growth rates for five straight years. Not a crisis, but these are not good times for the subcontinent. What is worrisome is that African per capita incomes have been falling during a time that its three major trade partners—China, India and the United States—have been averaging real GDP growth rates of 6.5, 7.5 and 2.5 percent, respectively. Some sovereign debtors are barely hanging on.
During periods of uncertainty, markets look to international financial institutions for information, especially to the IMF, the organisation charged with maintaining global financial stability. For emerging economies, traders rely even more on the IMF’s views. ‘The IMF’s forecasts are some of the most-watched in the world and routinely make for essential reading among policy makers, economists and traders’ (McKintyre and Sam, 2019). How well the IMF understands and communicates the workings of a developing economy and the debt contracted by its sovereign matters a lot.
This is not reassuring, because there is evidence of biases in IMF pronouncements—a bias towards growth optimism in countries that have arrangements with the Fund, and a less serious but noticeable bias against countries in parts of the world such as East Asia where the IMF is largely unwelcome. The IMF’s projections for public debt to GDP ratios in sub-Saharan African countries are biased toward optimism. In this, the IMF is perhaps not different from every other international institution. The bigger problem is that it is systematically biased in favor of countries with IMF borrowing arrangements. Currently, the IMF has lending arrangements with 20 countries in sub-Saharan Africa: Extended Credit Facility agreements with 17 countries, and Extended Fund Facility arrangements with five countries (Cote d’Ivoire and Ethiopia are in both categories). Table 2 provides the list of what we call ‘program countries’. With per capita incomes still falling in many countries despite the recovery in commodity markets, this number could easily double during the next 5 years.
Current IMF Arrangements in Africa
| Date of arrangement | |
|---|---|
| Angola | 12/7/2018 |
| Benin | 4/7/2017 |
| Burkina Faso | 3/14/2018 |
| Cameroon | 6/26/2017 |
| Central African Republic | 12/20/2019 |
| Chad | 6/30/2017 |
| Cote d’Ivoire | 12/12/2016 |
| Equatorial Guinea | 12/18/2019 |
| Ethiopia | 12/20/2019 |
| Gabon | 6/19/2017 |
| Guinea | 12/11/2017 |
| Liberia | 12/11/2019 |
| Malawi | 4/30/2018 |
| Mali | 8/28/2019 |
| Mauritania | 12/6/2017 |
| Niger | 1/23/2017 |
| Republic of the Congo | 7/11/2019 |
| Sao Tome and Principe | 10/2/2019 |
| Sierra Leone | 11/30/2018 |
| Togo | 5/5/2017 |
Source: International Monetary Fund (various reports).
The assessments of debt sustainability by the IMF, World Bank and the African Development Banks depend critically on assumptions about economic growth. The forecasts of the World Bank and the AfDB seldom differ from those of the IMF, so what really matters is what the Fund is saying. It is hard to accurately forecast economic growth, and getting numbers wrong is acceptable. What should not be accepted is systematic and persistent bias. To assess the objectivity of the IMF’s growth forecasts, we studied the IMF’s projections for gross public debt and real GDP growth in 46 African countries between 2015 and 2026. The first exercise covers the period from the date of arrangement to 2026 for the countries that have an IMF program, and from the latest actual data to 2026 for the 30 other countries. The second provides projected and actual debt and growth statistics from 2020 to 2026 for all countries (Appendix Table A3).
3.1 Analysis from the date of arrangement to 2026
The projections appear to be biased toward optimism in countries with IMF programs. The IMF forecasts that 14 of these 20 countries will be able to reduce their gross public debt to GDP ratios from the date of arrangement to 2026. Contrast this prognosis with projections that the gross public debt to GDP ratio will increase in 15 countries among 26 countries that do not have a program with the IMF.
In addition, in terms of change in gross public debt and real GDP growth rate, there is a significant difference between countries under the IMF program and other countries. During the mentioned period, the average reduction in gross public debt to GDP ratio in countries under the IMF program is 5.3 percentage points. On the other hand, the gross public debt to GDP ratio in the other 26 countries is estimated to increase by an average of 1.9 percentage points. The IMF projects an average annual growth of 3.8 percent for countries with IMF programs, while the projection for the same period for non-program 26 countries is 3.4 percent (Table 3).2
Summary of IMF Projections for Public Debt and GDP Growth
| Change from date of arrangement | Change from 2019 | Annual avg. growth (%) 2010–2015 | Annual avg. growth (%) 2015–2019 | |||
|---|---|---|---|---|---|---|
| Public debt (pp) | Growth (%) | Public debt (pp) | Growth (%) | |||
| Program | −5.3 | 3.8 | −6.4 | 3.7 | 4.3 | 3.1 |
| No program | 1.9 | 3.4 | 0.6 | 3.1 | 4.2 | 3.0 |
Source: Authors’ calculations, using IMF data.
We also compared the average annual growth rates between the projection term and 2010–2015, the time during which African economies experienced the commodity super-cycle, and 2015–2019. There was no difference in the growth rates for program and non-program economies during 2010–2015 and 2015–2019. Countries that are currently under an IMF program experienced an average of 4.3 percent growth per annum during 2010–2015, while the average annual growth rate in the other 26 countries was 4.2 percent. In addition, average annual growth rate during 2015–2019 was 3.1 percent for the countries that are currently under an IMF program as it was 3.0 percent for the other 26 countries. Contrast this rate for 6 years of high growth with the current projections of 3.8 percent for countries under IMF programs for the next six.
3.2 Analysis from 2019 for all countries
The results do not change much when the period of analysis is fixed for all countries, from 2019 to 2026. There is still is a significant difference between countries under the IMF program and other countries in terms of change in gross public debt and real GDP growth rate. For 2019–2026, the average reduction in gross public debt to GDP ratio in countries under the IMF program is 6.4 percentage points while gross public debt to GDP ratio is estimated to increase by 0.6 percentage points in the other 26 countries. The IMF projects an average annual growth of 3.7 percent for program countries while the projection for other 26 countries is an average annual growth of 3.1 percent.
Agur et al. (2018) warn that as bond markets become more integrated, the problem is likely to get worse.3 For the IMF to play a stabilising influence in emerging Africa, markets should have a lot of confidence in the information it provides. Ideally, its forecasts should be accurate. At a minimum, they should be unbiased.
4. Have resolutions of defaults in Africa been orderly?
That Africa’s public debt has increased is obvious (Gill and Karakülah, 2018). Whether debt dynamics have deteriorated and whether commercial debt has increased are less obvious, but potentially much more serious. Even more critical is whether or not debtors and creditors have responded in ways that inspire confidence.
4.1 Debt trajectories in Africa’s ‘Belt of Distress’
We looked closely at seven countries in what we call the belt of distress—a swath of countries just north of South Africa, from Madagascar in the east to the Republic of Congo in the west.
Six out of seven countries are in trouble (Figure 2). Only Madagascar, with public debt still below 50 percent of GDP in 2020, seems somewhat safe. Public debt to GDP ratio more than sextupled in Zambia in the past decade as the ratio more than tripled in Angola and Mozambique. In addition, public debt to GDP ratio more than doubled in Republic of Congo and Malawi, and almost doubled in Zimbabwe. The public debt to GDP ratio hit triple digits in Zambia, Angola, Mozambique and the Republic of Congo (Table 4).
Debt Indices in Seven Distressed Economies
| Public debt (% of GDP) 2010, 2020 | Change in debt (2020–2010) | Real growth rate in 2020 | Real growth rate during 2015–2019 (g) | Effective interest rate (r) | r-g | ||
|---|---|---|---|---|---|---|---|
| Zambia | 18.9 | 117.8 | 98.9 | −3.5 | 3.2 | 7.2 | 4.0 |
| Angola | 37.2 | 127.1 | 90.0 | −4.0 | −1.3 | 5.4 | 6.7 |
| Mozambique | 39.7 | 122.2 | 82.5 | −0.5 | 3.3 | 3.8 | 0.5 |
| Republic of Congo | 43.5 | 101.7 | 58.2 | −7.8 | −5.6 | 2.4 | 8.0 |
| Zimbabwe | 47.6 | 88.9 | 41.3 | −8.0 | 0.3 | 2.9 | 2.6 |
| Malawi | 27.2 | 67.3 | 40.1 | 0.6 | 3.5 | 5.3 | 1.8 |
| Madagascar | 32.3 | 43.6 | 11.2 | −4.2 | 3.9 | 2.4 | −1.5 |
Source: Authors’ calculations, using IMF data, and Ministry of Finances, Central Banks and National Statistics Offices of the countries in the table.
Growth figures in these countries are not encouraging. In 2020, Angola’s economy shrank for the fifth consecutive year, and the Republic of Congo’s economy shrank for the sixth consecutive year. Due to the COVID-19 pandemic, all economies substantially shrank in 2020, except Malawi in which the growth was sluggish. The COVID-19 pandemic globally hit hard economies in 2020, but those countries’ growth was not promising before the pandemic. Average growth during 2015–2019 ranged from 0.3 percent in Zimbabwe to 3.9 percent in Madagascar, while Angola and the Republic of Congo experienced a recession during this period. Countries should borrow as long as they are able to convert debt into productive investment and hence growth. Otherwise, debt accumulates, causing potential debt distress. Unfortunately, six countries in Africa’s ‘belt of distress’ are failing to convert debt into growth. The effective interest rate is higher than the growth rate in all these countries except Madagascar.
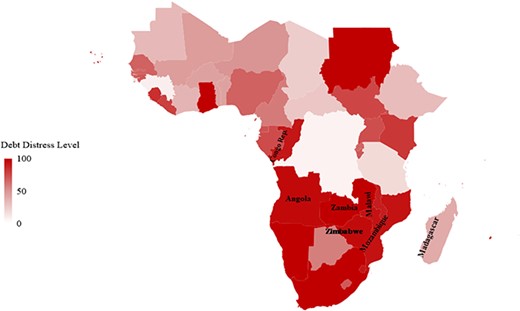
Countries in the Belt of Distress Are Among the Most Distressful Countries in the SSA. Source: Authors’ calculations, using IMF data, and Ministry of Finances, Central Banks and National Statistics Offices of the countries in sub-Saharan Africa.
The composition of creditors is also changing. Commercial creditors now hold substantial parts of external debt of some countries. In Mozambique, the external public debt to commercial creditors rose to 96.5 percent of GDP in 2020; it is 42.4 percent in Angola, 31.3 percent in Congo and 28.9 percent in Zambia. The share of Chinese debt, most of which is non-concessional, is growing more than ever. As public debt to China rose to 37.5 percent of GDP in Angola, it reached more than 20 percent of GDP in Zambia and Congo (Table 5).
The Profile of Creditors in the Belt of Distress
| (% of GDP) | Public debt | ||||
|---|---|---|---|---|---|
| Total | Domestic | External | |||
| Total | Of which: commercial banks and other financial institutions | Of which: China | |||
| Zambia | 117.8 | 37.2 | 80.5 | 28.9 | 20.6 |
| Angola | 127.1 | 37.9 | 89.2 | 42.4 | 37.5 |
| Mozambique | 122.2 | 25.72 | 96.5 | 75.8 | 18.9 |
| Republic of Congo | 101.7 | 29.4 | 72.3 | 31.3 | 20.4 |
| Zimbabwe | 88.9 | 32.0 | 56.9 | 18.2 | 11.4 |
| Malawi | 67.3 | 37.3 | 30.0 | 3.7 | |
| Madagascar | 43.6 | 14.0 | 29.6 | 1.4 | 0.5 |
Source: Authors’ calculations, using IMF data, and Ministry of Finances, Central Banks and National Statistics Offices of the countries in the table.
4.2 Reasons for increasing public debt in the ‘Belt of Distress’
While commodity prices peaked during 2010–2014, the next 2 years saw a sharp decline. Even though most commodity prices recovered in 2017, oil prices were still way below their 2014 level. In addition, oil prices collapsed in the end of the first quarter of 2020 and the collapse continued in the second quarter because of the COVID-19 pandemic and the drop in the global oil demand. The oil prices dropped to 20-year lows, about 21 US dollar per barrel in April 2020. Even though oil prices increased through the second half of 2020 and 2021, oil prices are still about half of their 2014 level.
Oil exporters saw increases in public debt levels as a result of declining revenues. In Angola, general government revenues decreased from 31 percent of GDP in 2014 to 17.5 percent in 2016 due to a 12.4 percentage point decline in oil revenues. In addition, general government revenues have not improved since then. Likewise, in the Republic of Congo, general government revenues declined from 38 percent of GDP in 2014 to 22 percent of GDP in 2017, and it is about 25 percent of GDP in the past 5 years. Other resource-rich countries were also affected by the deterioration of commodity prices. For instance, primary deficits accounted for an 8.3 percentage point increase in Zambia’s public debt during 2015–2016 (Gill and Karakülah, 2019).
These countries decreased spending in response to declining government revenues. However, the reduction in government spending did not match the reduction in government revenues. Primary deficits in all seven countries increased during 2015–2020. Cumulatively, primary deficits reached more than 55 percent of GDP in Zambia, and 45 percent of GDP in Malawi. According to IMF country reports, the primary deficit accounts for 5 percentage points of the increase in Malawi’s public debt during 2015–2016 and 13 percentage points of the increase in Mozambique’s public debt for the same period. During 2014–2016, the primary deficit accounts for about 8 percentage points of the increase in Angola’s public debt and nearly 12 percentage points of the increase in Zambia’s public debt (Table 6).
Persistent Primary Deficits
| Primary net lending/borrowing (% of GDP) | 2015 | 2016 | 2017 | 2018 | 2019 | 2020 | 2016–2020 cumulative |
|---|---|---|---|---|---|---|---|
| Zambia | −9.5 | −6.1 | −7.6 | −8.4 | −9.8 | −13.9 | −55.4 |
| Malawi | −5.9 | −6.9 | −7.4 | −6.2 | −6.5 | −13.3 | −46.2 |
| Mozambique | −6.7 | −5.5 | −2.9 | −6.8 | −0.2 | −5.4 | −27.5 |
| Republic of Congo | −17.8 | −15.6 | −5.9 | 5.8 | 4.8 | 1.5 | −27.4 |
| Zimbabwe | −1.8 | −6.5 | −8.3 | −4.7 | −1.4 | 1.1 | −21.6 |
| Madagascar | −2.9 | −1.1 | −2.1 | −1.3 | −1.4 | −4.2 | −12.9 |
| Angola | −2.9 | −4.5 | −6.3 | 2.2 | 0.7 | −1.7 | −12.5 |
Source: Authors’ calculations using IMF data.
Another reason for increasing public debt in these countries is the depreciation of the currency since 2014 (Table 7). Angola’s kwanza lost 83 percent of its value against the US dollar in 2014–2020 as Zambia’s kwacha lost 71 percent of its value against the US dollar. In Mozambique, Malawi and Madagascar, currencies lost their values by 57 percent, 52 percent and 41 percent, respectively. The depreciation of currencies hurt those with external debt, including Mozambique, Angola, Zambia, Malawi and Madagascar. The depreciation of Mozambican metical accounts for 50 percentage points of the rise of 70 percentage points in Mozambique’s public debt during 2015–2016, and the depreciation of the kwanza accounts for 16 percentage points of a 36 percentage point increase in Angola’s public debt during the same period. The IMF reported that in 2015, a 29 percent depreciation in the kwacha increased Zambia’s public debt by 13 percentage points.
Depreciation, Across the Belt
| (% lost of the LCU value against US $) | 2014–2016 | 2014–2019 | 2014–2020 |
|---|---|---|---|
| Angola | 41% | 74% | 83% |
| Zambia | 48% | 58% | 71% |
| Mozambique | 52% | 52% | 57% |
| Malawi | 49% | 51% | 52% |
| Madagascar | 31% | 39% | 41% |
| Republic of Congo | 17% | 16% | 14% |
| Zimbabwe | N/A | N/A | N/A |
Source: Authors’ calculations, using IMF’s International Financial Statistics.
4.3 Recent developments
Mozambique is already in debt distress, but the aspect of Mozambique’s borrowing that is still worrying is its hidden debt. Manuel Chang, the Minister of Finance at the time, issued guarantees to three state owned companies in 2013 and 2014 in exchange for a $12 million bribe. It is claimed that at least $200 million was spent on bribes and kickbacks. Moreover, a $1.4 billion loan—about 10 percent of Mozambique’s GDP—from Credit Suisse and VTB Bank was not disclosed to the IMF and the public. The scandal was revealed in 2016. In January 2019, a case in the US Court of Appeal charged that former President Armando Guebuza as well was bribed to enable the financing of the state-owned company, Proindicus. Hidden debt is a problem in the Republic of Congo too. In 2017, the IMF revealed that the state-owned oil company contracted pre-financing contracts with oil traders on behalf of the government. The contracts were not disclosed to the debt management office.
The other serious concern is the debt to China. China has become one of the main creditors since 2000 and its influence has been growing. In Sri Lanka, China took over Hamabantota port in exchange for debt. There are rumors about China’s possible takeover of state-owned companies in Zambia and Zimbabwe. In September 2018, Zesco, the state-owned national electricity company, was believed to be on the table during discussions about Zambia’s debt to China (Laterza and Mususa, 2018). The story has been denied by the Zambian Government.
As rising debt and deteriorating debt dynamics increased the burden on taxpayers, Angola and Malawi received relief under IMF programs in 2018. The IMF approved a $108.2 million arrangement for Malawi to support the country’s economic and financial reforms in April 2018, and it approved a $3.7 billion extended arrangement for Angola in December 2018. These arrangements could be undermined by corruption, which is high in these countries (Table 8), exacerbating problems with debt mismanagement.
Corruption Perceptions in Stress Belt Economies
| Corruption Perception Index (0, worst; 100, best) | 2015 | 2016 | 2017 | 2018 | 2019 | 2020 |
|---|---|---|---|---|---|---|
| Zambia | 38 | 38 | 37 | 35 | 34 | 33 |
| Malawi | 31 | 31 | 31 | 32 | 31 | 30 |
| Angola | 15 | 18 | 19 | 19 | 26 | 27 |
| Madagascar | 28 | 26 | 24 | 25 | 24 | 25 |
| Mozambique | 31 | 27 | 25 | 23 | 26 | 25 |
| Zimbabwe | 21 | 22 | 22 | 22 | 24 | 24 |
| Republic of Congo | 23 | 20 | 21 | 19 | 19 | 19 |
Source: Transparency International, 2019.
In summary, unlike the AfDB and IMF, we are concerned about the rise in public debt in Africa since 2014. Countries with the largest increases in debt have seen noticeable deteriorations in their policies and institutions. Private creditors, who are increasingly prominent in Africa, rely on growth projections from international financial institutions such as the IMF, which appear to be biased upwards for countries in IMF arrangements. Finally, the experience of the countries in the ‘belt of distress’ suggests that debt defaults will not be orderly. Rather, they have been ridden with opaque debt reporting and corruption at the highest levels.
The question therefore is what can be done? While there are no easy or magic solutions, in what follows, we propose three areas of action that could help prevent these disturbing developments from turning into a full-blown crisis.
5. Responding correctly to commodity markets
During the first decade of this century, thanks to the Heavily Indebted Poor Countries (HIPC) and Multilateral Debt Relief Initiative (MDRI) debt relief initiatives, almost all low-income African countries experienced a reduction in debt levels. In the second half of the current decade, as shown above, many of these countries saw an increase in public debt levels, with about 15 going into high risk of debt distress or worse. This was due to the fall in commodity prices starting in 2014; Africa’s terms of trade fell by 20 percent between 2014 and 2015. Most African countries rely on primary commodities for exports and revenues, so the rise in debt after a commodity price shock is not surprising. Since 2014, with the exception of Seychelles, Mauritania and Gabon, every country has run a deficit in primary fiscal balance (Figure 3).
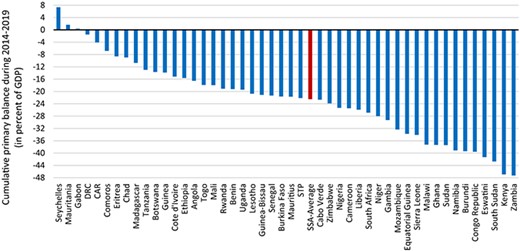
Cumulative Primary Balances in Sub-Saharan Africa During 2014–2019. Source: Authors’ calculations, using IMF data.
The fall in commodity prices since 2014 followed a period of rising commodity prices that started in the early 2000s. Some observers describe it as the commodity super-cycle (Figure 4). The critical question is whether these countries treated the favorable terms of trade in the 2000s as a temporary or permanent shock. For a country to respond correctly to the shock, it must get this diagnosis right.
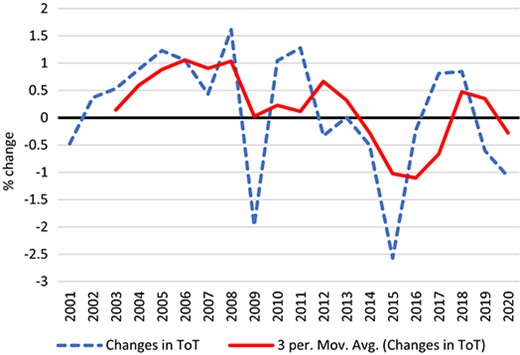
The Commodity Super-Cycle. Source: Authors’ calculations, using IMF’s Commodity Terms of Trade Database. Note: The figure reflects the arithmetic average of 48 sub-Saharan African countries.
To understand how African countries viewed the temporary improvement in terms of trade, consider the following simple framework, adapted from Schmitt-Grohé et al. (2016). There are two periods, and the country chooses how much to consume in each period by maximising a utility function subject to a budget constraint that reflects the rate at which it can transfer resources between the two periods (the world interest rate).
The country then experiences a favorable terms of trade shock. If the shock is temporary, the budget line is shifted to the right for one period. The country could in principle consume the entire windfall in the first period, but that would not be optimal, since the shock is temporary. It would be better to save some of the additional resources for consumption in the second period. As a result, the increase in consumption in the first period would be less than the increase in resources. The savings from the windfall are reflected in an improvement in the current account balance.
By contrast, if the shock is permanent, there is no need to save part of the windfall for the second period because there would be another favorable shock then. In this case, the optimal response is to consume the additional resources. The current account would be unaffected.
Although simple, this framework can shed light on a country’s expectations based on its observed behavior. For example, Chile experienced a sharp rise in price of copper, its major primary export, in the early 2000s. No one knew for sure whether the price increase was temporary or permanent. Chile ran current account surpluses between 2004 and 2007, suggesting that Chileans believed that the shock was a temporary one. The reaction of many African countries to the favorable commodity shocks of the early 2000s was different. About 20–30 countries whose terms of trade improved had deteriorating current account balances (Figure 5). In some cases, this pattern persisted for 4–6 years (Figure 6). This behavior is consistent with the belief that the terms of trade shock were permanent.
African Countries With Deteriorating Current Account Balance as Terms of Trade Improves. Source: Authors’ calculations, using IMF (2019a, b) data.

Alternatively, though, these countries may have found countercyclical fiscal policies politically difficult to implement. These are poor countries with huge needs. Asking their generally democratically elected governments to save part of a windfall often elicits resistance. The story goes that an IMF mission chief suggested to a senior African government official that he save some of the additional revenues ‘for a rainy day’. The policymaker responded: ‘But it’s raining today.’ It’s hard to not sympathise with this sentiment. But the cold fact is that when commodity prices fell, these countries were not as prepared to cushion the shock as they might have been had they saved more of the windfall during the (temporary) commodity price boom. African policymakers will have to keep this in mind when commodity prices spike the next time (Devarajan, 2018).
6. How (much) to borrow for infrastructure
One of the reasons that so many countries in sub-Saharan Africa chose to spend and borrow rather than save some of the earnings from the commodity price boom is their huge infrastructure deficit. Africa has the poorest energy and transport infrastructure in the world. Some 600 million Africans live without electricity. Road density has been declining over the past 20 years. The problem though is that there are many weak links in the chain between borrowing for infrastructure and improvements in infrastructure services on the ground. There is at best a weak correlation between public investment and improvements in infrastructure quality (Figure 7). This has been observed in a number of countries and corroborated in empirical studies going back to Devarajan et al. (1996) and Easterly and Servén (2003). While the reasons are many, they can be classified in two broad categories: public spending is managed poorly, and the binding constraint on infrastructure improvements is not finance.
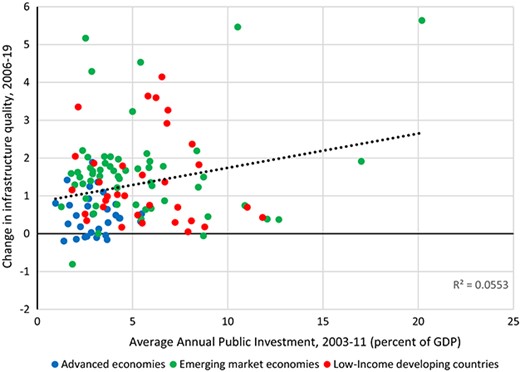
The Binding Constraint on Infrastructure Is Not Always Money. Source: Authors’ calculation using data from the World Economic Outlook and the IMF Public Investment and Capital Stock Database.
Several studies have shown that developing countries in general, and some African countries in particular, fare poorly in the allocation of public resources to investment projects, in the use of funds for their intended purposes (Gauthier and Wane, 2008) and in getting value for money spent. A recent analysis plots the public-sector efficiency frontier for many countries (Figure 8). Almost every African country is far inside the frontier.
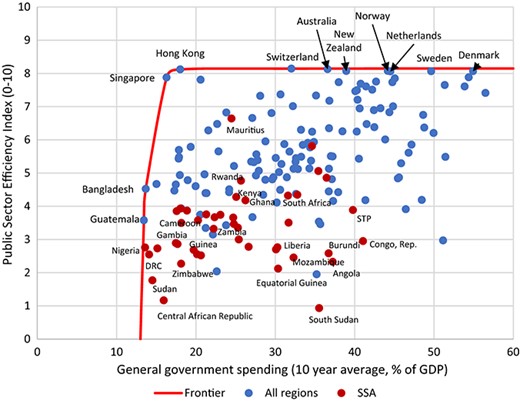
African Countries Are Generally Far From the Public Sector Efficiency Frontier. Source: Authors’ calculations.
As for finance not always being the binding constraint to infrastructure, the most compelling example may be road transport. Everyone agrees that the road system in sub-Saharan Africa is lousy and that this contributes to the subcontinent’s lack of competitiveness. But in a study of the four main transport corridors in Africa, Raballand and Teravaninthorn (2008) show that vehicle operating costs are no higher than in France. What makes African countries different is that transport prices are the highest in the world. The difference between transport prices and costs are the profit margins, which are close to 100 percent.
High profit margins persist because there are regulations in the books of almost every country that prohibit entry into the trucking industry. These regulations were introduced five decades ago when trucking was thought to be a natural monopoly. They persist to this day because the single trucking monopoly has become a powerful force in each country and is able to resist attempts at deregulation. As a result, transport prices are unlikely to decline with wider or better-paved roads. Hence, the debt incurred by borrowing to finance road construction will be difficult to repay if there are no gains in competitiveness of exports.
The general point is that reducing Africa’s infrastructure deficit will require policy and institutional reforms alongside better finance. These will reduce financing needs; conversely, lack of reform increases them. Rozenberg and Fay (2019) show that the money needed to meet infrastructure services in a sustainable way drops from 8.2 percent of GDP to 4.5 percent with policy- and regulation-induced efficiency.
7. Taxation and the marginal cost of funds
Finally, for middle-income countries facing debt problems, the common suggestion is that they rely more on domestic resource mobilisation. This is based on the observation that tax revenue-to-GDP ratios in Africa are lower than what they should be (Glenday et al., 2019). To be sure, South Asia has lower tax to GDP ratios than Africa, but the advice that countries should rely more on taxation for financing public spending is sensible.
Selected MCF Estimates
| Country | Tax type | Estimate | Source |
|---|---|---|---|
| Australia | Labour | 1.19–1.24 | Campbell and Bond (1997) |
| Australia | Labour | 1.28–1.55 | Findlay and Jones (1982) |
| Australia | Capital | 1.21–1.48 | Diewert and Lawrence (1998) |
| Australia | Capital | 1.15–1.51 | Benge (1999) |
| Bangladesh | Sales | 0.95–1.07 | Devarajan et al. (2002) |
| Bangladesh | Import | 1.17–2.18 | Devarajan et al. (2002) |
| Cameroon | Sales | 0.48–0.96 | Devarajan et al. (2002) |
| Cameroon | Import | 1.05–1.37 | Devarajan et al. (2002) |
| Canada | Commodity | 1.25 | Campbell (1975) |
| Canada | Labour | 1.38 | Dahlby (1994) |
| Canada | Labour | 1.39–1.53 | Fortin and Lacroix (1994) |
| China | Sales | 2.31 | Laffont and Senik-Leygonie (1997) |
| India | Excise | 1.66–2.15 | Ahmad and Stern (1987) |
| India | Sale | 1.59–2.12 | Ahmad and Stern (1987) |
| India | Import | 1.54–2.17 | Ahmad and Stern (1987) |
| Indonesia | Sales | 0.97–1.11 | Devarajan et al. (2002) |
| Indonesia | Import | 0.99–1.18 | Devarajan et al. (2002) |
| New Zealand | Labour | 1.18 | Diewert and Lawrence (1994) |
| Sweden | All taxes | 1.69–2.29 | Hansson and Stuart (1985) |
| United States | All taxes | 1.17–1.33 | Ballard et al. (1985) |
| United States | Labour | 1.21–1.24 | Stuart (1984) |
| United States | Labour | 1.32–1.47 | Browning (1987) |
| United States | All taxes | 1.47 | Jorgenson and Yun (1990) |
| United States | Labour | 1.08–1.14 | Ahmed and Croushore (1994) |
Source: Auriol and Warlters (2012). The Marginal Cost of Public Funds and Tax Reform in Africa.
But there are problems in inferring that African countries should therefore raise their tax-to-GDP ratios. First, tax ratios in Africa may be low because the quality of public services is also low, and Africans might not be willing to pay higher taxes unless public services improve. Raising taxes may elicit the sometimes-violent resistance to reducing fuel subsidies. Second, almost all taxes are distortions and impose costs on the economy. In the simplest formulation of the problem, a tax reduces both the consumer and producer surplus but generates tax revenue. However, in terms of the pre-tax economy, there is a fall in total welfare known as the deadweight loss. This is the cost to the economy of raising tax revenues.
The question is whether this cost is significant relative to the revenue raised. The answer is often expressed in terms of the MCF, which is the revenue raised plus the deadweight loss as a share of the revenue raised. The magnitudes are an empirical matter, not a theoretical one. Table 9 below gives the MCF for a number of countries.
Except for Cameroon, there are no African countries in this list. Auriol and Warlters (2012) remedy this neglect by calculating the MCF for 38 African countries. They find that the average MCF across five different tax handles is 1.2. However, there is a variation around that mean, with some countries, including some highly indebted ones, having MCFs of 1.4 or higher. While there does not seem to be a systematic pattern between MCFs and the debt-to-GDP ratio (Figure 9), the bottom line is that recommendations for countries to rely more on domestic taxation should be treated with caution. The deadweight losses from raising taxes may outweigh the benefits from a decreased debt burden. The policy implication is that countries should take up tax reforms before trying to raise revenue as an alternative to debt.
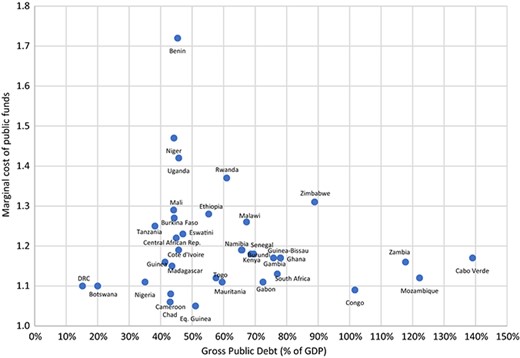
Marginal Cost of Public Funds and Gross Public Debt, Africa Region. Source: Authors’ calculations, using data from the IMF and Auriol and Warlters (2012).
8. Three questions, one answer
This paper has tried to answer some questions on the minds of people. The first is whether the increases in public debt-to-GDP ratios in Africa during the past decade are because of hard-won improvements in institutions and policies or because they were made temporarily creditworthy by HIPC programs and the MDRI. The second is whether African governments are prepared for the vagaries of private debt markets that tend to not discriminate—in good times and bad—between countries with strong and weak economic fundamentals. The third question is whether the resolution of current crises on the subcontinent provides reassurance that a generalised crisis will not precipitate fire sales of public assets and mortgaging of Africa’s natural resources. The answer to all three questions is ‘no’.
The question then is what to do about this. We provide arguments in favor of three steps, ranging from the long term to immediate. The first is to treat commodity price increases as temporary shocks, not permanent changes; this rule applies to every country. The second is become better informed about the difference between the cost of taxation and debt; this gap would vary across countries in Africa. The third is to make sure that the maturity of loans matches the gestation periods of investments; this is especially important for African countries that are becoming dependent on nontraditional lenders such as China and India.
Befitting its nature, we conclude the paper with a question and some speculation. It is inevitable that as African economies grow through middle income, many of them will experience crises. If the larger economies in the subcontinent—Nigeria, South Africa, Angola, Sudan and Kenya—go into debt distress, the likelihood of a region-wide economic crisis will spike. The question is what sub-Saharan Africa’s next debt crisis will look like. Will it look like Latin America’s fiscal crisis of the 1980s when indebted governments could not pay back their foreign creditors? Will it look like East Asia’s financial crisis in the 1990s, when private borrowers could not pay back foreign lenders due to a sudden loss of confidence and precipitous devaluations? Will it look like Southern Europe in the 2000s, when private borrowers and indebted governments brought down otherwise solvent lenders both at home and abroad?
We speculate that Africa’s next crisis will be uniquely African. This is both because African economies are different—in good measure because they depend more on natural resources than those in Asia and Europe—and because the world today is not the same as it was even a decade ago. In the 2000s, Africa was a low-income region that depended on the largesse of high-income economies. Today, it is a middle-income region increasingly interdependent with the middle-income economies of East Asia, South Asia and Latin America. This will make both booms and busts different, in ways that have not been seen before.
The dynamics of African debt will be a learning experience for policymakers and global market players. African policymakers can witness the differences between how Chile managed its economy and what the Venezuelans have done to theirs. Investors around the world will suddenly get to know a lot more about Africa’s 50 economies. Then it might no longer be necessary to always remind foreigners that Africa is a continent, not a country.
Footnotes
†Paper prepared for the Biannual Plenary and Research Workshop of the Africa Economic Research Consortium in Cape Town on 2–6 June 2019. The opinions expressed are those of the authors and do not necessarily represent the views of the World Bank or Georgetown University.
‘Looking ahead, fiscal policy should continue to focus on actions to ensure fiscal sustainability. To this end, fiscal consolidation should be accelerated… Key reform areas are to improve debt management and public financial management … and improving revenue administration. The authorities have an ambitious plan for infrastructure projects that aims to support sustainable growth and poverty reduction. In implementing these projects, it will be important to ensure that their financing preserves debt sustainability and contains fiscal risks. Strengthening public investment management—including through rigorous prioritization of projects and an improved project management framework—as well as oversight and monitoring of state-owned enterprises and other parastatals will be critical to achieving this goal.’
We also looked at the correlation between IMF program and the extent of reduction in gross public debt. The correlation coefficient is −0.25, indicating a positive correlation between being under an IMF program and the reduction in gross public debt to GDP ratio during the projection period.
Agur et al. (2018) conclude that ‘As EM domestic bond markets integrate further internationally and as investors and issuers are better able to borrow, hedge, and arbitrage across countries and currencies, local currency markets are likely to become more liquid but with a heightened sensitivity to external events—shocks from larger markets like the US and Eurozone may be propagated more quickly and have wider global effects. Further, as bond markets develop and cross-border links become more important, issuance of sovereign and 15 corporate debt in local currencies will have benefits but may raise new challenges, with repercussions for EM debt levels, currency mismatches, and issues related to original sin.’
References
Public Debt, Policies and Institutions, Growth and Poverty Reduction, 2010–2020
| Gross public debt (% of GDP) | Overall CPIA Score (1 worst; 6 best) | Change in per capita GDP (cumulative 2010–2020) | Change in poverty from 2010 | Extreme poverty (%) 2019 | |||||
|---|---|---|---|---|---|---|---|---|---|
| 2010 | 2020 | Change | 2010 | 2019 | Change | ||||
| Sudan | 74.6 | 262.5 | 187.951 | 2.5 | 2.2 | −0.3 | −24.4% | −4.54438 | 13.619 |
| Zambia | 18.9 | 117.8 | 98.863 | 3.4 | 3.2 | −0.2 | 3.7% | −7.29687 | 58.521 |
| Angola | 37.2 | 127.1 | 89.952 | 2.8 | −15.8% | 15.29851 | 51.396 | ||
| Mozambique | 39.7 | 122.2 | 82.546 | 3.7 | 3.1 | −0.6 | 21.7% | −6.04005 | 62.290 |
| Cabo Verde | 72.5 | 139.0 | 66.495 | 4.2 | 3.8 | −0.4 | 0.2% | −3.69315 | 2.113 |
| Congo | 43.5 | 101.7 | 58.195 | 2.8 | 2.7 | −0.1 | −34.3% | 14.61319 | 55.649 |
| Gabon | 21.3 | 72.5 | 51.209 | 4.1% | −3.857346 | 3.417 | |||
| Namibia | 16.0 | 65.7 | 49.697 | −3.0% | −5.72529 | 15.953 | |||
| South Sudan | 0.0 | 44.9 | 44.881 | 2.2 | 1.4 | −0.8 | −63.9% | 38.24313 | 80.705 |
| Ghana | 34.6 | 78.0 | 43.431 | 3.8 | 3.6 | −0.2 | 42.9% | −6.88689 | 10.701 |
| Equatorial Guinea | 7.9 | 51.1 | 43.185 | −51.1% | #N/A | 4.428 | |||
| South Africa | 34.7 | 77.1 | 42.388 | −8.2% | 3.49941 | 19.672 | |||
| Rwanda | 18.7 | 61.0 | 42.213 | 3.8 | 4 | 0.2 | 46.4% | −15.4153 | 48.970 |
| Zimbabwe | 47.6 | 88.9 | 41.296 | 1.9 | 3 | 1.1 | 7.0% | 12.93393 | 39.530 |
| Malawi | 27.2 | 67.3 | 40.072 | 3.4 | 3.2 | −0.2 | 6.2% | −3.58136 | 67.553 |
| Liberia | 24.0 | 61.8 | 37.788 | 2.8 | 2.9 | 0.1 | −4.4% | −14.27423 | 48.171 |
| Senegal | 28.5 | 65.8 | 37.313 | 3.7 | 3.7 | 0 | 17.9% | −10.22085 | 27.499 |
| Eswatini | 13.8 | 47.1 | 33.246 | 11.3% | −12.41151 | 27.533 | |||
| The Gambia | 42.9 | 75.8 | 32.878 | 3.3 | 3 | −0.3 | −8.1% | −17.298954 | 7.978 |
| Mauritius | 55.1 | 87.8 | 32.655 | 14.5% | −0.3680839 | 0.125 | |||
| Niger | 15.1 | 44.2 | 29.143 | 3.3 | 3.4 | 0.1 | 15.1% | −16.00582 | 39.290 |
| Cameroon | 14.7 | 43.2 | 28.466 | 3.2 | 3.3 | 0.1 | 12.0% | −9.86419 | 22.771 |
| Uganda | 18.4 | 45.7 | 27.389 | 3.9 | 3.7 | −0.2 | 16.1% | −5.59973 | 38.017 |
| Nigeria | 9.4 | 35.1 | 25.661 | 3.5 | 3.2 | −0.3 | −1.9% | −15.34868 | 39.198 |
| Sierra Leone | 46.8 | 71.9 | 25.098 | 3.2 | 3.1 | −0.1 | 16.3% | −18.18587 | 40.063 |
| Central African Republic | 19.9 | 44.9 | 25.049 | 2.6 | 2.6 | 0 | −23.4% | 9.1625 | 70.760 |
| Benin | 21.0 | 45.4 | 24.387 | 3.5 | 3.6 | 0.1 | 20.4% | −9.26881 | 43.382 |
| Kenya | 44.4 | 68.7 | 24.284 | 3.7 | 3.7 | 0 | 28.8% | −9.80536 | 31.254 |
| Togo | 34.3 | 57.6 | 23.279 | 2.8 | 3.3 | 0.5 | 28.3% | −10.61341 | 45.290 |
| Burundi | 46.9 | 69.5 | 22.601 | 3.1 | 2.9 | −0.2 | −13.9% | 3.95854 | 79.526 |
| Mali | 25.3 | 44.2 | 18.861 | 3.7 | 3.4 | −0.3 | 5.9% | −7.90575 | 42.263 |
| Burkina Faso | 27.8 | 44.3 | 16.562 | 3.8 | 3.5 | −0.3 | 24.3% | −19.82313 | 32.825 |
| Guinea-Bissau | 61.7 | 78.1 | 16.34 | 2.6 | 2.5 | −0.1 | 10.0% | −5.73944 | 62.652 |
| Lesotho | 34.1 | 50.3 | 16.169 | 3.5 | 3.3 | −0.2 | 4.9% | −13.58359 | 28.496 |
| Seychelles | 82.2 | 98.4 | 16.151 | 15.0% | −1.0328124 | 0.399 | |||
| Ethiopia | 39.6 | 55.3 | 15.655 | 3.4 | 3.5 | 0.1 | 105.0% | −16.44101 | 19.540 |
| Mauritania | 43.9 | 59.5 | 15.587 | 3.2 | 3.4 | 0.2 | 9.0% | −4.867837 | 5.348 |
| Chad | 30.1 | 43.0 | 12.952 | 2.5 | 2.8 | 0.3 | −12.2% | 4.41097 | 41.037 |
| Madagascar | 32.3 | 43.6 | 11.239 | 3.5 | 3.3 | −0.2 | −2.4% | −1.62475 | 76.552 |
| Tanzania | 27.2 | 38.2 | 11.026 | 3.8 | 3.5 | −0.3 | 34.4% | −6.68857 | 47.716 |
| Sao Tome and Principe | 79.5 | 81.4 | 1.846 | 2.9 | 3 | 0.1 | 5.8% | 0.85883 | 35.452 |
| Cote d’Ivoire | 45.6 | 45.7 | 0.095 | 2.8 | 3.5 | 0.7 | 41.1% | −10.98965 | 22.064 |
| Botswana | 20.4 | 20.0 | −0.408 | 14.5% | −3.21616 | 13.090 | |||
| Comoros | 30.5 | 26.8 | −3.652 | 2.5 | 2.8 | 0.3 | 0.6% | 0.22909 | 18.318 |
| DRC | 30.6 | 15.2 | −15.416 | 2.7 | 2.9 | 0.2 | 23.7% | −14.81626 | 70.995 |
| Guinea | 68.9 | 41.4 | −27.474 | 2.8 | 3.2 | 0.4 | 40.7% | −32.21484 | 21.260 |
Source: Author’s calculations, based on World Bank and IMF data.
Change in Quality of Policies and Institutions Between 2010 and 2019
| Change in CPIA (2019–2010) | |||||||||
|---|---|---|---|---|---|---|---|---|---|
| Overall score | Economic management cluster | Structural policies | Public sector management and institutions | Macroeconomic management | Debt policy | Financial sector | Quality of budgetary and financial management | Efficiency of DRM | |
| Sudan | −0.3 | −0.8 | 0.0 | −0.1 | −2.0 | 0.0 | 0.0 | 0.5 | −0.5 |
| Zambia | −0.2 | −0.8 | 0.2 | −0.1 | −1.0 | −0.5 | 0.0 | −0.5 | 0.0 |
| Angola | −2.8 | −3.0 | −2.8 | −2.4 | −3.0 | −3.0 | −2.5 | −2.5 | −2.5 |
| Mozambique | −0.6 | −1.7 | −0.3 | −0.3 | −1.0 | −2.5 | −0.5 | −0.5 | 0.0 |
| Cabo Verde | −0.4 | −1.0 | 0.0 | 0.0 | −0.5 | −1.5 | −0.5 | −0.5 | 0.5 |
| Congo | −0.1 | −0.5 | −0.3 | 0.1 | −0.5 | −1.0 | −0.5 | 0.5 | 0.0 |
| Gabon | |||||||||
| Namibia | |||||||||
| South Sudan | 1.4 | 1.0 | 1.8 | 1.4 | 1.0 | 1.0 | 2.0 | 1.0 | 2.0 |
| Ghana | −0.2 | −0.3 | −0.5 | −0.1 | 0.0 | −0.5 | −1.0 | 0.0 | −0.5 |
| Equatorial Guinea | |||||||||
| South Africa | |||||||||
| Rwanda | 0.2 | 0.2 | 0.3 | 0.1 | 0.0 | 0.5 | 0.0 | 0.0 | 0.5 |
| Zimbabwe | 1.1 | 0.8 | 0.5 | 0.8 | 0.5 | 1.0 | 0.5 | 1.0 | 0.5 |
| Malawi | −0.2 | −0.3 | 0.2 | −0.4 | 0.5 | 0.0 | 0.5 | 0.0 | 0.0 |
| Liberia | 0.1 | −0.3 | 0.0 | −0.1 | −0.5 | 0.0 | 0.0 | 0.5 | −0.5 |
| Senegal | 0.0 | −0.2 | 0.0 | 0.0 | 0.0 | 0.0 | 0.0 | 0.0 | −0.5 |
| Eswatini | |||||||||
| The Gambia | −0.3 | −1.2 | −0.3 | 0.0 | −1.5 | −1.0 | −1.0 | −0.5 | 0.0 |
| Mauritius | |||||||||
| Niger | 0.1 | 0.0 | 0.0 | −0.1 | 0.0 | 0.0 | −0.5 | −0.5 | 0.0 |
| Cameroon | 0.1 | 0.2 | 0.2 | 0.1 | 0.0 | 0.5 | 0.0 | 0.5 | 0.0 |
| Uganda | −0.2 | 0.0 | −0.2 | 0.0 | −0.5 | 0.5 | 0.0 | 0.0 | 0.0 |
| Nigeria | −0.3 | −0.8 | −0.5 | −0.1 | −1.0 | −0.5 | −1.0 | 0.0 | 0.0 |
| Sierra Leone | −0.1 | −0.5 | −0.2 | 0.2 | −0.5 | −0.5 | −0.5 | 0.0 | 0.5 |
| Central African Republic | 0.0 | −0.3 | −0.2 | −0.1 | 0.0 | −0.5 | 0.0 | −0.5 | 0.0 |
| Benin | 0.1 | 0.7 | −0.3 | 0.1 | 0.0 | 1.0 | −1.0 | 0.0 | 0.0 |
| Kenya | 0.0 | −0.2 | −0.3 | 0.1 | 0.0 | 0.0 | −1.0 | 0.0 | 0.0 |
| Togo | 0.5 | 0.3 | 0.2 | 0.5 | 1.0 | 0.0 | 0.0 | 0.0 | 0.5 |
| Burundi | −0.2 | −0.7 | 0.2 | −0.3 | −1.0 | −0.5 | 0.0 | −0.5 | 0.0 |
| Mali | −0.3 | −0.2 | −0.2 | −0.3 | −0.5 | 0.0 | 0.0 | 0.5 | 0.0 |
| Burkina Faso | −0.3 | −0.7 | 0.0 | −0.5 | −0.5 | 0.0 | 0.0 | −1.0 | −0.5 |
| Guinea-Bissau | −0.1 | 0.2 | −0.2 | −0.6 | 0.0 | 0.5 | −0.5 | −0.5 | −0.5 |
| Lesotho | −0.2 | −0.7 | 0.3 | −0.4 | −0.5 | −0.5 | 0.0 | −1.0 | 0.0 |
| Seychelles | |||||||||
| Ethiopia | 0.1 | −0.2 | 0.0 | 0.2 | 0.0 | 0.0 | 0.0 | 0.0 | 0.0 |
| Mauritania | 0.2 | 0.2 | 0.0 | 0.3 | 0.0 | −0.5 | 0.0 | 0.5 | 0.5 |
| Chad | 0.3 | 0.5 | 0.2 | 0.3 | 1.0 | 0.0 | 0.0 | 0.5 | 0.0 |
| Madagascar | −0.2 | 0.2 | 0.0 | −0.3 | 0.5 | 0.0 | 0.0 | 0.0 | 0.0 |
| Tanzania | −0.3 | −0.2 | −0.5 | −0.3 | 0.0 | 0.0 | −1.0 | −0.5 | −1.0 |
| Sao Tome and Principe | 0.1 | 0.0 | 0.0 | 0.0 | 0.0 | 0.0 | 0.0 | 0.0 | −0.5 |
| Cote d’Ivoire | 0.7 | 1.0 | 0.0 | 1.1 | 0.5 | 1.5 | 0.0 | 1.5 | 0.0 |
| Botswana | |||||||||
| Comoros | 0.3 | 0.5 | 0.2 | 0.1 | 0.0 | 1.0 | 0.0 | 0.5 | 0.0 |
| DRC | 0.2 | −0.2 | 0.7 | 0.3 | −0.5 | 0.5 | 0.5 | 0.0 | 0.5 |
| Guinea | 0.4 | 1.2 | 0.0 | 0.3 | 1.5 | 1.0 | −0.5 | 0.0 | 0.5 |
Source: Author’s calculations, based on World Bank reports.
IMF Projections of Public Debt and Economic Growth (Program and Non-Program Countries)
| IMF program | Change from date of arrangement | Change from 2019 | Avg. growth (2010–2015) | Avg. growth (2015–2019) | |||
|---|---|---|---|---|---|---|---|
| Public debt (pp) | Growth (%) | Public debt (pp) | Growth (%) | ||||
| Angola | 1 | −21.79 | 1.59 | −39.90 | 1.91 | 4.52 | −1.34 |
| Benin | 1 | −0.90 | 5.82 | −2.53 | 5.55 | 4.60 | 5.63 |
| Burkina Faso | 1 | 9.19 | 4.77 | 4.17 | 4.64 | 5.42 | 6.16 |
| Cameroon | 1 | −1.90 | 3.75 | −5.90 | 3.68 | 5.12 | 4.03 |
| Central African Republic | 1 | −13.84 | 4.03 | −13.84 | 4.03 | −6.18 | 4.01 |
| Chad | 1 | −14.91 | 2.70 | −8.93 | 2.71 | 4.62 | −0.73 |
| Cote d’Ivoire | 1 | 9.13 | 5.84 | 4.76 | 5.64 | 6.42 | 6.92 |
| Gabon | 1 | −11.02 | 2.39 | −7.68 | 2.39 | 5.23 | 1.83 |
| Guinea | 1 | −1.32 | 5.30 | 2.38 | 5.13 | 4.59 | 8.22 |
| Malawi | 1 | 21.80 | 4.83 | 22.01 | 4.88 | 4.11 | 3.48 |
| Mauritania | 1 | 0.82 | 3.73 | −0.61 | 3.70 | 4.49 | 3.10 |
| Niger | 1 | 2.18 | 7.05 | −1.13 | 7.19 | 5.81 | 5.96 |
| Sierra Leone | 1 | −12.43 | 3.55 | −15.00 | 3.27 | 4.21 | 4.77 |
| Togo | 1 | −2.66 | 4.50 | 0.80 | 4.30 | 6.14 | 5.09 |
| Republic of the Congo | 1 | −25.44 | 0.54 | −25.44 | 0.54 | 2.81 | −5.60 |
| Equatorial Guinea | 1 | −2.26 | −2.35 | −2.26 | −2.35 | 0.19 | −6.61 |
| Ethiopia | 1 | −16.90 | 6.97 | −16.90 | 6.97 | 10.14 | 8.73 |
| Liberia | 1 | −6.36 | 3.83 | −6.36 | 3.83 | 5.06 | −0.13 |
| Mali | 1 | 4.85 | 3.97 | 4.85 | 3.97 | 3.55 | 5.17 |
| Sao Tome and Principe | 1 | −21.40 | 2.67 | −21.40 | 2.67 | 4.53 | 3.09 |
| Guinea-Bissau | 0 | −0.26 | 3.48 | −0.26 | 3.48 | 3.29 | 4.49 |
| Madagascar | 0 | 6.05 | 4.80 | 11.85 | 3.46 | 2.67 | 3.88 |
| Botswana | 0 | 9.41 | 4.80 | 14.52 | 2.83 | 4.78 | 3.68 |
| Burundi | 0 | −1.86 | 3.29 | 7.52 | 2.62 | 2.69 | 0.83 |
| Cabo Verde | 0 | −25.57 | 2.92 | −25.57 | 2.92 | 1.49 | 4.65 |
| Comoros | 0 | 15.32 | 2.49 | 8.64 | 2.58 | 3.03 | 3.28 |
| DRC | 0 | −10.83 | 3.97 | −10.83 | 3.97 | 7.76 | 4.07 |
| Eswatini | 0 | 6.99 | 1.64 | 14.25 | 0.91 | 2.91 | 1.93 |
| Gambia, The | 0 | −33.72 | 5.41 | −29.23 | 5.32 | 0.40 | 5.00 |
| Ghana | 0 | 22.23 | 4.87 | 21.56 | 4.65 | 6.91 | 6.07 |
| Kenya | 0 | 5.99 | 5.34 | 5.99 | 5.34 | 5.52 | 5.59 |
| Lesotho | 0 | −11.49 | 3.07 | −10.51 | 1.94 | 3.45 | −0.21 |
| Mauritius | 0 | 7.38 | 4.31 | 12.36 | 1.17 | 3.65 | 3.61 |
| Mozambique | 0 | −24.91 | 6.02 | −24.91 | 6.02 | 7.15 | 3.32 |
| Namibia | 0 | 12.21 | 1.25 | 12.21 | 1.25 | 5.22 | −0.39 |
| Nigeria | 0 | 7.80 | 1.72 | 7.80 | 1.72 | 4.70 | 0.82 |
| Rwanda | 0 | 13.27 | 5.88 | 13.27 | 5.88 | 7.26 | 6.96 |
| Senegal | 0 | −8.48 | 6.35 | −8.48 | 6.35 | 4.05 | 6.09 |
| Seychelles | 0 | 18.86 | 0.94 | 18.86 | 0.94 | 4.90 | 3.15 |
| South Africa | 0 | 17.83 | 1.73 | 32.75 | 0.44 | 2.20 | 0.69 |
| South Sudan | 0 | −9.73 | 3.39 | −9.73 | 3.39 | N/A | −5.23 |
| Sudan | 0 | −35.20 | 1.79 | −35.20 | 1.79 | −2.67 | −0.19 |
| Tanzania | 0 | −2.27 | 4.13 | −2.27 | 4.13 | 6.54 | 6.89 |
| Uganda | 0 | 7.73 | 4.90 | 7.73 | 4.90 | 5.39 | 5.36 |
| Zambia | 0 | 40.24 | 0.59 | 40.24 | 0.59 | 5.16 | 3.18 |
| Zimbabwe | 0 | 21.46 | 0.10 | −57.03 | 1.22 | 7.20 | 0.27 |
Source: Authors’ calculations, using IMF data.
Note: Green is good, red is bad.
