


Abstract
Over 50% of African countries had debt to GDP ratios above 50% in 2019 with at least 48% of countries having debt to GDP ratios above 70%. The rise in debt levels is a recent phenomenon, with most countries’ debt increasing between 2014 and 2019. In this paper, we propose a new approach to debt monitoring. We argue that the speed of debt accumulation matters and that monitoring the speed of debt could alter the path of debt to more sustainable debt levels. We carry out an empirical analysis for all African countries in the 10 years to 2018 and group countries into seven categories based on their speed of growth of debt and their debt levels. We find that there is heterogeneity in country debt acquisition and that ensuing policies to ensure sustainable debt will need to be country specific.
1. Rapidly rising debt levels, a symptom of waning macroeconomic stability and possible slow-down in growth
Several research in both developed (Reinhart and Rogoff, 2013; Reinhart et al., 2014) and developing (Presbitero, 2012) countries find that large debt levels have adverse effects for economic growth, through crowding out physical capital. However, the extents to which large levels of debt negatively affect economic growth are conditional on factors such as institutional quality and business cycle.
A historical analysis over three and a half decades shows a negative correlation between high debt levels and gross domestic product (GDP) growth for African countries (see Figure 1). In the 1980s and 1990s, since governments were a key driver of growth, as debt levels increased and fiscal space narrowed considerably, governments reduced spending on physical and human capital, resulting in detrimental effects for growth.
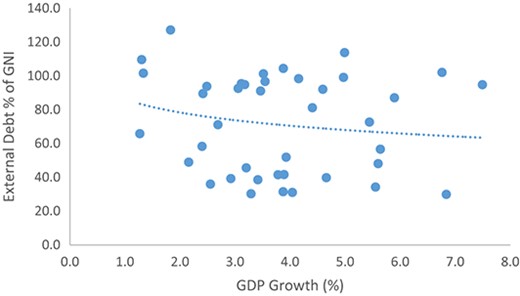
There is a Negative Link Between Increasing Public Debt and Sustainable Growth. Note: Africa Average (1980–2019)
The unexpected headwind in 2020, the Coronavirus (COVID-19) pandemic, primarily a health crisis with adverse economic effects, requires countries to adopt expansionary fiscal policy to save lives and livelihoods. Nonetheless, as countries transition out of the pandemic, it will become increasingly important to rein in spending, manage debt levels and strengthen macroeconomic stability to better cope with the next pandemic, which have become more frequent in nature.
As at end of 2019, before the onset of the COVID-19 pandemic, the Sustainable Development Goals (SDGs) monitoring reports showed that African countries were not on track to achieve all goals. The pandemic will likely derail efforts to achieve the SDGs further, with adverse effects for fiscal space as countries adopt policies that scale up spending to muddle through the crisis. Without a doubt, both developed and developing countries alike will transition out of the crisis with narrow fiscal space, higher debt levels and with most economies experiencing contraction.1 The COVID-19 crisis is a crisis like no other, it is therefore imperative that countries consider creative and alternative measures to ensure sustainable debt as they transition through and out of the crisis.
In this paper, we analyse debt dynamics in Africa specifically after the highly indebted poor countries (HIPCs) period. We propose a new lens through which countries and policy makers alike should monitor and address issues of debt build up and finally offer a new categorisation of African countries based on their debt dynamics into new segments for policy action. The paper also emphasises the need for sound fiscal policy as an essential element of a sound debt management instrument in addition to monetary policy.
1.1 An overview of debt levels in Africa over the past decade
A review of 52 African countries, between 2010 and 2019, shows that the number of countries with debt to GDP ratios below 50% has been steadily declining, an indication that African countries have increasingly taken on more debt (Figure 2). The number of African countries with debt to GDP ratios below 50% halved from 42 in 2012 to 21 in 2017, before increasing to 25 in 2019 (Figure 2).
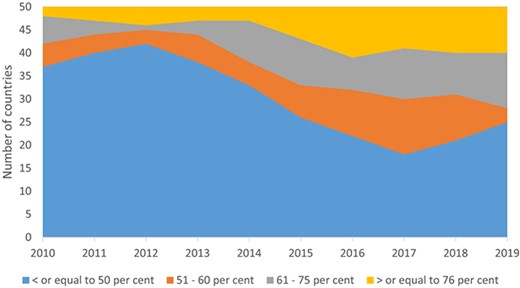
The Number of Countries With Debt to GDP Levels Above 50% Rose
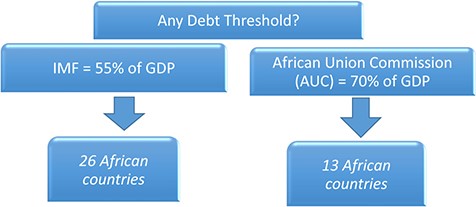
In contrast, the number of countries with debt to GDP ratios above 75% almost doubled between 2014 and 2019 from about 6 to 11, which is a reflection of increased borrowing as markets remained benign attributable to lower expected yields in Europe and the USA. Similarly, the number of countries breaching the IMF debt to GDP threshold of 55% more than doubled from 12 to 26 between 2012 and 2019 (Figure 3).
The Number of Countries Breaching the IMF Debt Threshold More Than Doubled
High Infrastructure Financing Needs Remain
| 2014 | 2015 | 2016 | 2017 | 2018 | |
|---|---|---|---|---|---|
| Transport | 32.4 | 32.4 | 26.2 | 34.0 | 32.5 |
| Water | 9.4 | 7.5 | 12.2 | 13.2 | 13.5 |
| Energy | 24.1 | 33.5 | 20.6 | 24.8 | 43.8 |
| ICT | 2.4 | 2.4 | 1.7 | 2.3 | 7.1 |
| Multi-sector | 5.3 | 3.1 | 6.2 | 7.3 | 4.1 |
| Total | 75.4 | 78.9 | 66.9 | 81.6 | 100.8 |
The COVID-19 crisis, coupled with rising domestic pressures, will aggravate the rise in debt levels in the medium term. The rise in infrastructure financing needs for African countries has been broad based, increasing from US$75.4 billion in 2014 to US$100.8 billion in 2018. The energy sector experienced the largest increase in financing needs, from US$24.1 billion in 2014 to US$43.8 billion in 2018. This is followed by the information and communication technologies (ICT) and water sectors, which also saw large increases in financing needs from 2014 to 2018. The need for African countries to adopt a state-of-the-art technology to spur productivity and increase output has necessitated the desire for increased investment in ICT. The ICT financing needs increased threefold to US$7.1 billion in 2018, compared to US$2.4 billion in 2014. Similarly, the water sector financing needs also increased by US$4.1 over the period 2014–2018. The large financing needs for energy, ICT and water are a reflection of the rapidly rising African population, who require energy and water for agriculture, household and industry in addition to building overall ICT infrastructure.
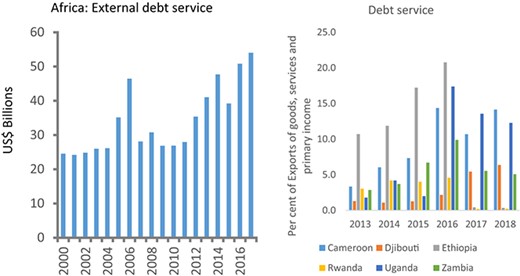
Nonetheless, as global growth weakens and global financial markets tighten, access to affordable financing for African countries will decline, with debt service costs expected to increase. A historical analysis of debt service in absolute terms for African countries observes a rapid rise in external debt service between 2012 and 2018 (Figure 4). The rise is attributable to an increase in the uptake of commercial external debt, as the traditional concessional lending and non-tax revenues such as grants decline.
External Debt Service Rose Rapidly Between 2013 and 2018
An analysis of debt service to export ratio for six countries (Cameroon, Djibouti, Ethiopia, Rwanda, Uganda and Zambia) finds that debt service to exports broadly increased between 2013 and 2018, reflecting rising financing pressures at a faster pace than growth of exports for African countries (Figure 4). While a slower pace of growth of exports is an indication of declining fiscal space and has debt sustainability implications for external debt, the key challenge for African countries is the need to invest in infrastructure that will ease supply side constraints and leapfrog growth in the manufacturing sector, hence strengthening growth of exports (Figure 5).
Slower Export Growth Led to Exchange Rate Pressures (Local Currency to Dollar)
2. Are debt levels sustainable? Two key premises on debt sustainability in the African context
2.1 Infinitely sustainable debt becoming a reality?
In the aftermath of the 2008 financial crisis, and with the introduction of non-conventional monetary and fiscal policies to help arrest the declines in growth and shore up economies particularly in Europe and America, traditional economic theory has come under strain. One such area is around the sustainable levels of debt. What does debt accumulation mean in negative interest environments?
Debt levels, globally, have taken an upward trend. An analysis of government debt in the G7 countries reveals debt to GDP ratios above 70% for six of the seven countries in 2019.2 However, for these advanced economies, recent studies show that debt remains sustainable, since the interest–growth differentials remained below zero, averaging −0.8 between 1960 and 2016 (Blanchard, 2019; Barret, 2018).
Interest-growth differentials have important consequences for debt sustainability, when interest rates are higher than growth rates, the growth rate of debt is fast paced, with a higher possibility of default. Consequently, governments must adjust fiscal deficits to ensure debt contracts. At higher debt levels, with positive interest-growth differential, fiscal surpluses are desirable to pay down debt obligations.
Barret (2018) has some interesting findings and policy implications for policy makers in advanced countries. Interest-growth differentials are much lower today than they were 20 years ago. But even more important, the average interest-growth differential over the long run was negative. For the seven advanced economies, long-run low interest-growth differentials are the norm, which creates the possibility for advanced countries to take on more debt sustainably.3 These papers, however, do not address the consequences of a sudden turn-around in interest rates with a fiscal response, which has a longer adjustment period.
2.2 Debt with positive interest rates
Interest rates dipped globally after the crisis and continued for half a decade on. As a result, most African countries were able to gain market access with fiscal surplus and interest payments well within acceptable limits. Market accessibility led to an increase in the uptake of external debt as countries issued Eurobonds. The increase in external debt became even more apparent after the 2014 commodity price shocks, reflecting a decline in government revenues for commodity exporters such as Nigeria and Angola.
In this paper, we analyse debt dynamics in Africa specifically after the HIPC period. We propose a new lens through which countries and policy makers alike should monitor and address issues of debt build up and finally offer a new categorisation of African countries based on their debt dynamics into new segments for policy action. The paper also emphasises the need for sound fiscal policy as an essential element of a sound debt management instrument in addition to monetary policy.
A general look at real interest rates for Africa shows that domestic interest rates have been high since 2001 (Figure 6).4 Real interest rates on the continent spiked in 2007, as Central Banks mopped up excess liquidity, and thereafter experienced a drop as the continent begun to feel the biting effects of the global financial crisis. Since 2009, interest rates remained below 10%, rising slightly in 2014. With global growth expected to slow down, interest rates in the global North are likely to dip.
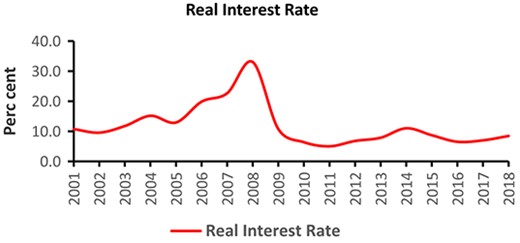
Interest Rates Have Been Consistently Higher Than GDP Growth Rates
While the Africa average real interest rate masks country specific variances, and since African countries are all interest rate takers, external interest rates matter. However, both external interest rates and domestic interest rates on debt vary from country to country. Domestic interest payment for Ghana and Kenya averaged 7.0% and 4.0% between 2014 and 2017, while external interest payment averaged 2.2% and 1.6% over the same period (Figure 7).5 For both countries, interest-growth differentials were high between 2014 and 2017.
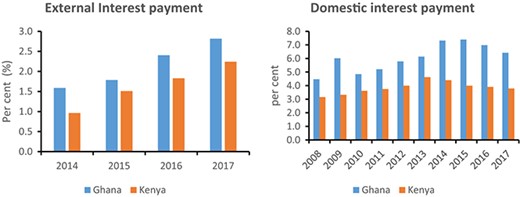
Domestic Debt Has Been Costly for Ghana and Kenya
In contrast, countries such as Eswatini, Rwanda and Senegal that experienced a fast-paced growth in debt between 2008 and 2017, experienced increases for both domestic and external interest rate payment on debt (Figure 8). Eswatini that had external interest payment as high as 4.5%, saw a decline to about 1.0% in 2017, while domestic interest payments that were as low as 1.8% in 2009, increased to about 6.0% in 2017. The change in interest payment on both external and domestic debt for Eswatini is perhaps a reflection of substitution of domestic debt for external debt.
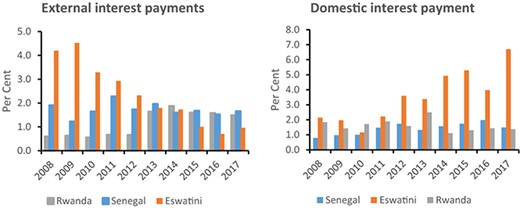
For Other Countries, Both Domestic and External Cost of Debt Trended Upwards
3. Acceleration at multiple speeds and shades
Most analysis reviews debt levels as a key indicator of debt sustainability. Normally, debt thresholds that indicate whether a country’s debt is sustainable or unsustainable are assigned to countries as is the case with the debt sustainability analysis.6 In most cases, a breach of the debt level threshold has unfavourable implications, including lower country ratings and higher cost of borrowing. However, periodic diagnostics of debt could infer the pace at which a country is approaching the debt level threshold, thereby providing opportunities for countries to adjust their policies and take a different path.
In this paper, we argue that the speed of growth of debt is an important indicator that African countries can use to determine if the debt path they have taken is sustainable. While the speed of debt is a necessary indicator of future debt sustainability, it is not sufficient and is conditional on fundamentals such as the flow of debt, the cost of debt and ability to repay.
We proceed with a review of the growth rate of debt for African countries between 2000 and 2019.7 During the period before 2008, several African countries benefitted from the HIPCs debt forgiveness program. Debt levels that were on average above 90% of GDP, with most of it comprising external debt, came down to an average below 40% of GDP at the turn of the century.
The downward trajectory on debt moderated in 2011, after which debt levels begun an upward trend. Between 2010 and 2014, Africa’s debt contracted on average by −0.7% (Figure 9). However, after 2015, growth of debt picked up, averaging 8.8% between 2015 and 2019 (Figure 10). The rise in debt resulted from decline in revenue for oil importing African countries after the 2014 commodity price shock. For most oil importers, borrowing increased after the 2008 crisis. Moreover, as markets became accessible, and given that African countries had wider fiscal space after completion of HIPC debt forgiveness, in addition to more stable macroeconomies, African countries acquired more commercial debt. Going forward, it is expected that countries debt-to-GDP levels will increase on account of expansionary fiscal policy aimed at maximising recovery due to the COVID-19 pandemic (Figure 11).
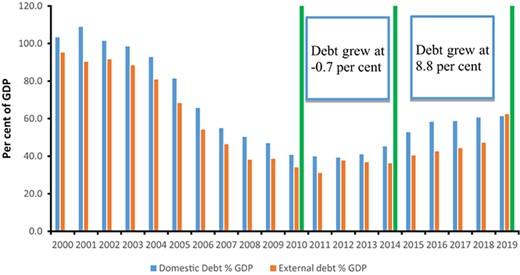
Africa’s Debt Has Taken an Upward Trend, Growing at an Accelerated Speed in Recent Years
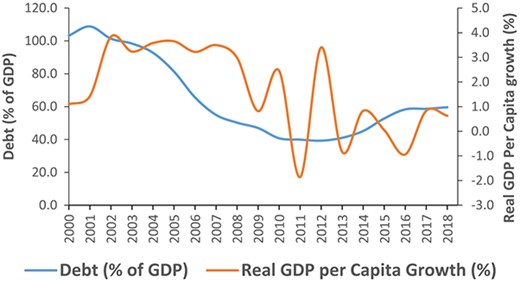
Debt Levels Mirrored GDP Per Capita Growth. Source: World Bank, International Monetary Fund (2021)
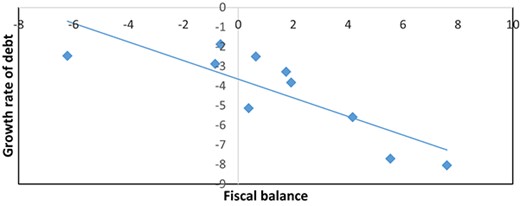
Widening Fiscal Deficit is Correlated to Growth Rate of Debt (2008–2019). Source: World Bank, International Monetary Fund (2021)
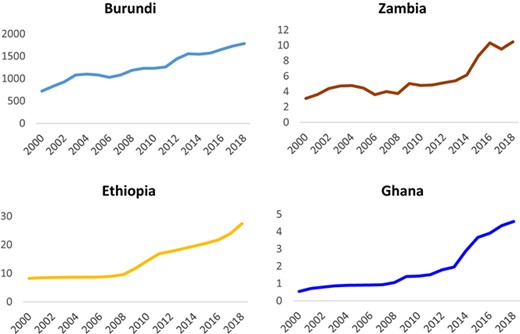
Nevertheless, the 8.8% average growth rate of debt between 2015 and 2019 hides the differences between countries. For instance, Algeria, Angola, Burundi, Congo Republic, Equatorial Guinea, Eritrea, Eswatini, Mozambique, Sierra Leone, Sudan and Zambia were some of the countries with growth rates of debt above 5% between 2015 and 2019. Out of these countries, Angola, Mozambique, Sudan and Zambia have debt growth levels above the 8.8% average over the 2015–2019 period. In contrast, Cote d’Ivoire, Guinea-Bissau, Malawi, Mauritius, Morocco and Seychelles had debt growth rates below 5% between 2015 and 2019.
2015 and 2018 had debt-to-GDP ratios below 40% in 2018 (Guinea, Lesotho, Madagascar and Tanzania).
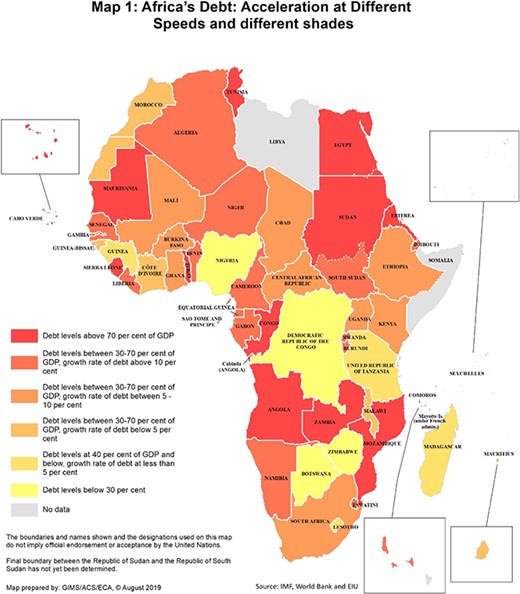
From map 1, the dark orange (South Sudan, Burkina Faso and Ghana) and lighter orange (Ethiopia, Kenya, South Africa) coded countries are countries where the rate of growth of debt is faster than the average indicating high probability that the debt levels will become unsustainable in the near future. In addition, in these countries the rate of growth of debt is not matched by contraction in current expenditure or an increase in revenues. Countries whose debt levels grew at above 10% are particularly at risk since they borrow at a fast pace. Countries require different structural reforms to ensure they do not get to a high risk status.
3.1 Key structural issues that may have adverse effects on pace of debt accumulation.
Theory underpins interest rates and flow of debt as key binding constraints for debt sustainability. In the long run, for debt to be sustainable, interest rate payment on debt must be lower than the economy’s growth rates. However, fiscal deficit can be used to make intertemporal adjustments in the short run.
Furthermore, the ability of a country to repay its debt is critical for debt sustainability. For small open economies such as all African countries, the ability to repay foreign currency debt is often influenced by external conditions. Shocks such as low commodity prices, and therefore lower foreign exchange earnings for commodity exporters, place countries at risk of debt distress.
To estimate the marginal effect of interest rates, fiscal deficit and ability to pay foreign debt, on the growth rate of debt, we run a fixed-effects panel data regression for 39 African countries over a 10-year period. We begin the analysis with a look at correlations for the entire panel, and then for specific countries.
Overall, fiscal deficits, which are the flow of debt, are negatively correlated to the growth rate of debt as shown in Figure 12. Lower fiscal deficits/higher fiscal surpluses are associated with slower growth rates of debt, while widening fiscal deficits are associated with increasing debt. In particular, an analysis of three countries (Ghana, Tunisia and Kenya) that had fiscal deficits averaging above 5.0% between 2008 and 2019 shows a corresponding growth rate of debt that averaged above 3.5% for all three, with Ghana’s debt growth rate averaging 9.1% during the same period.8 At lower levels of debt, high fiscal deficits will have a larger effect on the growth rate of debt, while at large debt levels, the effect is slower growth rate of debt, due to base effects.
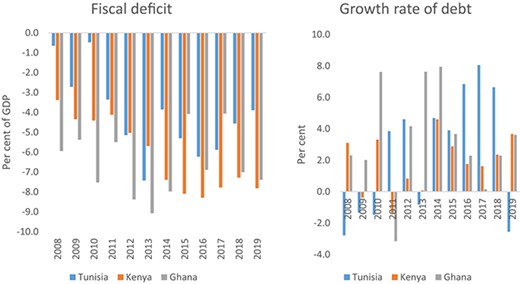
Countries With the Highest Fiscal Deficits Had the Highest Growth Rates of Debt
Likewise, wider current account balances are correlated with faster growth rate of debt (Figure 13). Wider current account balances for African countries are often a reflection of increased investments, lower savings and lower government revenue. Over the past decade, African governments have ramped up infrastructure spending in an effort to ease supply side constraints and strengthen growth. Since the growth rate of domestic savings is much lower than domestic investments, the result has been wider current account balances as imports for infrastructure development increase.
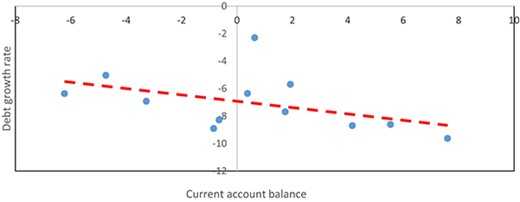
Widening Current Account Deficit is Correlated to Faster Growth of Debt (2008–2019)
An analysis of Ethiopia and South Africa shows a large effect of current account balances on growth rate of debt. In 2008 and 2009, Ethiopia’s current account widened to above 6%. In the subsequent years, debt grew by above 10%. Similarly, as the current account balance widened for South Africa, the debt growth rates increased, by more than 10% in some cases (Figure 14).
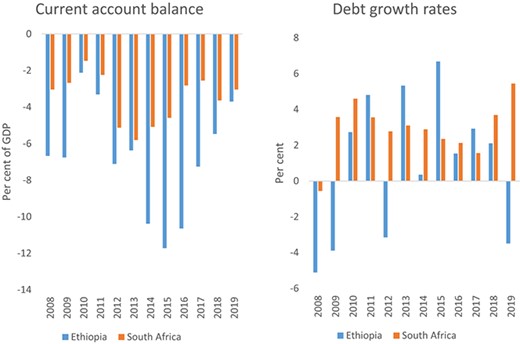
Pace of Growth in Countries With Relatively High Current Account Deficits
Unlike fiscal deficit and the current account balance, real Central Bank rates are not correlated to the speed of growth of debt. There are several reasons why Central Bank rates may not be correlated to the speed of growth of debt. First, since African countries have large infrastructure deficits, interest rates may not be the most important determinant for borrowing. Second, a large portion of debt for African countries is from external borrowing, with about 30% of external borrowing as concessional debt.9 Finally, since financial markets are not well developed, the risk-free interest rates on Treasury Bills are normally determined either by the government or by a few players who monopolise the market.
In like manner, interest rate payment on debt, for both domestic and external debt, has no correlation with the speed of growth of debt, likely a reflection of the importance of other factors that determine borrowing for African countries.
3.2 Estimating the relationship between speed of growth of debt and three key acceleration factors
Table 2 below outlines the marginal effects of what we describe as the acceleration factors on speed of debt and level of debt.10 Both fiscal deficit and a negative current account balance have the effect of increasing the speed of debt. However, while interest payments have a negative relationship with level of debt, they tend to increase the speed of debt, although its effect on the former is marginally significant, statistically.
Marginal Effects of Acceleration Factors on Speed of Debt
| Growth rate of debt (%) | Level of debt (log) | |
|---|---|---|
| Fiscal balance (US$) | −0.001 | −8.63 |
| Current account balance (US$) | −0.001 | −5.59 |
| Interest payment (%) | 1.025 | −0.05 |
| Growth rate of debt (%) | Level of debt (log) | |
|---|---|---|
| Fiscal balance (US$) | −0.001 | −8.63 |
| Current account balance (US$) | −0.001 | −5.59 |
| Interest payment (%) | 1.025 | −0.05 |
From the estimates, a US$1 million increase in fiscal deficit increases the level of debt by 8.63% and increases the growth rate of debt by 0.001%. The effect of an increase in the current account balance is higher for the level of debt, but much less for the growth rate of debt. A US$1 million increase in the current account balance increases debt levels by 5.059% and the speed of debt by 0.001%. Interestingly, while the magnitude of effect of an increase in the current account balance on levels of debt has much lower effect relative to the effect of fiscal balance, their effects on growth rate of debts appear to be similar..
The results outline the effects of the twin balance, and the important role of exports, on debt for African countries.
4. Policy options for sustainable debt
It has been less than two decades since African countries came out of the HIPC program. The pre-HIPC debt environment and the current debt environment are much different. First, in the pre-HIPC environment, most of the borrowing was concessional with bilateral and multi-lateral lending predominant in external debt. Second, in the current environment, African countries have access to markets and have successfully issued Eurobonds.
Nevertheless, one stark similarity remains between the pre HIPC debt environment and the current debt environment—borrowing is mostly from external debt. One reason for this is that African countries have underdeveloped local financial markets, which makes it easier for governments to mobilise borrowing externally. Another reason is that investment needs are much higher than the domestic savings. Whichever the case, it is imperative that borrowing is sustainable and a return to HIPC is avoided.
This analysis lists two key areas that could work simultaneously to strengthen debt sustainability for African countries.
a. Growing local currency debt markets
Emerging markets are increasingly issuing local currency bonds. Examples include the following: (i) Nigeria issued Naija bonds worth 12 billion of naira-denominated bonds ($76 m) in 2013 and 100% locally subscribed; (ii) Rwanda issued Umuganda and Twigire bonds in Rwandese franc worth $22 m issued in 2013 at 12.25% yield; and (iii) Indonesia issued Komodo bonds worth 4 trillion Indonesian rupiahs ($298 m), with the bond issuance oversubscribed four times in 2017.
There are several advantages to issuing local currency bonds. First, local currency bonds limit a country’s exposure to potential effects of external shocks. In case of commodity price shocks that have a reducing effect on foreign currency earnings, the resultant currency depreciating impact would not affect debt repayments.
Second, since local currency bonds means reduction in amounts to be paid on external foreign currency denominated debt, the need for precautionary would decline. Countries can therefore use the extra reserves for other developmental projects.
Third, local currency issues would attract a greater pool of investors, thereby creating awareness of investment offerings within the country, which would serve to attract more foreign Direct Investment (LSEG Africa Advisory Group, 2018).
Finally, local currency bond issuances could strengthen the development the development of local financial markets.
Four key policy options that could bolster the development of local currency debt markets include:
Increase borrowing in local currency in both domestic and international markets to lower exposure and exchange risks.
Update and adapt debt management frameworks and strategies to new debt structures, macroeconomic uncertainty and global market risks—e.g. State-Contingent Debt Instruments
More innovative financing mechanisms (e.g. blended finance, public-private partnerships (PPPs) and other risk mitigation mechanisms) to crowd-in private sector investment.
Rebalance fiscal policy to maintain government spending while increasing revenue to reduce fiscal deficits without austerity.
b. Keeping track of debt acceleration factors
Other than the IMF/World Bank, and now the China Road and Belt Initiative Countries Debt Sustainability Frameworks, most debt monitoring is carried out through debt level thresholds. However, rather than monitor debt levels, monitoring the speed of growth of debt can be instrumental in informing authorities how quickly they are approaching debt level thresholds and if borrowing is sustainable.
While the speed of debt indicates whether borrowing is heading towards unsustainable levels, adjusting structural indicators can steer debt back into a more sustainable path.
The following two-step approach can be utilised by policy makers to monitor debt and then make adjustments, if need be, to ensure sustainability:
Keeping track of the speed of growth of debt and ensuring growth remains below 5% per annum. In countries where debt grew at <5% in 2018 such as in Guinea, Lesotho, Madagascar and Tanzania, debt levels remained below 40%.
Where growth exceeds 5%, then adjustments to structural indicators can be adopted such as (a) a reduction in the flow of debt is desirable, that is, fiscal deficit can either be lower, or countries can adjust to have fiscal surpluses; (b) countries should negotiate for the most favourable borrowing conditions, that is, debt tenor should be long while interest rates should be as low as possible; and (c) promote policies that encourage exports to earn foreign currency or, alternatively, issue local currency bonds.
5. Conclusions
This study focuses on debt sustainability challenges for African countries. We begin with an analysis of the debt path for Africa in general and then for specific countries. Debt rose over the past decade; however, the growth rate in the 5 years to 2018 was fast paced at an Africa average of 9.3%. We argue that monitoring of debt through speed of debt, and thereafter adjusting structural indicators accordingly, can strengthen debt sustainability for African countries. It is imperative to note that debt paths are not homogenous. Different countries follow different paths and policies for debt sustainability should be applied on a country-by-country basis.
Corrective measures are easier to put in place with an early warning system. This paper attempts to propose an early warning system for debt accumulation, which should allow policy makers to put in place corrective measures before the situation becomes one of debt distress.
Under the corrective framework, governments have more flexibility on the policy options to be adopted and can choose between a wider variety of fiscal policy options from working to increase tax revenues, adoption of counter-cyclical measures to create buffers, implement and abide to strict fiscal rules to correct the acceleration of debt.
Managing the cost of debt can strengthen debt sustainability for African countries. Zambia issued a Eurobond in 2014 at a yield of 8.625%, 3 percentage points higher than its bond issuance in 2012, for an amount 30% higher (IMF, 2015). In the 3 years following the bond issue, Zambia’s interest rate payment grew by about 46%. Similarly, for Kenya and Ghana that issued about four Eurobonds between 2013 and 2018, interest payment made up almost half of the fiscal balance. Lower cost of debt reduces fiscal pressures and strengthens debt sustainability.
The conditions of debt matter. Cost and tenor of debt matter for economic growth. Government investment in public infrastructure eases supply-side constraints and crowds-in private sector investments. However, high cost of debt and short maturity periods lead to unsustainable debt where return on investments takes longer to be realised. Ethiopia borrowed externally to invest in export processing zones that were expected to increase the supply of foreign currency to repay debt. However, export growth has been slower than expected leading to exchange rate pressures, which could lead to more expensive debt in the future.
Legislation that encourages greater transparency of contracts such as digitalisation, publication of procurement processes and efficient public sector financial management could increase the efficiency in the use of public funds, thus increasing significantly the benefits derived from borrowing. Similarly, transparency in debt reporting, including issuing timelines of debt issues, could ensure more efficiency in use of debt, as well as strengthen the development of local markets.
For debt to remain sustainable, African countries must enhance revenue mobilisation while keeping expenditure at reasonable levels. The Africa region has on average one of the lowest revenue to GDP ratios on the back of weak domestic revenue mobilisation drive. However, there is scope for increase in revenue of up to 20% of GDP (ECA, 2019). Increase in revenue collection would mean lower fiscal deficit and leading to lower growth rates of debt.
Finally, debt monitoring tools such as the speed of debt create an early warning system, with room to mitigate any challenges before debt becomes unsustainable.
Footnotes
SDG financing gap is estimated at about 11% of GDP per year to 2030, with incremental financing needs estimated at between $614 billion and $638 billion per year (ECA, 2019).
Canada, France, Italy, Japan, UK and the USA had debt-to-GDP ratios above 80% in 2019 with only Germany having a debt-to-GDP ratio of 59.75%.
Since economic agents are subject to intertemporal constraints, for governments, where interest rates are lower than GDP growth rates, then the intertemporal budget constraint is no longer binding.
Real interest rates give a general idea of what to expect in terms of interest-growth differentials. However, the analysis must be interpreted with caution since real interest rates are often much higher than T-Bill rates/risk free rates (usually defined as the 90-day T-Bill rates).
Interest payment is used as a proxy for interest rate, in the absence of comprehensive data on loans, respective yields and maturity periods. In most cases, African countries acquire relatively short-term commercial debt, with the exceptions being long-term concessional debt.
The IMF threshold for African countries is a debt-to-GDP ratio of 55% and below, while the African Union Commission threshold is debt-to-GDP ratios of 70% and below.
Note: Most countries in the sample used were HIPC countries, which influences the growth rate of debt before 2008.
Debt is defined as general government gross debt.
Note: Concessional debt has declined considerably in recent years as a share of total external debt.
Detailed results in Appendix B.
References
Appendix A
Low growth rates are correlated with low debt levels
| Debt levels above 70 per cent of GDP (A) | Debt levels between 30–70 per cent of GDP, debt growth rates below 5 per cent (B) | Debt levels between 30–70 per cent of GDP, debt growth rates between 5–10 per cent (C) | Debt levels between 30–70 per cent of GDP, debt growth rates above 10 per cent (D) | Debt levels below 40 per cent of GDP, debt growth rates below 5 per cent (E) | Debt levels below 30 per cent of GDP (F) | No Data (G) |
|---|---|---|---|---|---|---|
| Angola | Cote d’Ivoire | Burkina Faso | Algeria | Guinea | Botswana | Libya |
| Cabo Verde | Guinea-Bissau | Central African Rep. | Benin | Lesotho | Congo, Dem. Rep. | Somalia |
| Congo, Rep. | Malawi | Chad | Burundi | Madagascar | Nigeria | |
| Egypt, Arab Rep. | Mauritius | Ethiopia | Cameroon | Tanzania | Zimbabwe | |
| Eritrea | Morocco | Ghana | Comoros | |||
| Gambia, The | Seychelles | Kenya | Djibouti | |||
| Mauritania | Mali | Equatorial Guinea | ||||
| Mozambique | South Africa | Eswatini | ||||
| Sao Tome & Principe | Uganda | Gabon | ||||
| Sierra Leone | Liberia | |||||
| Sudan | Namibia | |||||
| Togo | Niger | |||||
| Tunisia | Rwanda | |||||
| Zambia | Senegal | |||||
| South Sudan |
The figures below analyze speed of growth of debt by country and category.
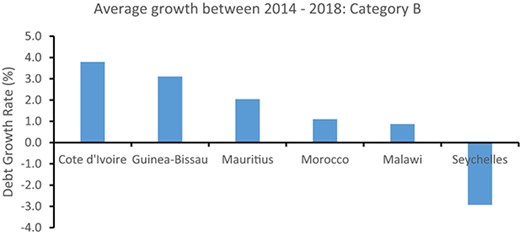
Growth rate of Debt – Group B
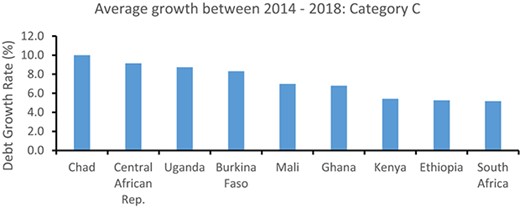
Growth rate of Debt – Group C
Growth rate of Debt – Group D
Appendix B: Regression Results
Effects of key variables on level of debt level
| Levels of debt | Growth rate of debt | |
|---|---|---|
| Constant | 9.557232 (2.85e-06) [0.003] | 3.219947 (1.486528) [0.031] |
| Fiscal balance | −8.63e-06*** (2.85e-06) [0.003] | −0.0012464*** (0.0003789) [0.001] |
| Current account balance | −5.59e-06*** (1.44e-06) [0.000] | −0.0008813*** (0.0001909) [0.000] |
| Interest rate | −0.0474005*** (0.0046214) [0.000] | 1.02474** (0.6147712) [0.096] |
| Diagnostics | ||
| F-test statistic | 52.15 | 18.50 |
| p-value | 0.000 | 0.000 |
| Number of countries | 39 | 39 |
