


Abstract
Molnupiravir has been considered a promising candidate for COVID-19. Its efficacy and safety in non-severe COVID-19 patients and the differences between patients with different risk factors need further evaluation.
We conducted a systematic review and meta-analysis of randomized controlled trials that allocated adult patients with non-severe COVID-19 to molnupiravir or a control. We used random-effects models, and conducted subgroup analyses and meta-regression for COVID-19 patients with high-risk factors. The GRADE approach was used to rate the certainty of evidence.
Fourteen trials with 34 570 patients were included. Moderate- to low-certainty evidence showed that molnupiravir was associated with a reduction in the risk of hospitalization (relative risk [RR] = 0.63, 95% CI: 0.47–0.85), risk of mechanical ventilation (RR = 0.37, 95% CI: 0.19–0.72) and time to symptom resolution (mean differences [MD] = −2.91 days, 95% CI: −3.66 to −2.16). However, no significant differences were found in adverse events, all-cause mortality, rate of and time to viral clearance, or duration of hospitalization. For the rate of viral clearance, subgroup effects were found between trials with low and high risk of bias (P = 0.001) and between trials with male or female majority (P < 0.001). For admission to hospital, subgroup effects were also found between trials with ≥50% and <50% of the participants being female (P = 0.04). Meta-regression showed a significant association between higher trial mean age and elevated risk of hospitalization (P = 0.011), and female majority and elevated risk of hospitalization (P = 0.011).
Molnupiravir was found to be effective in non-severe COVID-19, but the efficacy varied with age and sex.
Introduction
Coronavirus disease 2019 (COVID-19) is an infectious disease caused by the SARS-CoV-2 virus, which has spread rapidly around the world since its emergence. The WHO declared COVID-19 a global pandemic, which may be one of the worst modern-time global health crises ever. As of 5 February 2023, over 754 million confirmed cases and over 6.8 million deaths had been reported globally.1 Currently, due to the improvement of preventive measures such as vaccines, and the epidemic being dominated by the Omicron variant of SARS-CoV-2, most infected individuals experience only mild or moderate respiratory illness.2,3
Antiviral drugs recommended by WHO for patients with mild and moderate COVID-19 include remdesivir (conditionally recommended), nirmatrelvir/ritonavir (Paxlovid) and molnupiravir (conditionally recommended).4 Remdesivir is the only antiviral agent against COVID-19 approved by the FDA.5 In hospitalized adults with COVID-19, remdesivir is likely to increase the probability of recovery (defined as being no longer hospitalized, being hospitalized for infection control purposes only, or being hospitalized but not requiring supplemental oxygen or ongoing medical care) by Day 28 or 29, and reduce the time to clinical improvement.6 The requirement for IV infusion of remdesivir once a day for three consecutive days, however, poses a challenge for outpatients. Nirmatrelvir/ritonavir has been shown to reduce all-cause mortality and the risk of hospital admission,7 but drug interactions restrict its use.8 Molnupiravir is a novel antiviral drug that has been issued an emergency use authorization by the FDA for outpatient treatment of mild to moderate COVID-19 in adults.9 There is evidence, although of low certainty, that molnupiravir may reduce all-cause mortality.10 Several systematic reviews and meta-analyses have assessed molnupiravir in patients with COVID-19,11,12 but more randomized controlled trials (RCTs) have been published after their release, including one Phase 3 MOVe-OUT trial13 and two AGILE trials.14,15 These trials have shown a faster viral clearance (8 days versus 11 days)15 and an earlier discharge among hospitalized patients (median of 3 days)13 among patients receiving molnupiravir compared with the placebo groups. Besides, molnupiravir has been shown to retain its antiviral activity in both vaccinated and unvaccinated individuals infected with a broad range of SARS-CoV-2 variants.15 As new trials have been published, the efficacy and safety of molnupiravir need reassessment. Therefore, our aim was to comprehensively assess the efficacy and safety of molnupiravir for the treatment of non-severe (mild or moderate) COVID-19, and conduct subgroup analyses and meta-regression for COVID-19 patients with high risk factors, to find out if there were any differences in treatment effectiveness between different population groups.
Methods
The protocol for this systematic review and meta-analysis was registered on PROSPERO (CRD42023391971). We followed the Preferred Reporting Items for Systematic Reviews and Meta-Analyses (PRISMA) to perform the study and report the results.16
Search strategy and selection criteria
We searched PubMed, Embase, Web of Science and ClinicalTrials.gov from the inception of each database up to November 2022 to identify relevant studies. We used the following combination of search terms: (COVID-19) AND (‘Molnupiravir’ OR ‘EIDD-2801’ OR ‘MK-4482’ OR ‘N4-hydroxycytidine’. For the detailed search strategy, see Table S1 (available as Supplementary data at JAC Online). The reference lists of the identified studies and existing systematic reviews were also tracked to identify eligible studies.
RCTs that allocated adult patients with non-severe COVID-19 to molnupiravir or a control group (placebo or standard care) were included. Non-severe COVID-19 was defined as the absence of any criteria for severe or critical COVID-19 according to WHO guidelines.4 We included both ongoing and completed trials; data for ongoing trials were obtained from conference reports. Abstracts without any usable information were excluded.
The titles and abstracts of all records obtained from the databases were screened by two investigators working in pairs (M.S. and H.L.; J.H. and J.L.) using ‘Rayyan’, an online platform for conducting systematic reviews.17 Potentially eligible trials were subject to full-text review and screened independently by two reviewers to decide about inclusion. Disagreements were resolved through consensus among all authors.
Data extraction
Two investigators working in pairs (M.S. and H.L.; J.H. and J.L.) independently collected all relevant data from the included trials through a standard data collection form. A preliminary form was created to perform pilot testing before the extraction. Any conflicts were resolved by discussion. The extraction form contained general information (e.g. first author, publication year, trial name, sample size, sources of funding), characteristics of participants (e.g. age, sex, comorbidities, severity of COVID-19), details of the intervention (dosage, duration, route) and outcomes.
Outcomes
We included the following outcomes: all-cause mortality (with a time window as close to 90 days as possible), rate and duration of admission to hospital (within 29 days), rate of adverse events (within 29 days), rate and duration of viral clearance (time window closest to 7 days), time to symptom resolution or clinical improvement, and the rate and duration of mechanical ventilation (both invasive and non-invasive, time window closest to 90 days). Viral clearance was defined as the rate or time from randomization to a negative SARS-CoV-2 PCR test from nasopharyngeal samples. Time to symptom resolution or clinical improvement was defined as the first instance that a patient reported feeling recovered from the illness.
Risk-of-bias assessment
We used the revised Cochrane risk-of-bias tool for randomized trials (RoB-2) to assess the risk of bias in individual studies.18 This instrument addressed the following domains: bias from the randomization process, deviations from the intended intervention, missing data, measurement of the outcome, selection of the reported results, and overall bias. Each signalling question within each domain of bias was assessed as ‘yes’, ‘probably yes’, ‘no’, ‘probably no’ or ‘no information’ and based on the answers, a final judgement (‘low’, ‘some concerns’ or ‘high’) was made. The assessment of risk of bias was performed independently by two investigators working in pairs (M.S. and H.L.; J.H. and J.L.) and disagreements were resolved by discussion.
Data synthesis
We conducted random-effects meta-analyses using RevMan 5.4. For dichotomous outcomes, relative risks (RRs) with 95% CIs were calculated. Mean differences (MDs) with 95% CIs were calculated for continuous outcomes. Heterogeneity was assessed graphically using forest plots, and with statistical I² tests. A sensitivity analysis was undertaken to explore the effect of each individual study on the overall pooled estimate. Publication bias was assessed by Egger’s test and funnel plots if more than 10 studies were included.19 We also calculated the absolute effects for dichotomous outcomes by comparing them with the baseline risk acquired from the guideline published by WHO4 or from the median of the control group of the eligible RCTs. We compared the absolute effect size with the minimally important difference (MID),20 the minimum difference that the patients consider important as defined in the WHO guidelines, to put the magnitude of the effect into context (Table S2).
We explored the treatment associations in the following subgroups: (i) vaccinated and unvaccinated (with a predefined hypothesis of a larger effect in unvaccinated patients); (ii) hospitalized patients and outpatients (a predefined hypothesis of larger effect in outpatients); (iii) studies with low risk of bias and with high risk of bias (a predefined hypothesis of larger effect in trials with high risk of bias); and (iv) trials with proportions of females ≥50% and <50% (a predefined hypothesis of larger effect in trials with <50% women). We only conducted subgroup analyses if there were two or more trials in each subgroup.
We performed meta-regression to explore the association between treatment effects and (i) the proportion of males; (ii) the proportion of patients with diabetes; and (iii) mean age, when there were at least 10 trials available. We used the ICEMAN tool to assess the credibility of subgroup effects.21
Certainty of evidence
We used the Grading of Recommendations, Assessment, Development and Evaluation (GRADE) approach to summarize the certainty (quality) of evidence, rated as high, moderate, low or very low.22 We presented results from trials with low risk of bias if significant differences were found in subgroup analyses of treatment effects between trials with low and high risk of bias. If no significant subgroup effects were found, we pooled all trials without downgrading for risk of bias.23 Imprecision was considered according to the MID. We did not downgrade for inconsistency or imprecision more than once.
Results
Our initial search identified 1300 records. After screening titles and abstracts, the full texts of 84 potentially eligible trials were subsequently reviewed. Finally, 14 trials including 34 570 patients13–15,24–34 were determined to meet the inclusion criteria (Figure 1). Table S3 presents the list of excluded studies.
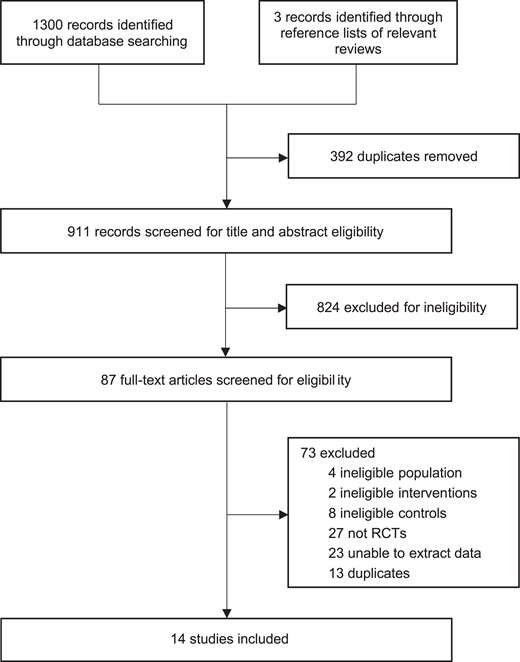
PRISMA flow diagram.
Study characteristics
Table 1 and Table S4 present the baseline characteristics of the included trials. Nine of the 14 included articles were peer-reviewed publications,13–15,24–27,28,31 two were preprints28,30 and for three trials we extracted data from conference reports.32–34 Seven trials were completed, and the remaining seven were still ongoing. The median of mean age of patients in trials was 43 years (IQR: 38–49) and the median proportion of females was 51.3% (IQR: 38.4%–56.6%). Seven trials reported the diabetes status of the patients, with a median prevalence of 11.6% (IQR: 3.0%–15.9%). Five trials reported the SARS-CoV-2 clade designation (variant); the three most common variants were Delta (22.9%, 532/2327), 20B (42.5%, 271/2327) and Omicron (1.2%, 148/2327). Three trials had patients who were unvaccinated only, while in three trials more than half of the patients were vaccinated; the remaining eight trials did not report the vaccination status of the participants.
Characteristics of included studies
| Reference | Trial name | Age, years, mean (SD) | Female (%) | Variant (%) | Sample size | Outcomes |
|---|---|---|---|---|---|---|
| Bernal, 2022 | MOVe-OUT | 43.0 (11.8) | 51.3 | Beta (0.8); Alpha (1.5); Gamma (5.9); Delta (32.1); Lambda (1.5); Mu (11.3); other (2.2); not available (44.7) | 1433 | mortality, mechanical ventilation, admission to hospital, adverse events |
| Fischer, 2022 | NR | 40.1 (13.6) | 51.5 | NR | 202 | mortality, admission to hospital, adverse events, viral clearance |
| Johnson, 2022 | MOVe-OUT | 43.5 (11.8) | 51.4 | NR | 1411 | mechanical ventilation, admission to hospital |
| Khoo, 2021 | AGILE | 56.0 (14.5) | 72.2 | NR | 18 | mortality, adverse events |
| Khoo, 2022 | AGILE | 43.0 (4.5) | 57.0 | Alpha (B.1.1.7) (21); B.1.1.1 (1); EU1 (B.1.177) (16); Omicron (B.1.1.529) BA.1 (15); Omicron (B.1.1.529) BA.2 (6); Delta (B.1.617.2) (40); B.1.1.11 (1); EU1 (B.1.177) (16); Omicron (B.1.1.529) BA.1 (15); Omicron (B.1.1.529) BA.211 (6); Delta (B.1.617.2) (40); XE (1); unknown (2) | 180 | mechanical ventilation |
| Zou, 2022 | NR | 39.9 (8.0) | 44.4 | Omicron BA.2 | 108 | adverse events, viral clearance |
| Arribas, 2021 | MOVe-IN | 57.0 (14.0) | 56.6 | 20A (20.4); 20B (51.3); 20C (9.7); 20D (0.9); 20E (EU1) (6.2); 20G (5.3); 20H (Beta) (0.9); 20I (Alpha) (3.5); unknown (1.8) | 304 | mortality, adverse events, viral clearance |
| Butler, 2022 | HCR/III/MOLCOV/04/2021-01 | 56.6 (12.6) | 58.6 | NR | 25 000 | mortality, admission to hospital, adverse events |
| Sinha, 2022 | IRAS 1004274, NIHR135366, CPMS 51313 | 35.0 (10.8) | 31.6 | NR | 1218 | mortality, admission to hospital, adverse events, viral clearance |
| Tippabhotla, 2022 | CR216-21 Version 2.0 | 36.5 (11.0) | 38.4 | NR | 1220 | mortality, admission to hospital, adverse events, viral clearance |
| Vyas, 2021 | NR | 36.5 (NR) | 38.4 | NR | 1220 | mortality, mechanical ventilation, admission to hospital, adverse events, viral clearance |
| Krishnan, 2021 | NR | 38.3 (NR) | 37.7 | NR | 736 | mortality, admission to hospital, adverse events, viral clearance |
| Kumar, 2021 | NR | NR | NR | NR | 1218 | mortality, admission to hospital, adverse events, viral clearance |
| Caraco, 2022 | MOVe-OUT | 49.2 (16.5) | 47.4 | 20A (23.9); 20B (38.1); 20C (12.9); 20D (0.6); 20E (EU1) (5.2); 20G (15.5); 20H (Beta) (3.2); 20I (Alpha) (0.6) | 302 | mortality, admission to hospital, adverse events |
NR, not reported.
Risk of bias
The risk of bias was estimated as low in six trials and high in eight trials (Table S5). The primary factor contributing to the potential bias was that seven of the high-risk-of-bias trials were open-label, i.e. lacked allocation concealment and blinding.
Outcomes
Table 2 presents the summary of evidence including the effect size for each outcome, along with the absolute effects, and the quality of evidence according to GRADE. Figures S6–13 present the results of sensitivity analyses demonstrating that the results were robust, Figures S31–46 present the results of meta-regression and Tables S6–7 present the assessment of the credibility of the findings from subgroup analyses.
A summary of pooled effect sizes and characteristics of the evidence for all included outcomes
| Outcome measure | No. of trials (no. of patients) | Effect size (95% CI) | Risk of bias | Inconsistency, (I2, %) | Indirectness | Imprecision | Publication bias | Overall certainty of evidence | Absolute effect (95% CI) |
|---|---|---|---|---|---|---|---|---|---|
| All-cause mortality | 12 (33 009) | RR = 0.40 (0.10–1.53) | Not serious | Not serious (51)a | Not serious | Serious | Undetected | Moderate | −2 (−4 to 2) per 1000; baseline risk: 4 per 1000 |
| Admission to hospital | 11 (34 009) | RR = 0.63 (0.47–0.85) | Not serious | Not serious (47) | Not serious | Seriousb | Symmetric funnel plot; Egger’s test P = 0.039 | Low | −21 (−31 to −9) per 1000; baseline risk: 58 per 1000 |
| Viral clearance | 9 (6228) | RR = 1.05 (0.97–1.14) | Seriousc | Not serious (38) | Not serious | Serious | Undetected | Low | 8 (−5 to 23) per 1000; baseline risk: 163 per 1000 |
| Mechanical ventilation | 4 (4154) | RR = 0.37 (0.19–0.72) | Not serious | Not serious (0) | Not serious | Seriousb | Undetected | Moderate | −11 (−15 to −5) per 1000; baseline risk: 18 per 1000 |
| Adverse effects | 13 (33 133) | RR = 1.13 (0.75–1.71) | Not serious | Serious (86) | Not serious | Serious | Symmetric funnel plot; Egger’s test P = 0.164 | Low | 1 (−1 to 4) per 1000; baseline risk: 5 per 1000d |
| Duration of hospitalization | 1 (115) | MD = −3.00 (−6.46 to 0.46) | Not serious | Not serious (heterogeneity not applicable) | Not serious | Serious | Undetected | Moderate | — |
| Time to viral clearance | 3 (469) | MD = −1.16 (−3.64 to 1.32) | Not serious | Serious (85) | Not serious | Serious | Undetected | Low | — |
| Time to symptom resolution/clinical improvement | 8 (30818) | MD = −2.91 (−3.66 to −2.16) | Not serious | Serious (95) | Not serious | Not serious | Undetected | Moderate | — |
The estimates with statistical differences were presented in bold.
An I2 value between 75% and 100% indicates that heterogeneity may be considerable.
Judged as serious due to the CI around absolute effect includes both appreciable benefit and no appreciable benefit according to MID considered by patients.
Judged as serious due to significant differences in subgroup analyses of treatment effect between trials with low risk of bias and high risk of bias.
The baseline risk was obtained from the median incidence rate of placebo/standard care group.
All-cause mortality
A meta-analysis of 12 RCTs (33 009 patients) found no significant association between molnupiravir treatment (compared with placebo) and all-cause mortality (RR = 0.40, 95% CI: 0.10–1.53; 2 deaths less per 1000 patients, 95% CI: 4 less to 2 more, with a baseline risk of 4 per 1000; moderate certainty of evidence; Figure S1). No subgroup effects were found between trials with high and low risk of bias, between trials with a proportion of females ≥50% and <50%, or between vaccinated and unvaccinated patients (Figures S16–18).
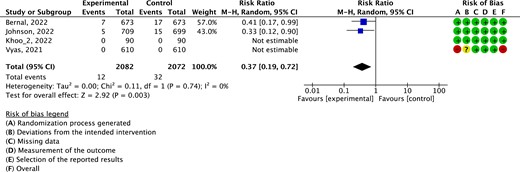
Admission to hospital
Eleven RCTs (34 009 patients) reported the rate of admission to hospital. Compared with placebo, molnupiravir was associated with a reduction in the rate of admission to hospital (RR = 0.63, 95% CI: 0.47–0.85; 21 admissions less per 1000 patients, 95% CI: 31 less to 9 less, with a baseline risk of 58 per 1000; low certainty of evidence; Figure 2). However, the absolute difference was less than the MID (10 admissions less per 1000). Subgroup effects were found between trials where the proportion of females was ≥50% or <50% (test for subgroup differences P = 0.04; Figure S19), indicating that molnupiravir was significantly effective in reducing the risk of hospitalization only in trials where the majority of participants were men. However, the credibility of the subgroup and meta-regression effects was low (Table S7). No subgroup effects were found between trials with high and low risk of bias or between vaccinated and unvaccinated patients (Figure S20 and 21). Meta-regression on the proportion of diabetes at baseline showed no significant difference (Figure S33); however, there was a significant positive association between higher mean age and the risk of hospitalization (P = 0.011; Figure S34), as well as a negative association between a higher proportion of males and the risk of hospitalization (P = 0.011; Figure S35). Egger’s test indicated a possible publication bias (P = 0.039; Figure S14).

Results of the meta-analysis of hospital admission rates. This figure appears in colour in the online version of JAC and in black and white in the print version of JAC.
Viral clearance
Nine RCTs (6228 patients) reported the rate of viral clearance. Compared with placebo, molnupiravir was not associated with viral clearance (RR = 1.05, 95% CI: 0.97–1.14; 8 more cases of viral clearance per 1000 patients, 95% CI: 5 less to 23 more, with a baseline risk of 163 per 1000; low certainty of evidence; Figure S2). Subgroup effects were found between trials with low and high risk of bias (P = 0.001; Figure S22) and trials with proportions of females ≥50% and <50% (P < 0.001; Figure S23). However, the credibility of both subgroup effects was low (Table S7). No subgroup effects were found when stratified by vaccination status or hospitalization status (Figures S24–25).
Mechanical ventilation
Evidence from four RCTs (4154 patients) showed that the risk of mechanical ventilation was significantly lower among patients receiving molnupiravir treatment than placebo (RR = 0.37, 95% CI: 0.19–0.72; 11 ventilations less per 1000 patients, 95% CI: 15 less to 5 less, with a baseline risk of 18 per 1000; moderate certainty of evidence; Figure 3). However, the difference was below the MID (10 less per 1000).
Results of the meta-analysis of the risk of mechanical ventilation. This figure appears in colour in the online version of JAC and in black and white in the print version of JAC.
Adverse events
Thirteen RCTs (33 133 patients) reported adverse events. Compared with placebo, molnupiravir did not increase the risk of adverse events (RR = 1.13, 95% CI: 0.75–1.71; 1 event more per 1000 patients, 95% CI: 1 less to 4 more, with a baseline risk of 5 per 1000; low certainty of evidence; Figure S3). No subgroup effects were found between trials with low and high risk of bias, hospitalized patients and outpatients, trials with a proportion of females ≥50% and <50%, or vaccinated and unvaccinated patients (Figure S26–29). Egger’s test and funnel plot suggested no publication bias (P = 0.164; Figure S15).
Duration of hospitalization
One RCT (115 patients) estimated the impact of molnupiravir (compared with placebo) on the duration of hospitalization and found no significant difference (MD = −3.00 days, 95% CI: −6.46 to 0.46; baseline risk was 7 days; moderate certainty of evidence; Figure S4). The duration of hospitalization was thus shorter, although not significantly, among patients receiving molnupiravir than those receiving placebo.
Time to viral clearance
Three RCTs (469 patients) reported time to viral clearance. Compared with placebo, molnupiravir was not associated with time to viral clearance (MD = −1.16 days, 95% CI: −3.64 to 1.32; baseline risk was 19 days; low certainty of evidence; Figure S5).
Time to symptom resolution/clinical improvement
Evidence from eight RCTs (30 818 patients) showed that patients receiving molnupiravir progressed to symptom resolution or clinical improvement faster than those who received placebo (MD = −2.91 days, 95% CI: −3.66 to −2.16; baseline risk was 9 days; moderate certainty of evidence; Figure 4). The difference was also greater than the MID (1 day less). No subgroup effects were found between trials with a proportion of females ≥50% versus <50% (Figure S30).
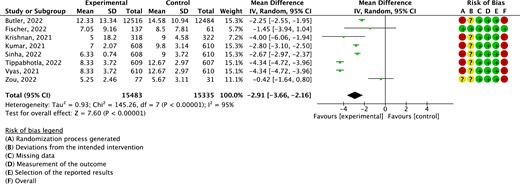
Results of the meta-analysis of time to symptom resolution. This figure appears in colour in the online version of JAC and in black and white in the print version of JAC.
Discussion
Main findings
This systematic review and meta-analysis provides a comprehensive overview of the evidence for molnupiravir in treating non-severe COVID-19 up to 2022. The certainty of evidence was mostly rated as moderate or low. Molnupiravir treatment for patients with mild or moderate COVID-19 was shown to be associated with reduced rates of hospitalization and mechanical ventilation, and with a shorter time to symptom resolution or clinical improvement. No significant effects were found for other outcomes. It remains uncertain whether molnupiravir has any effect on viral clearance, although a positive effect was found in trials with a high risk of bias, as well as in trials where the majority of patients were male. Similar results were found for the risk of hospitalization; molnupiravir showed its efficacy particularly in the trials where the proportion of females was less than 50%. Results of meta-regression showed that the efficacy of molnupiravir in reducing the risk of hospitalization was negatively correlated with a higher proportion of males, and positively correlated with a higher mean age in the trial.
Comparison with other studies
The systematic review and network meta-analysis of drug treatments for COVID-1935 that is used to inform the WHO guidelines include, at present, only 6 (4805 participants) of the 14 trials (34 570 participants) we included. Its results showed that molnupiravir probably reduces the risk of admission to hospital in patients with non-severe COVID-19. The review also performed subgroup analyses only by severity of COVID-19. Prior meta-analyses of molnupiravir efficacy in COVID-19 patients found results similar to our review, showing the effectiveness of this drug in reducing mortality and the risk of hospitalization; no significant adverse events were found either.11,12 However, our study included more trials, encompassing a larger patient population, while concurrently performing more subgroup analyses, and using the GRADE approach to appraise the certainty of evidence. We also presented the absolute effects and compared them with MIDs of each outcome, which can help to interpret the clinical significance of the findings. Molnupiravir was recommended by multiple guidelines for patients with mild or moderate COVID-19 at high risk of hospitalization or progression to severe COVID-19.4,36,37 The results of our analyses showed also that the positive impact of molnupiravir treatment was more pronounced in trials with older and male patients. Male sex and older age are known risk factors for severe COVID-19 disease,38 which strengthens the evidence that molnupiravir could be particularly beneficial for high-risk patients.
Recent studies on molnupiravir for treating SARS-CoV-2 highlight the unknown risks it poses to the host.39 Molnupiravir introduces mutations to the viral genome, helping clear infections. However, a study of 13 million SARS-CoV-2 sequences found sequences with molnupiravir’s fingerprints, suggesting its treatment leads to the evolution of viral lineages with multiple mutations capable of spreading to others.40 Indeed, molnupiravir has the potential to reduce the disease burden of SARS-CoV-2 and help contain future emerging RNA viruses. However, assessing its long-term mutagenic effects is crucial. Treatment should be limited to those who benefit more: individuals intolerant to other treatments, those with preexisting conditions enhancing COVID-19 risk, and those over 50 years, who may be less affected by potential long-term cancer or reproductive risks.
Strengths and limitations
The main strength of this review is the comprehensive search of eligible RCTs, including also ongoing trials. We used the GRADE approach to appraise the certainty of evidence, and calculated the absolute effects for a clear interpretation of results. We also use the MIDs to reflect the clinical significance of the findings. Pre-defined subgroup analyses on high risk factors of progression to severe COVID-19 were performed to explore sources of heterogeneity and potential subgroup effects, and we also assessed the credibility of the subgroup effects. We included preprint studies in our analysis, thereby increasing the sample size substantially and enhancing statistical power. Besides, we performed sensitivity analyses to assess the robustness of the results.
This review also has several limitations. First, the certainty of the evidence regarding the estimates of adverse effects, time to viral clearance, and time to symptom resolution was low, possibly because of the large heterogeneity between trials. Second, although the pooled estimates for some outcomes showed statistically significant differences, the absolute effects were minimal and below the level considered to be important by the patients. Third, due to insufficient data, we were unable to perform within-trial subgroup analyses or subgroup analyses with some additional potentially relevant factors, such as chronic diseases or immunodeficiencies. Although we performed a subgroup analysis comparing vaccinated with unvaccinated patients, the results showed no significant differences, so the impact of molnupiravir on vaccinated patients is unclear. Fourth, most of the included RCTs were open-label trials, which increased the risk of bias. Although we performed subgroup analyses and used the pooled results without downgrading the certainty of evidence for the outcomes if no subgroup effects were found, the risk of bias may have still affected the accuracy of the results. Fifth, due to the variety of adverse events and insufficient data, we could not estimate the effect of molnupiravir on the risk of specific adverse events.
Conclusions
Patients with mild or moderate COVID-19 are likely to benefit from molnupiravir treatment, which was shown to reduce the risk of admission to hospital, risk of mechanical ventilation, and time to symptom resolution or clinical improvement, without causing any significant adverse events. Older patients and males may particularly benefit from molnupiravir treatment. Our findings can help decision-makers to select appropriate treatment strategies for patients more accurately, thereby improving treatment outcomes.
Acknowledgements
We would like to thank all participants for their support and contributions during the study.
Funding
This study was supported by the Fundamental Research Funds for the Central public welfare research institutes (ZZ15-WT-05) of the China Academy of Chinese Medical Sciences.
Transparency declarations
The authors declare there were no conflicts of interest.
Author contributions
L.G. contributed to the study concept and design; M.S., H.L., J.H. and J.L. reviewed studies; M.S. and Y.L. extracted data, did the statistical analysis and drafted the report. J.E., Z.Z., C.Z. and J.T. contributed to the critical revision of the manuscript for intellectual content. L.G. had full access to all the data in the study and takes responsibility for the integrity of the data and the accuracy of the data analysis.
Disclaimer
The funding organizations had no role in the design and conduct of the study, collection, management, analysis and interpretation of the data, preparation, review or approval of the manuscript, or decision to submit the manuscript for publication.
Supplementary data
Figures S1 to S46 and Tables S1 to S7 are available as Supplementary data at JAC Online.
References
Author notes
Mingyao Sun and Honghao Lai share the co-first author.
Long Ge and Zhigang Zhang contributed equally to this work.
