


Abstract
Carbon and nitrogen fluxes in Aphanizomenon sp. colonies in the Baltic Sea were measured using a combination of microsensors, stable isotopes, mass spectrometry, and nanoscale secondary ion mass spectrometry (nanoSIMS). Cell numbers varied between 956 and 33 000 in colonies ranging in volume between 1.4 × 10⁻⁴ and 230 × 10−4 mm−3. The high cell content and their productivity resulted in steep O2 gradients at the colony–water interface as measured with an O2 microsensor. Colonies were highly autotrophic communities with few heterotrophic bacteria attached to the filaments. Volumetric gross photosynthesis in colonies was 78 nmol O2 mm−3 h−1. Net photosynthesis was 64 nmol O2 mm−3 h−1, and dark respiration was on average 15 nmol O2 mm−3 h−1 or 16% of gross photosynthesis. These volumetric photosynthesis rates belong to the highest measured in aquatic systems. The average cell-specific net carbon-fixation rate was 38 and 40 fmol C cell−1 h−1 measured by microsensors and by using stable isotopes in combination with mass spectrometry and nanoSIMS, respectively. In light, the net C:N fixation ratio of individual cells was 7.3±3.4. Transfer of fixed N2 from heterocysts to vegetative cells was fast, but up to 35% of the gross N2 fixation in light was released as ammonium into the surrounding water. Calculations based on a daily cycle showed a net C:N fixation ratio of 5.3. Only 16% of the bulk N2 fixation in dark was detected in Aphanizomenon sp. Hence, other organisms appeared to dominate N2 fixation and NH4+ release during darkness.
Introduction
Aphanizomenon sp. is a filamentous, colony-forming N2-fixing cyanobacterium, which frequently blooms in lakes and brackish waters. It occurs both as colonies and single trichomes during their growth, which often lasts 2–3 months during the summer in the Baltic Sea (Rolff et al., 2007; Degerholm et al., 2008). The primary productivity in the Baltic Sea by filamentous cyanobacteria, which are represented by Aphanizomenon sp., Anabaena sp., and Nodularia spumigena, represents 44% of the community primary production. These filamentous organisms comprise 20–30% of the cyanobacterial biomass in the Baltic Sea. The remaining primary productivity and biomass is represented by unicellular picocyanobacteria (Stal et al., 1999; Stal and Walsby, 2000). In the absence of other nitrogen sources, these large filamentous cyanobacteria cover their nitrogen demand through N2 fixation, and growth is probably limited by the availability of phosphate (Moisander et al., 2003; Walve and Larsson, 2007). Aphanizomenon sp. accumulates inorganic phosphate during the growth season, and blooms appear to terminate when the internal storage is used up and bulk concentrations are low in mid-August in the Baltic Sea (Walve and Larsson, 2007).
N2 fixation by filamentous cyanobacteria, including Aphanizomenon sp., is considered to be a quantitatively important source of nitrogen to the plankton community during the summer months in the Baltic Sea (Degerholm et al., 2008). Nitrogen budgets of the Baltic Sea have suggested that Aphanizomenon leaks a substantial fraction of its fixed nitrogen that is used by other members (for example picocyanobacteria and heterotrophic bacteria) in the plankton community (Larsson et al., 2001; Stal et al., 2003; Rolff et al., 2007). Using stable isotopes, it was shown that 5–10% of the 15N2 fixed by large cyanobacteria (Aphanizomenon sp. and Nodularia sp.) in the Baltic Sea is found in smaller organisms represented by the 2–5 μm size class, for example picocyanobacteria, after 8–10 h incubation time (Ohlendieck et al., 2000). Direct measurements of ammonium or dissovled organic nitrogen (DON) release relative to N2-fixation rates, however, have not been performed in field-sampled cyanobacteria from the Baltic Sea.
Nanoscale secondary ion mass spectrometry (nanoSIMS) is a novel technique, which reveals elemental and isotopic surface composition after measurement of isotopic composition at a spatial resolution of 50 nm. Combining this technique with isotope enriched incubations has enabled measurements of N2 and C fixation on a single-cell level in mixed populations (Musat et al., 2008). Hence, using this technique we can now ascribe N2 and C fixation to individual cells of different organisms in the Baltic Sea. To understand small-scale carbon and nitrogen fluxes in Aphanizomenon sp. colonies, we combined microsensors and stable isotope enrichment incubations with mass spectrometry as well as with nanoscale secondary ion mass spectrometry (nanoSIMS). Using microsensors, gross and net photosynthesis as well as dark respiration was measured directly in colonies as a function of colony size and cell content in field-sampled Aphanizomenon sp. in the Baltic Sea. Using stable isotope in combination with mass spectrometry and nanoSIMS, we measured carbon and nitrogen fixed by Aphanizomenon sp. cells and its release to the surrounding water.
Materials and methods
Sampling
In August 2008, Aphanizomenon colonies were sampled in the upper 10 m of the water column at station B1 (N 58° 48′ 28, E 17° 37′ 60) in the Stockholm archipelago using a plankton net (Hydrobios: 0.5 m diameter, mesh size: 90 μm). Water at 5 m depth was collected by a water sampler. The salinity was 6 and the temperature was 19 °C. Samples were immediately brought to the laboratory in which they were analyzed by microsensors or incubated with stable isotopes.
Microscopy
All three dimensions of individual colonies were measured under a dissection microscope using a calibrated ocular micrometer. Their volume was calculated as ellipsoids: Vol=4/3π × a × b × c, where a, b, and c are the half-axes in the three dimensions. A microsensor was used to lift and turn colonies on an agar plate covered with water from the sampling site. Each colony with known size was thereafter collected using a wide bore pipette, transferred to an Eppendorf vial with 1.5 ml surrounding water, and fixed with a drop of 5% Lugol's solution. The fixed colonies were stored cold at 4 °C until further analysis. Colonies disintegrate in Lugol's solution, and the filaments sediment at the tip of the Eppendorf vial; 1 ml containing all filaments from each colony was pipetted into a gridded Sedgewick Rafter counting chamber (Wildlife supply Company). Numbers and dimensions of dispersed filaments, vegetative cells, and heterocyst frequency (in no filament per length, and in percent of vegetative cells) in each colony was measured under an inverted microscope (Zeiss, Switzerland) equipped with a digital camera (Axio Cam, Zeiss) connected to an image analysis program (AxioVision, Zeiss). Total cumulative filament length per field was measured until the mean value was stable and the s.d. was <2% of the mean value.
Total abundance of Aphanizomenon sp. trichomes and cells in bulk water and in concentrated samples (see below) was measured using the same counting procedure as described above. Five replicates, each comprising a subsample of 1 ml of 50 ml sample fixed in Lugol were analyzed both for in situ bulk water as well as concentrated samples.
Small-scale measurements of O2 fluxes
Freshly sampled colonies were transferred to a Petri dish coated by a 3 mm thick agar layer (1% w:w) at the bottom and covered by filtered (0.2 μm) water from the sampling site. The diffusion coefficients of gases, ions, and solutes in 1% agar are close to those in (sea) water (Libicki et al., 1988; Revsbech, 1989). Artifacts from a solid boundary, which limits solute exchange between colonies and the surrounding water, was, therefore, avoided by using a Petri dish coated with agar (Ploug and Grossart, 1999). The Petri dish was placed in a thermostated container at in situ temperature. Oxygen concentrations were measured at the colony–water interface using a Clark type oxygen microsensor (Revsbech, 1989) attached to a micromanipulator. The current was measured by a picoamperemeter (Unisense PA 2000) connected to a strip-chart recorder (Kipp and Zonen). The electrode was calibrated at anoxic conditions and at air saturation. Its 90% response time was <1 s and the stirring sensitivity <0.3%. The oxygen microelectrode tip was 2 μm wide and its position was observed under a dissection microscope with an ocular micrometer. The electrode was manually approached toward the colony until it visually touched the surface. Oxygen-concentration gradients were measured at the colony–water interface at 50 μm step increments. Three replicates of the O2-concentration gradient were measured in light and in dark, respectively. The light source was a Schott lamp (KL 1500 LCD) equipped with an infra-red cutoff filter and calibrated using an LiCOR scalar irradiance sensor. The fluxes of oxygen were measured at steady state of concentration gradients at the colony–water interface, and calculated from Fick's first law of diffusion:
where J is the flux (nmol O2 cm−2 s−1), D is the diffusion coefficient of O2 in the bulk water (2.02 × 10⁻⁵ cm2 s−1 at 6 and 19 °C; Broecker and Peng, 1974), and dC/dr is the radial-concentration gradient of O2 (nmol O2 cm−3). Surface area and volume was calculated as for ellipsoids (Mass, 1994). Carbon production rates were calculated assuming a photosynthetic quotient of 1.2 mol O2:1 mol CO2.
Incubations with stable isotopes
Water samples containing 1.10 × 10⁸Aphanizomenon sp. cells per liter (±0.03 × 10⁸ cells l−1; s.e.) were incubated in 250 ml serum bottles by adding colonies harvested by the plankton net to bulk water samples. Microscopy revealed that the mean trichome size was 230±95 μm, and most heterocysts were observed within the trichomes. Hence, cells did not appear damaged by the sampling procedure. The serum bottles were closed with rubber stoppers through which 13C bicarbonate was injected to a final bicarbonate concentration of 1.83 mm (11% labeling) except for three control bottles. Using a gas mouse, 2 ml 15N2 (Sigma, Germany) was injected to the sample (12% final labeling). The syringe was flushed several times with Argon gas between injections. All bottles were thoroughly shaken during 5 min to ensure an even distribution of dissolved 15N2 in the samples. Many colonies remained intact, and microscopy did not reveal cell damage during this procedure. Three replicates were incubated for 0, 3, or 6 h in light at 300 μmol photons m−2 s−1, as measured using an LiCor scalar irradiance sensor, or in dark at in situ temperature (19 °C) in a thermostated room. The incubations were stopped by filtration of samples onto pre-combusted GF/F filters (for EA-MS analysis) (Montoya et al., 1996). The filtrates were filled into 12 ml gas tight exetainers and killed by adding 100 μl saturated HgCl2 solution to each exetainer. Subsamples for nanoSIMS analysis were fixed with 2% paraformaldehyde and washed before filtration onto Gold-Palladium-coated GTTP filters (pore size, 0.22 μm; diameter 25 mm; Millipore, Germany).
EA-IRMS analysis
To determine the amount of 15N gas and 13C bicarbonate incorporated into biomass, water samples were filtered onto glass fiber filters and analyzed through mass spectrometry using N2 and CO2 released by flash combustion in excess oxygen at 1050 °C. An automated elemental analyzer coupled to a Delta Plus Advantage mass spectrometer was used (Montoya et al., 1996). Before analysis, GF/F filters were freeze dried overnight and dehydrated in an HCl-smoke environment in a desiccator overnight. Round punchouts (Ø 1 cm) of the GF/F filters were packed into tin cups and were tightly pressed into a pill-shaped form. These were then loaded onto an autosampler flushed with helium, which automatically dropped the packed filters into the combustion furnace. As a standard, caffeine was used for calibration.
NanoSIMS analysis
For NanoSIMS analysis of single Aphanizomenon cells, Gold-Palladium-coated GTTP filters containing chemically fixed water samples were cut with a round stencil (Ø 5 mm) and mounted on a sample holder. The analysis was performed using a NanoSIMS 50 l manufactured by Cameca (Gennevilliers, France). For each individual cell, we recorded simultaneously secondary ion images of 12C, 13C, 12C14N, and 12C15N using four electron multipliers. The measurements and the image and data processing were performed as described earlier (Musat et al., 2008).
The 15N/14N and the 13C/12C ratios of individual Aphanizomenon cells were determined for experiments with and without (that is control experiments) labeled substrate. Subsequently, the 15N/14N and 13C/12C enrichment of individual cells was calculated by subtracting the average cellular ratios of Aphanizomenon in the control experiments from the ratios obtained for individual cells from the labeling experiment.
Ammonium analysis
The net release of 15NH4+ from cyanobacteria was quantified in the filtrate after the incubations with 15N2 during 0, 3, and 6 h in light or darkness using the method by Warembourg (1993). Samples were analyzed on a GC-IR mass spectrometer (VG Isogas Limited, Middlewitch, UK).
The NH4+ microenvironment of colonies was modeled, knowing the diffusive properties of colonies from O2 measurements, the net carbon fluxes, the C:N fixation ratio, and fraction of fixed nitrogen released as NH4+. We used an analytical diffusion model by Ploug et al. (1997), with a diffusion coefficient of NH4+ of 1.6 × 10⁻⁵ cm2 s−1 at 6 and 19 °C (Li and Gregory, 1974).
Results
The number of cells in the Aphanizomenon sp. colonies was a significant function of colony volume (Figure 1). The largest colonies had a volume of 0.023 mm3 with an equivalent spherical diameter of 340 μm, but most colonies were considerably smaller. The number of cells in individual colonies varied from 956 to 33 000 for colonies ranging between 1.4 × 10⁻⁴ and 230 × 10−4 mm3 in volume. The average number of cells per colony was described as Cells=1.53 × 10⁶ × (Volcol), where colony volume is measured in mm3. Alternatively, biomass of filamentous cyanobacteria is measured as meter per length (m l−1) (Hajdu et al., 2007; Rolff et al., 2007; Degerholm et al., 2008). The cumulative length of filaments in individual colonies varied between 7 and 246 mm, and it was described by L=11 341 × (Volcol); where length, L, is expressed in mm. The significance level was R2=0.61; n=37; P<0.0001 for both expressions. The mean cell volume was 132 μm3, and the mean volume fraction occupied by cells in colonies was 0.19. Heterocysts were 1.5% of total cells or 2.02±0.95 mm per filament independent of colony volume.
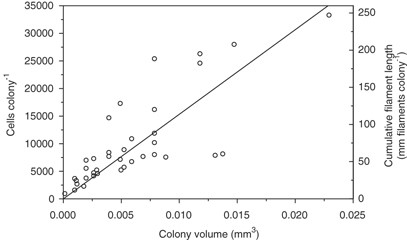
Number of cells and cumulative filament length (both shown as symbols) in Aphanizomenon colonies as a function of colony volume. The line represents linear regression between the variables (please see text).
The cell content and their productivity in colonies gave rise to significant oxygen-concentration gradients at the colony–water interface (Figure 2). Oxygen concentrations at the colony surface varied up to 65 μm between the light (300 μmol photons m−2 s−1) and the dark exposed colonies (Figure 2). The gradients were measurable up to 200 μm from the surface of a 340 μm large colony. Net photosynthesis was 1.1 nmol colony−1 h−1, and dark respiration was 0.3 nmol colony−1 h−1 as calculated from the oxygen gradients measured in light and dark, respectively. Hence, dark respiration was 22% of gross photosynthesis in this example.
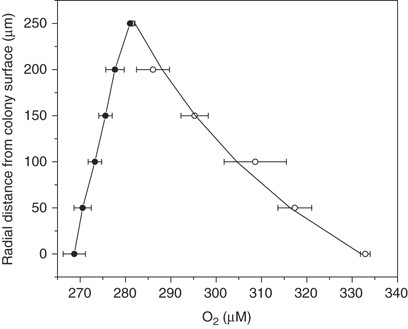
O2 gradients measured at the colony–water interface during dark (closed symbols) and in light at 300 μmol photons m−2 s−1 (open symbols). Each symbol represents the average value of three series of measurements with the s.d. of the mean value shown as bars. The curve represents the O2-concentration gradient fitted to the measured values and used for flux calculations.
The net photosynthesis and dark respiration measured as a function of colony size are shown (Figure 3). Net photosynthesis as well as dark respiration increased proportionally to colony volume. Net photosynthesis was described by NP=64 × (Volcol); R2=0.92 (n=14; P<0.001), and dark respiration was described by R=−15 × (Volcol); R2=0.94 (n=14; P<0.001), where volume is measured as mm3, and NP and R measured as nmol O2 mm−3 h−1. Thus, volume-specific gross photosynthesis, net photosynthesis, and dark respiration was 79, 64, and 15 nmol O2 mm−3 h−1, respectively, independent of colony size. Combining these correlations with the biomass distribution (Figure 1), and assuming a cell-specific carbon content of 0.11 pg C μm−3 (Helcom, 1988) yielded a carbon-specific net photosynthesis rate of 0.029 h−1 and a dark respiration rate of 0.007 h−1 independent of colony size. Average cell-specific photosynthesis and respiration rates were 42 and 10 fmol O2 cell−1 h−1 or 38 and 8.3 fmol C cell−1 h−1, respectively, assuming a photosynthetic quotient of 1.2 (Table 1).
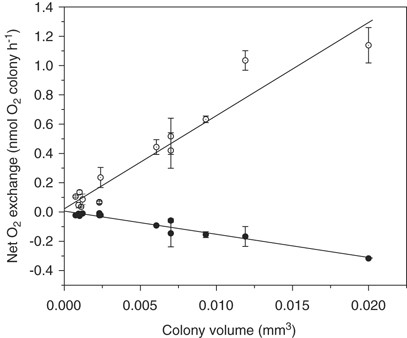
Net photosynthesis rate (open symbols) and dark respiration rate (closed symbols) measured as a function of colony volume. Each symbol represents the average value of three series of measurements with the s.d. of the mean value shown as bars.
Net photosynthesis and dark respiration in Aphanizomenon sp.
| Method | Net photosynthesis | Dark respiration | ||
|---|---|---|---|---|
| nmol C m−1h−1 | fmol C cell−1h−1 | nmol C m−1h−1 | fmol C cell−1h−1 | |
| Microsensora | 5.4 | 38 | −1.3 | −8.3 |
| NanoSIMS | 40±12 | — | — | |
| Method | Net photosynthesis | Dark respiration | ||
|---|---|---|---|---|
| nmol C m−1h−1 | fmol C cell−1h−1 | nmol C m−1h−1 | fmol C cell−1h−1 | |
| Microsensora | 5.4 | 38 | −1.3 | −8.3 |
| NanoSIMS | 40±12 | — | — | |
Assuming a photosynthetic quotient of 1.2.
NanoSIMS analysis of colonies and filaments incubated with stable isotopes of C and N showed a rapid transfer of 15N from heterocysts to vegetative cells. An example is shown in Figure 4. 13C carbon was evenly distributed in vegetative cells after 3 h incubation time with only low assimilation into heterocysts. Heterocysts were also less enriched in 15N as compared with vegetative cells. The occurrence of N-storage products, for example cyanophycin, was detectable after 3 h as regions with locally intense labeling of 15N (in cyanophycin granules). Hence, incorporation of 15N into proteins of heterocysts seemed low, and most of the 15N label was transported to adjacent vegetative cells.
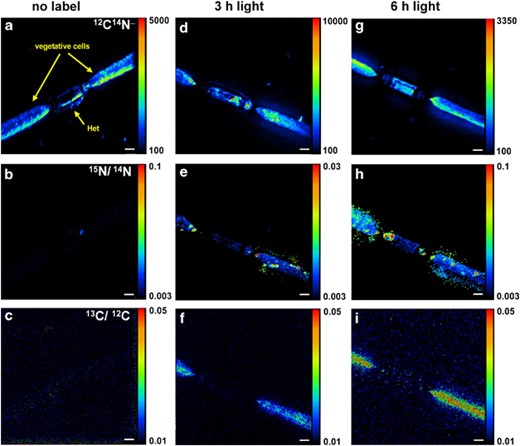
Distribution of 12C14N− (a, d, g), and 15N/14N (e, h), and 13C/12C (f, i) in single Aphanizomenon cells as measured by nanoSIMS. a–c: no label, d–f: t=3 h, g–i: t=6 h. The size bars are 2 mm.
Cell-specific assimilation rates of 13C and 15N derived from nanoSIMS analysis and converted to total net C and total net N assimilated by using percent labeling are shown in the bulk in Figure 5. These varied largely between single cells after 6 h. Less C relative to N was incorporated into heterocysts as compared with vegetative cells. In vegetative cells, the average cell-specific carbon assimilation rate was 40±12 fmol C cell−1 h−1, and the average cell-specific N assimilation into biomass was 4.8±3.2 fmol N cell−1 h−1 in light. Hence, the average net C:N assimilation ratio into individual vegetative cells was 7.3±3.4 in light (Table 2). Dark respiration was −8.3 fmol C cell−1 h−1 and dark net N2-fixation rate was 0.28±0.15 fmol N cell−1 h−1.
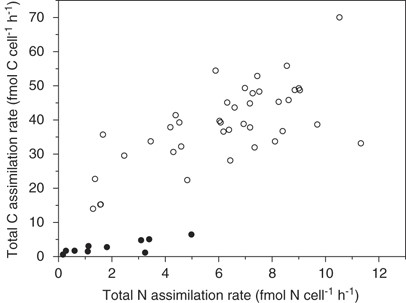
Cell-specific carbon and N2-fixation rates as measured by nanoSIMS. Vegetative cells are shown as open symbols, and heterocysts as closed symbols.
Gross and net C:N fixation ratio, N2-fixation rate, and net NH4+-release rate in Aphanizomenon sp. traced by 15N
| Gross C:N fixation ratio | Net C:N fixation ratio | N2net fixation rate (fmol N cell−1h−1)a | NH4+-release rate (fmol N cell−1h−1) | ||
|---|---|---|---|---|---|
| Light | Light | Light | Dark | Light | Dark |
| 6.3b | 7.3±3.4c | 4.8±3.2 | 0.28±0.15 | 2.6 | 2.2 |
| Gross C:N fixation ratio | Net C:N fixation ratio | N2net fixation rate (fmol N cell−1h−1)a | NH4+-release rate (fmol N cell−1h−1) | ||
|---|---|---|---|---|---|
| Light | Light | Light | Dark | Light | Dark |
| 6.3b | 7.3±3.4c | 4.8±3.2 | 0.28±0.15 | 2.6 | 2.2 |
Measured by nanoSIMS.
Estimating from gross photosynthesis and gross N2 fixation (net N2 fixation+NH4+ release).
Net C and net N2 fixation in light of the same cells measured by nanoSIMS.
We tracked the release of fixed 15N by measuring the production of 15NH4+ in the surrounding water (Table 2). The release of NH4+ was 35% of the total gross N2 fixation in light. The corresponding value was 89% in darkness. The C:N ratio of gross production (gross photosynthesis:gross N2 fixation) was, therefore, 6.3 (Table 2). The NH4+ microenvironment of colonies was modeled, knowing the diffusive properties of colonies from O2 measurements, the net carbon fluxes, the C:N fixation ratio, and fraction of fixed nitrogen released as NH4+. The NH4+-concentration gradients in a colony with O2 gradients similar to the colony shown in Figure 2 are shown in Figure 6. The NH4+ concentration at the colony surface was 5.5 μm when the bulk concentration was 0.15 μm. Hence, ammonium was >37-fold enriched inside colonies as compared with the bulk water concentration.
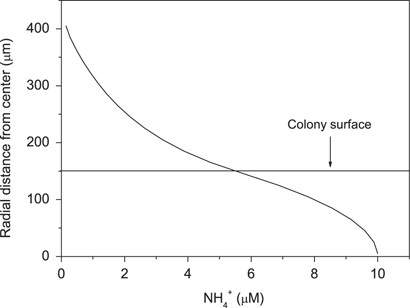
Ammonium gradient at colony–water interface of Aphanizomenon colony modeled from measured O2 fluxes, C-, and N2-fixation rates, and NH4+-release rates.
Discussion
This study is the first to combine microsensors with mass spectrometry and nanoSIMS techniques to understand small-scale fluxes of carbon and nitrogen in a Baltic Sea cyanobacterium among those dominating the summer blooms. It was directly shown that Aphanizomenon is highly productive even during the late stage of its bloom and season in August. High concentrations of biomass in colonies and their productivity lead to significant O2 gradients within these colonies and their surrounding water. The O2 gradients measured during light were similar to those reported in cultured colonies of Aphanizomenon sp. (Carlton and Pearl, 1989). Volume-specific gross photosynthesis was 79 nmol O2 mm−3 h−1 independent of colony size. Hence, there was no indication of diffusion limitation of photosynthesis by CO2 or bicarbonate in these colonies. Volume-specific gross photosynthesis was 10- to 80-fold higher than those measured in surface scums dominated by Nodularia sp. in the Baltic Sea (Ploug, 2008) and of other cyanobacterial surface blooms including Aphanizomenon in inland lakes (Ibelings and Maberly, 1998). This high rate is among the highest reported in aquatic systems, comparable with or higher than those measured in shallow sediments and microbial mats (Jørgensen et al., 1983; Villbrant et al., 1990; Lassen et al., 1992).
Carbon-specific net photosynthesis rates were similar to optimal rates reported using the 14C method in field-sampled Aphanizomenon from the Baltic Sea (Walve and Larsson, 2007) as well as in cultures of Aphanizomenon isolated from the Baltic Sea in the same area as that of this study (Degerholm et al., 2006). The 14C method provides an estimate of photosynthesis, which is usually considered to represent a rate between gross and net photosynthesis (that is the net carbon retainment in the cell). Using microsensors, it was possible to determine net photosynthesis as well as dark respiration, and hence gross photosynthesis on single colonies of wild Aphanizomenon sp. Light microscopy of DAPI-stained colonies revealed that heterotrophic bacterial colonization of cyanobacterial filaments was low (∼300 cells mm per filament; data not shown), as also indicated by the observation that dark respiration, similar to photosynthesis, was proportional to colony volume. Respiration was, therefore, mainly due to the cyanobacterium investigated. On average, it comprised 16% of gross photosynthesis, which partly reflects the cost of N2 fixation. Cell-specific carbon assimilation rates compared well between rates obtained with microsensor techniques directly in colonies and the total C assimilation rates obtained from 13C enrichment incubations.
NanoSIMS analysis showed a large variation of cell-specific net C and N assimilation. This has also been observed in natural populations of other phototrophic microorganisms (Musat et al., 2008). Within trichomes, we measured a rapid transfer of fixed nitrogen from heterocysts to vegetative cells also reported in Anabaena oscillarioides cultures (Popa et al., 2007). Generally, the 15N label intensity in the heterocysts was low compared with that of the vegetative cells. However, a faint label was evident in this cell type already after 3 h, and a more distinct 15N label after 6 h. This is particularly evident in the ‘polar plugs,’ composed of cyanophycin (arginine:aspartic acid in a 1:1 ratio), which are located at the vegetative cell junctions. Hence, although some of the nitrogen fixed is retained in the heterocysts, the newly synthesized products of N2 fixation is primarily exported to the vegetative cells in which it apparently may be directed into three different routs: toward cellular growth, converted into cyanophycin (N storage), or being released extracellularly as ammonium to the environment. In Trichodesmium, the flow of fixed nitrogen into cyanophycin was also shown by nanoSIMS, and these granules may partly uncouple C and N2 fixation from overall growth in cyanobacteria (Finzi-Hart et al., 2009). Moreover, ammonium and DON release in Trichodesmium spp. may amount to ∼50% of N2 fixation (Glibert and Bronk, 1994; Mulholland and Capone, 2001; Wannicke et al., 2009).
The average net C:N assimilation ratio in single cells measured by nanoSIMS was 7.3±3.4 in light, and a large fraction (35%) of the newly fixed N was released as ammonium to the surrounding water. Hence, gross N2 fixation was approximately 1.5-fold higher than net N2 fixation. Gross C:N fixation estimated from gross photosynthesis and gross N2 fixation was 6.3 (Table 2). In the Baltic Sea, the C:N ratio of large (>20 μm) cyanobacteria varies between 6 and 20 (Degerholm et al., 2008). The net C:N fixation ratio varies largely between 1 and 40 presumably because of a variable NH4+ release by the large cyanobacteria (Gallon et al., 2002). Net C- and N-fixation rates by large cyanobacteria are, therefore, not always closely coupled in the Baltic Sea. Our estimates of gross and net C:N fixation rates in light, however, were close to a C:N ratio of 6.6. A high release of DOC or respiration of C could be expected to maintain a lower somatic C:N ratio, when the C:N fixation ratio is high. Such high DOC release as reflected by a large difference between rates obtained with isotopes, which are incubated for 6 h, and those obtained using the microsensor technique, which measures instantaneous photosynthesis, was not observed in our study and has also not been reported elsewhere. Aphanizomenon sp. seldom occurs in the uppermost water column, in which incident light intensities are highest (Hajdu et al., 2007). Integration over a day–night cycle of 10 h:14 h at 3–4 m depth (Secchi depth was 6 m, only) resulted in a lower net C:N fixation ratio of (10 × 38–14 × 8.3):(10 × 4.8+14 × 0.28)=5.1, because N2-fixation rate is reduced and carbon is respired during night.
We are not aware of any reports on endogenous rhythms of C and N2 fixation in Aphanizomenon sp. as reported for Trichodesmium (Berman-Frank et al., 2001; Wannicke et al., 2009). However, net N2 fixation by Aphanizomenon sp. was 17-fold lower during darkness as compared with that in light. Combined NanoSIMS and EA-IRMS analysis of 15N uptake showed that N2 fixation by Aphanizomenon sp. represented 78% and 16% of the bulk N2 fixation during light and darkness, respectively. Hence, 15N2 fixation and the high 15NH4+ release in the bulk during darkness can thus partly be ascribed to other N2-fixing organisms.
Our study directly shows that Aphanizomenon sp. leaks a substantial fraction of its fixed nitrogen as ammonium to the surrounding water. Leakage of ammonium, however, could partly be due to breakage of cells during the incubations and filtration procedures or because of lysed cells. Microscopic analysis and nanoSIMS images did not reveal a significant number of broken cells. A recent study using alternative techniques without potential filtration artifacts has shown a similar high light-dependent ammonium release in Nodularia sp. in the Baltic Sea (Ploug and Adam, unpublished). In this study, modeled NH4+ concentrations inside Aphanizomenon colonies were 37-fold higher than that of the bulk (Figure 6), and such colonies could potentially be a microenvironment favorable for growth of heterotrophic bacteria. Many pelagic bacteria are motile, show chemotaxis toward aggregate nutrient sources, and their colonization times are in the order of minutes (Kiørboe et al., 2002). However, bacterial colonization of Aphanizomenon colonies was low (data not shown). O2 gradients measured during dark were also less steep as compared with those measured in cultured colonies (Carlton and Pearl, 1989). Lower abundance of attached bacteria on Aphanizomenon colonies than on Nodularia sp. has been observed earlier in the Baltic Sea (Ulla Rasmussen and B Bergman, unpublished). The reason as to why Aphanizomenon filaments are poorly colonized by heterotrophic bacteria is unclear, but may be explained by release of secondary metabolites with high concentrations inside colonies similar to the high concentrations of O2 and ammonium during light as shown here.
During summer, Aphanizomenon sp. occurs at average abundances up to 20 ml−1 in the upper 20 m of the water column with peaks around 40–60 ml−1 in the Baltic Sea (Hajdu et al., 2007; Rolff et al., 2007; Degerholm et al., 2008). This abundance may be represented by 200–300 average-sized colonies per liter (Figure 1). Buoyancy in Aphanizomenon is controlled by the numerous gas vesicles forming larger gas vacuoles that may occupy a large proportion of the vegetative cell volume. In addition, colony formation increases the buoyancy capacity over that held by single filaments (Reynolds and Walsby, 1975). This is supported by the observation that cell fraction volumes in colonies on average are as high as 0.19 as measured in this study. Using this buoyancy capacity, colonies can position themselves at favorable light and/or nutrient conditions in the water column to capture the energy needed for N2 fixation through photosynthesis during day and migrate below the pycnocline at night presumably to take up other nutrients, for example orto-phosphate (Reynolds and Walsby, 1975; Walsby et al., 1997; Hajdu et al., 2007).
Combining all measurements, we can make a budget of the small-scale fluxes of carbon and nitrogen in Aphanizomenon sp. For each mole carbon fixed at saturating light intensity, 0.16 was respired and 0.16 mol N2 was fixed of which 0.05 mol was released as NH4+ to the surrounding water. Our study also showed that net C and N assimilation by Aphanizomenon sp. was 5.4 nmol C m−1 filament h−1 and 0.74 nmol N m−1 filament h−1, respectively, at saturating light intensities, and −1.3 nmol C m−1 filament h−1 and 0.04 nmol N m−1 filament h−1, respectively, in darkness. Extrapolating these data back to the Baltic Sea and assuming an average abundance of Aphanizomenon sp. of 20 ml−1 in the upper 4 m water column (Hajdu et al., 2007; Degerholm et al., 2008), these rates correspond to 108 nmol C l−1 h−1 and 15 nmol N l−1 h−1 at saturating light intensities, and −26 nmol C l−1 h−1 and 0.86 nmol N l−1 h−1 during darkness. Integrating the net C fixation and net N2 fixation by Aphanizomenon sp. in the upper 4 m assuming saturating light intensities during 10 h light and 14 h darkness yields a net C assimilation rate of 2.9 mmol C m−2 per day, and a net N2 fixation rate of 0.55 mmol N m−2 per day for only Aphanizomenon sp. In this calculation, dark respiration consumes approximately 50% of the C fixed during daytime, and net N2 fixation during dark comprises 10% of the total, daily net N2 fixation, only. The estimate of daily net N2 fixation is close to the average measured value of integrated N2-fixation rate by cyanobacteria (>20 μm) occurring at an average abundance of 20 m l−1 in the Baltic Sea (Degerholm et al., 2008). Considering that Aphanizomenon sp. blooms approximately 60–90 days per year, our measurements suggest that its potential net N2 fixation may be in the order of 30–45 mmol N2 m−2 per year, and the gross N2 fixation may be at least up to 70 mmol N2 m−2 per year (excluding NH4+ release during darkness). During a 3-year study, N2 fixation by cyanobacteria (>20 μm) in the Baltic Sea was recently reported to range between 21 and 78 mmol N m−2 per year, and it contributed between 64% and 88% to total N2 fixation measured at the same stations. (Degerholm et al., 2008). Cyanobacterial blooms are characterized by high spatial and temporal variability in the Baltic Sea, and local concentrations of Aphanizomenon sp. can vary considerably, for example from 2 to 60 ml−1 during summer (Hajdu et al., 2007; Rolff et al., 2007; Degerholm et al., 2008). Local N2 fixation by large cyanobacteria, therefore, varies depending on their abundance, physiological conditions, and chemical/physical parameters in the water column. Budget calculations of inorganic nitrogen in the Baltic Sea indicate that total N2-fixation rates range between 60 to 140 mmol N m−2 per year (Larsson et al., 2001). 15N tracer studies suggest N2-fixation rates to range between 101 and 263 mmol N m−2 per year (average: 125 mmol N m−2 per year) (Wasmund et al., 2001). On the basis of our study, we can conclude that Aphanizomenon sp. contributes significantly to the overall N2 fixation of which a substantial fraction is directly released as NH4+ into the surrounding water. Aphanizomenon sp. thus seems to be a significant player in large-scale carbon and nitrogen biogeochemical fluxes in the Baltic Sea.
Acknowledgements
This study was supported by a Marie Curie Fellowship to HP (AHICA; 219976) and the Max Planck Society. We thank the staff at the Marine Science Center (Askö Laboratory) and Marcel Günter for assistance in the field and in the laboratory. Malin Mohlin is thanked for advice using the counting chamber. We also thank three anonymous reviewers for their thoughtful comments to the manuscript.
References
Helcom (Helsinki commission) (1988). Guidelines for the Baltic Monitoring Programme for the Third Stage, Part D. Biological Determinants. Balt Sea Environ Proc 27 D, Baltic Marine Environment Protection Commission: Helsinki, pp 23–54..
Author notes
Helle Ploug and Niculina Musat: These two authors contributed equally to this work.
