


Abstract
Delimitation of allopatric populations into species remains subjective and largely arbitrary. Many cold-adapted species from the sub-Arctic and Central and Southern European Mountain systems provide excellent models to study allopatry problem due to their patchy distributions. The same concerns many Holarctic species, which frequently show varying degrees of differentiation between continents. In this study, we analyze high-throughput target enrichment data for 10 groups of Arctic-alpine and Holarctic lepidopteran species sampled from different regions across the Holarctic realm, i.e., Fennoscandia, European Alps, Altai Mountains, and North America. We first aimed to assess whether the genetic differences in the nuclear genome reflected observed DNA barcode divergences and, secondly, whether the gap between population and species-level differences can be reliably dissected using genomic data. We compared the phylogenetic trees and uncorrected pairwise genetic distances obtained from target enrichment and mitochondrial COI barcodes and performed a suite of population genetic and species delimitation analyses to further explore patterns of intraspecific variation in our study species. We observed that in about one-half of the cases, DNA barcodes showed phylogenetic relationships similar to the target enrichment markers. Nuclear genetic differentiation varied among the populations analyzed, from low differentiation of geographically separated populations to the deeper separation of some Nearctic populations and Arctic-alpine disjunction in the populations from Fennoscandia and Southern European mountains. Our results highlight the need for consistent delimitation of allopatric populations, especially given the prevalence of distributional discontinuities across species. Large sets of standard genetic markers provide a very promising avenue towards this goal.
Introduction
Species delimitation, despite being one of the main tasks of taxonomic research, remains challenging. This is largely due to the ontological issues around the term “species” as a variety of different species concepts have been proposed; moreover, there are difficulties in reaching a consensus over what a “species” is (De Queiroz 2007). Perhaps even more importantly, delimitation is difficult due to obscured boundaries between species under different settings and due to arbitrary boundaries during the long and continuous process of speciation (Nosil 2008). The traditional way of delimiting species using morphology has limitations, particularly in cases of cryptic diversity, i.e., when the taxa are genetically distinct with only minor or no morphological differences (Knowlton 1993, Packer et al. 2009). Morphological practices also tend to be slow and time-consuming and are often biased due to personal preferences of the taxonomists (Godfray 2002, Meier et al. 2006). Additionally, delimitation based on morphological traits across taxa is hard to achieve in a consistent way. The development of DNA-based approaches shows promise for overcoming these problems, and mitochondrial cytochrome oxidase I (COI) barcoding has become a widely used DNA-based approach to species identification and delimitation as well as biodiversity monitoring (Hebert et al. 2003, Taberlet et al. 2012). While curated DNA barcode libraries are useful in rapid species discovery and can also be effective in revealing potential cryptic species (Mutanen et al. 2016), such single-locus approaches do suffer from certain limitations, e.g., retention of ancestral polymorphisms, female-biased gene flow, asymmetrical introgression, paralogy, and Wolbachia-mediated genetic sweeps (Funk and Omland 2003, Ballard and Whitlock 2004, Moritz and Cicero 2004), rendering COI gene trees to deviate from the true species tree.
As the cost of sequencing continuously decreases, genomic-scale data generated through high-throughput sequencing technologies is now routinely used in both phylogenetic inference and species delimitation (Herrera and Shank 2016, Breinholt et al. 2018, Grummer et al. 2018, Pie et al. 2019). Approaches such as sequence capture allow obtaining thousands of single-copy target loci from a relatively large number of samples even with degraded DNA, thus providing greater resolution for solving long-standing taxonomic problems at all levels of divergence (Faircloth et al. 2012, Mayer et al. 2021, Joshi et al. 2022). Recent years have seen the development of powerful species delimitation programs developed in statistically rigorous frameworks such as multispecies coalescent (MSC) and Bayesian frameworks (e.g., SNAPP, Leaché et al. 2014, BPP, Yang 2015) that are suitable for those kinds of multilocus data that show promise for bringing more objectivity to species delimitation. Additionally, simulations have demonstrated the increasing accuracy and robustness of these methods in the presence of different biological processes, such as gene flow and incomplete lineage sorting (ILS) (Jackson et al. 2017, Zhang et al. 2018). There are also new sets of software packages available that are faster and scalable for larger datasets (Fujisawa et al. 2016, Rabiee and Mirarab 2020), which can overcome the computational limitations imposed by Bayesian programs.
Geographically widespread taxa pose a particular challenge for species delimitation as their distributions often tend to be uneven and may consist of populations with allopatric ranges that show extensive intraspecific variability across space (Mutanen et al. 2012). In the case of allopatric populations, it is difficult to assess reproductive compatibility, and the decision to define genetically separated populations as distinct species depends greatly on the species concept applied and the taxonomist’s subjective idea of species boundaries and taxonomically important features (Funk and Omland 2003), thus making species delimitation of allopatric populations arbitrary and often unstable. Furthermore, geographically separated populations tend to show strong population structure due to the restriction of gene flow (Huang 2020), which is often interpreted as species divergence by most of the molecular species delimitation approaches, particularly those that are based on the Multispecies Coalescent (MSC) framework (Sukumaran and Knowles 2017, Luo et al. 2018, Leaché et al. 2019, Chambers and Hillis 2020). As allopatric populations often show ceased gene flow and gradual differentiation, distinguishing population and species-level differentiation under such circumstances is a fine line and probably impossible to conduct in a totally objective manner.
Species distributed in mountainous habitats form a classic example of patchy distributions with frequent allopatry. Arctic-alpine species provide an excellent model to study the allopatry problem as their disjunct distributions are typically the result of repeated cycles of range expansion and contraction, driven by the glacial oscillations during the Quaternary (Hewitt 2004). These cold-adapted species evidently had a widespread, contiguous distribution during the ice ages and, as a result of increased postglacial warming, shifted northward into the boreal, sub-Arctic, and Arctic belts and into mountain areas in more southern regions, resulting in increased spatial separations (Schmitt 2007). For Holarctic taxa, the distributions are particularly large and often encompass the entire northern hemisphere (Schmitt et al. 2010). Numerous studies exist that have examined patterns and levels of genetic divergence between taxa distributed in Arctic and alpine biogeographic zones (Muster and Berendonk 2006, Schmitt et al. 2006, 2016, Schmitt 2007, Hou et al. 2015, Lindholm et al. 2016, György et al. 2018). However, these studies have usually focused on small geographic regions and have almost always been based on a limited number of genetic markers.
Accumulation of massive barcoding libraries along with a comparatively well-established taxonomy has allowed taxonomists to study patterns of genetic divergences of the mitochondrial COI gene on large geographic scales for megadiverse insect orders such as Coleoptera and Lepidoptera (Bergsten et al. 2012, Huemer et al. 2014, 2018). These studies have shown that in mtDNA, intraspecific divergences tend to increase with sampling intensity and geographic distance. Cases of deep intraspecific barcode divergences in Arctic and alpine taxa and between Alps/Fennoscandia vs. North America might well point to potentially overlooked species (Mutanen et al. 2012). Several other studies also revealed inconsistencies in so-called ‘barcode gaps’ in well-sampled groups (Meyer and Paulay 2005, Wiemers and Fiedler 2007), highlighting the need to examine the thresholds of intra- and interspecific variation in more detail using nuclear loci.
Here, we use genomic-scale data to study intraspecific divergence patterns on a broad geographic scale. More specifically, we use a target enrichment approach to understand the intraspecific patterns and to delimit the allopatric populations of 10 species of Lepidoptera with an Arctic-alpine and Holarctic distribution. These species were deliberately selected to represent various geographic patterns in their COI gene across their geographic range. We first examined if COI divergences provide an acceptable proxy for the genome-wide divergences by comparing uncorrected pairwise distances and phylogenetic structure between the allopatric populations of the focal species. We secondly investigated the usefulness of the target enrichment approach in delimitation of allopatric populations. To reach this goal, we made use of population genetics, multispecies coalescent, and recently developed species delimitation approaches designed for genomic data. Our sampling includes individuals from 4 major regions across the Holarctic realm—Fennoscandia (Northern Europe), the European Alps (with a few samples from the Apennine mountains and the Pyrenees, Central and southern Europe), the Altai mountains (Asia), and the Nearctic (North America). Samples collected from each respective geographic realm were treated as a separate population in our analyses. Alpine populations in particular frequently show a clear disjunction to the Arctic populations, and similarly, Nearctic populations are separated from the Palearctic ones by the Bering Strait, although in most species, it remains unclear how much, if any, gene flow presently occurs between these regions. The Altai populations in turn may be more closely connected to the North European populations as physical or climatic distinction is less evident. We, therefore, also investigated the presence of historical and ongoing introgression among these populations. Our study aims to provide insights into the genetic patterns of a set of widely distributed Palearctic and Holarctic taxa. This study further intends to contribute to the discussion on how to establish more reliably justified and repeatable standards for the delimitation of allopatric populations by genomic means since their delimitation presently lacks a solid epistemological foundation.
Materials and Methods
Study Species and Sample Preparation
We selected 10 lepidopteran species with varying distribution patterns—with Arctic-alpine, continuous or disjunct Palearctic distribution, and continuous or disjunct Holarctic distribution. Samples were collected from various sites across the 4 main regions (Fig. 1). The species identifications were initially made by sample collectors but later verified by the Lepidoptera species experts of our author team. They were also validated by their DNA barcodes and other obtained genetic data. Voucher photographs and specimen collection data are available in the BOLD database. Table 1 gives the number of taxa and an overview of the populations analyzed for each species, as well as its distribution type. Further details regarding sample localities are given in the Supplementary Information (SI, Supplementary Table S1). Genomic DNA was extracted from either the thorax or one or more legs of dry specimens using the QIAGEN DNeasy Blood and Tissue Kit (Hildesheim, Germany) or the Omega Bio-tek E.Z.N.A. Insect DNA Kit (Norcross, United States) following the protocols given by the manufacturers.
No. of samples included for each species, populations sampled, outgroup information, No. of SNPs, and the lengths of barcode alignments and concatenated target enrichment alignments. Population codes: FEN, Fennoscandia; NA, North America
| Species | Distribution type | No. samples | Populations | No. of concatenated loci | No. of SNPs | Final barcode alignment length | Length of concatenated target enrichment dataset |
|---|---|---|---|---|---|---|---|
| Elophos vittaria | Palearctic, boreo-montane, disjunct | 12 | FEN, Alps | 529 | 4,906 | 660 | 149,649 |
| Eudonia sudetica | Palearctic, boreo-montane, disjunct | 16 | FEN, Alps, Andorra | 635 | 5,475 | 678 | 176,727 |
| Syngrapha hochenwarthi | Palearctic, arctic-alpine, disjunct | 16 | FEN, Alps, Altai | 718 | 5,603 | 681 | 213,783 |
| Xestia speciosa | Palearctic, boreo-montane, disjunct | 16 | FEN, Alps, Altai | 640 | 7,263 | 684 | 195,747 |
| Agriades glandon | Holarctic, arctic-alpine, disjunct | 15 | Alps, NA | 485 | 5,331 | 662 | 142,878 |
| Arctia caja | Holarctic, temperate, continuous | 19 | FEN, Alps, NA, Altai | 987 | 11,625 | 660 | 340,965 |
| Carsia sororiata | Holarctic, boreo-montane, continuous | 20 | FEN, Alps, NA, Altai | 774 | 5,979 | 658 | 213,807 |
| Coenonympha tullia | Holarctic, boreo-montane, continuous | 17 | FEN, Alps, NA | 686 | 12,601 | 657 | 176,310 |
| Macaria brunneata | Holarctic, boreo-montane, continuous | 20 | FEN, Alps, NA, Altai | 658 | 6,142 | 661 | 181,569 |
| Xestia lorezi | Holarctic, arctic-alpine, disjunct | 15 | FEN, Alps, NA | 685 | 3,853 | 683 | 210,357 |
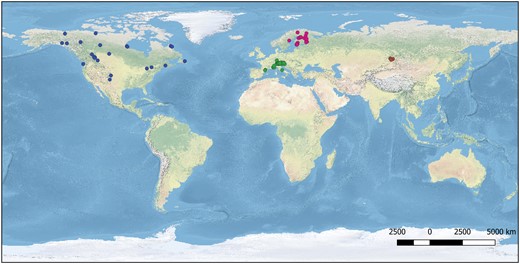
The map of sampling localities.
Target Enrichment Data Generation
Target enrichment bait design followed Mayer et al. (2021), in which the final probe kit targets 2,953 CDS regions in 1,753 nuclear genes. This kit was developed with BaitFisher version 1.2.8 (Mayer et al. 2016) and is referred to as the LepZFMK 1.0 kit. The details of target enrichment laboratory procedures are given in SI. The raw demultiplexed data received from the sequencing provider were processed with the TEnriAn (Target Enrichment ANalysis) pipeline (Mayer et al. 2021). Detailed analysis steps are given in SI. Additionally, we performed ‘variant calling’ for each of the 10 study species using the ingroup sample with the highest number of orthologous clusters inferred (during the orthology assessment step in the TEnriAn workflow) as a reference, similar to the procedure mentioned by Zarza et al. (2016) and Erickson et al. (2020) for UCE data. The details of SNP calling can be found in the SI. The final number of SNPs retained for each species is mentioned in Table 1.
Barcoding Data
We analyzed mitochondrial DNA barcodes for the same set of samples for each of the 10 case studies. Several barcodes were publicly available for some of the samples for each species and were retrieved from BOLD. For the remainder of the samples, we either sequenced the mitochondrial COI region from DNA extracts in the lab or extracted the barcode region from the target enrichment data using exonerate ver. 2.4.0 (Slater and Birney 2005). The details of both procedures can be found in SI. All the barcodes for each species were aligned in Geneious Prime using Muscle ver. 5.1 (Edgar 2004). The final barcode alignment lengths for each species can be found in Table 1. Phylogenetic trees of the aligned COI sequences were generated using IQTREE ver. 2.0.3 (Minh et al. 2020b), details of which are given in SI.
Target Enrichment Phylogenetics
For target enrichment data, we carried out phylogenetic analyses using both concatenation and coalescent approaches. Maximum Likelihood (ML) phylogenetic analyses for the target enrichment data were performed using IQTREE, while the species tree was estimated in ASTRAL-III v. 5.7.4 (Zhang et al. 2018), which is statistically consistent under the multispecies coalescent framework and takes into account ILS while inferring the species tree. The details of both analyses are given in SI. The final trees were visualized in Figtree rooted on their selected outgroups.
To better understand topological conflict around each branch of the ASTRAL species tree, we calculated gene and site concordance factors (gCF and sCF) in IQTREE (Minh et al. 2020a) using the same set of gene trees used as an input for ASTRAL.
Uncorrected P-Distances
We calculated the uncorrected pairwise genetic distances or P-distances using PAUP* ver. 4 (Swofford 1998) for the target enrichment concatenated dataset and the barcodes, excluding the outgroup from the alignment. The calculated distances were grouped into different categories which included comparing individuals from each population with one another as well as within-population comparisons. The absolute values of distances were visualized as boxplots using the R 4.0.4 (R core Team 2021) package ggplot2 (Wickham 2016). For each species, both barcode and target enrichment distances from each category were compared using the Wilcoxon signed rank test (Rey and Neuhäuser 2011), performed in R.
Population Genetics
For each study species, we performed a principal component analysis (PCA) on the SNP dataset using the dudi.pca function from the R package adegenet (Jombart and Ahmed 2011). Additionally, we calculated pairwise FST for each population pair in each of the 10 study species using R package hierfstat (Goudet 2005). FST is a measure of population differentiation and quantifies the differences in allele frequencies among the populations. We also performed a STRUCTURE analysis (Pritchard et al. 2000) for each study species to infer the presence of admixture among the populations (details in SI).
Analysis of Introgression
We tested for historical introgression among populations using Patterson’s D-statistics implemented in the program Dsuite (Malinsky et al. 2020). This test computes the excess of alleles in one species/population (usually denoted as P3) in relation to 2 sister species/populations (P1 and P2) and a 4th outgroup species as a reference. As the program requires at least 3 populations to be present in the dataset, the analysis was not done for E. vittaria, A. glandon, and X. lorezi. For the rest of the species, we used datasets containing only biallelic SNPs that also included the respective outgroups chosen for each species. The D-statistic was calculated using Dtrios command, which calculates ABBA-BABA proportions and f4-ratio statistics for all possible trios of populations/species.
Species Delimitation
To test for the presence of species-level differentiation in our datasets, we performed species delimitation analyses using different programs. To test alternative scenarios in which different populations are made up of a single or several distinct species, we used program tr2, a multilocus species delimitation method that finds the best delimitation based on a distribution model of rooted triplets (Fujisawa et al. 2016). We also tested the quartet-based species delimitation method SODA (Rabiee and Mirarab 2020), which is designed to be scalable to large datasets. Finally, we calculated the Genealogical Divergence Index (gdi) (Jackson et al. 2017) for the genetically distinct clades identified from phylogenetic analyses to determine whether their separation corresponded to species-level divergences with BPP as described in Leaché et al. (2019). For this, we used the complete dataset with all loci included for each species. The details of all the analyses are given in SI.
Results
Dataset Overview
The total number of concatenated loci after various filtering steps for each species can be found in Table 1. The number of informative loci and the missing data for each individual from all the species can be found in Supplementary Table S1. The highest number of informative loci was captured in A. caja (avg. no. of loci = 868, std. dev. = 35.8) and the lowest in A. glandon (avg. no. of loci = 406, std. dev. = 18.3). The highest percentage of missing data was observed in C. tullia (avg. = 33.9%, std. dev. = 0.11, Supplementary Table S1), while the lowest was observed in A. caja (avg. = 10.6%, std. dev. = 0.06, Supplementary Table S1).
P-Distance Comparisons
Figure 2 shows the P-distance boxplot comparisons for each study species. For E. vittaria, the comparison varied greatly for genetic distances between the Alps and Fennoscandia. While the median value for target enrichment distances fell between 0.15% and 2%, for barcodes, it was higher than 5%. For E. sudetica, we observed a remarkable variation in barcode P-distance values for within the Alps/Apennines category, caused by a divergent individual from Italy/Apennines (TLMF Lep 03039; note that this individual clusters with 4 barcoded specimens from Central Italy). Target enrichment P-distance values on the other hand remained below 2%. For S. hochenwarthi, medians for both distances across all the categories were below 1%, nevertheless significant differences were observed between both barcode and target enrichment P-distances across all of the categories, except for the Alps-Altai (P < 0.05, Wilcoxon signed-rank test). For X. speciosa, which is known to have a barcode split in Europe (Huemer et al. 2018), target enrichment P-distances were observed to remain below 1% for all the categories, while barcode distances were greater than 2% for FEN-Alps and Alps-Altai categories.


P-distance comparison boxplots for A) Elophos vittaria B) Eudonia sudetica C) Syngrapha hochenwarthi D) Xestia speciosa E) Agriades glandon F) Arctia caja G) Carsia sororiata H) Coenonympha tullia I) Macaria brunneata J) Xestia lorezi.
For the Holarctic taxa A. glandon, A. caja, C. sororiata, and M. brunneata, we observed a larger variation in barcode P-distance values than the target enrichment P-distances. The exception to this pattern was the WithinNA category (nonsignificant differences in medians of barcode and target enrichment distances: Wilcoxon signed-rank test). We also observed that the barcode P-distance values for the WithinNA category regularly varied greatly, the only exception being C. tullia. The target enrichment P-distance values for the Holarctic taxa tended to stay below 1%, with the exception once more being C. tullia, where they were all above 1%. For X. lorezi, all 3 populations, i.e., NA, Alps, and FEN, showed deep barcode splits (more than 2%). A similar deep split was observed in the barcodes for C. tullia, where the distance between the Nearctic and both Palearctic populations was greater than 3%. Similarly, for M. brunneata, the medians of the barcode distances between the Nearctic and each of the Palearctic populations were greater than 2%. We did not observe deep splits in the C. sororiata and A. caja barcodes.
Phylogenetics and Population Genetics
In each of the study species, we compared the phylogenetic trees inferred from the barcode data, concatenated target enrichment data, and ASTRAL species tree, as well as the population genetic methods and observed discordance in some cases. In the case of E. vittaria, a discordance between different phylogenetic approaches was observed, although ASTRAL and other approaches, such as PCA and FST supported divergence between the Alps and Fennoscandia (Figs. 3A and 4A; Supplementary Fig. S1A). Similarly, the phylogenetic relationships between E. sudetica populations were observed to vary between the 3 phylogenetic approaches, although in all 3 cases, FEN specimens clustered together (Fig. 3B and Supplementary Fig. S1B), as did the individuals from the Pyrenees (Fig. 3B and Supplementary Fig. S1B). The individual TLMF Lep 03039 from the Apennines was genetically quite divergent in all the analyses. The Arctic-alpine disjunction, i.e., separation of northern and southern populations, can be observed from PCA, FST, and STRUCTURE analyses.


Species delimitation analyses mapped onto ASTRAL tree for A) E. vittaria, B) E. sudetica, C) S. hochenwarthi, D) X. speciose, E) A. glandon, F) A. caja, G) C. sororiata, H) C. tullia, I) M. brunneata, J) X. lorezi. ** The individual BIOUG18201-F11 from Newfoundland was later revealed to represent a closely related Arctia opulenta (Edwards, 1881) rather than A. caja.
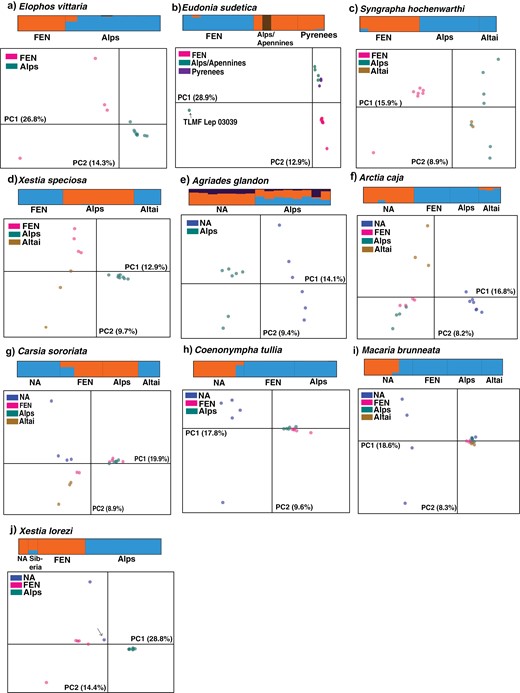
PCA and STRUCTURE K = 2 or K = 3 barplot for A) E. vittaria, B) E. sudetica, C) S. hochenwarthi, D) X. speciose, E) A. glandon, F) A. caja, G) C. sororiata, H) C. tullia, I) M. brunneata, J) X. lorezi. For X. lorezi, the individual which was revealed to be from Southeastern Siberia is marked with an arrow in the PCA plot.
For S. hochenwarthi, our results supported the genetic separation of the FEN population in the phylogenetic trees (Fig. 3C and Supplementary Fig. S1C) as well as PCA, STRUCTURE, and pairwise FST (Fig. 4C; Table 2). The remainder of the individuals from the Alps and Altai populations were observed to be paraphyletic with respect to the FEN cluster in the phylogenetic trees. For X. speciosa, we observed a discordance between the phylogenetic relationships as seen in concatenation and coalescent approaches. However, our analysis of nuclear data using ASTRAL, PCA, STRUCTURE, and FST supported the genetic distinctiveness of the Alps population (Fig. 4D; Table 2) and hinted at only an insignificant divergence between FEN and Altai population.
Pairwise FST values for each population comparison. Population codes: FEN, Fennoscandia; NA, North America
| FEN-Alps | FEN-Altai | Alps-Altai | NA-FEN | NA-Alps | NA-Altai | FEN-Pyrenees | Alps-Pyrenees | |
|---|---|---|---|---|---|---|---|---|
| E. vittaria | 0.279 | – | – | – | – | – | – | – |
| E. sudetica | 0.349 | – | – | – | – | – | 0.390 | 0.207 |
| S. hochenwarthi | 0.203 | 0.197 | 0.024 | – | – | – | – | – |
| X. speciosa | 0.134 | 0.016 | 0.119 | – | – | – | – | – |
| A. glandon | - | – | – | – | 0.117 | – | – | – |
| A. caja | 0.019 | 0.085 | 0.120 | 0.342 | 0.379 | 0.273 | – | – |
| C. sororiata | 0.083 | 0.270 | 0.476 | 0.280 | 0.392 | 0.092 | – | – |
| C. tullia | 0.019 | – | – | 0.222 | 0.187 | – | – | – |
| M. brunneata | 0.024 | 0.056 | 0.091 | 0.176 | 0.183 | 0.139 | – | – |
| X. lorezi | 0.346 | – | – | – | – | – | – | – |
For A. glandon, we observed a mitonuclear discordance, along with the discordance between the trees inferred from coalescent and concatenation approaches. In general, our nuclear genetic data, particularly ASTRAL, PCA, and pairwise FST supported the genetic separation of the Alps and the NA population (Figs. 3E and 4E; Table 2), while STRUCTURE showed the signs of admixture in both populations. The mitonuclear discordance was also observed in the case of A. caja, while the trees inferred from target enrichment ML and ASTRAL differed only slightly, i.e., mainly in the relationships of populations within Eurasia. All the analyses using target enrichment data supported the divergence of the NA cluster. This Nearctic population further displayed intracontinental divergence in all of the phylogenetic trees (2 separate clades, each with individuals from Canada and the USA) as well as from the P-distances. Signs of admixture were present between NA and the Altai population as shown by the STRUCTURE results (Fig. 4F).
In the case of the Holarctic C. sororiata, which displays a boreo-montane disjunction, we did not observe any clear geographic pattern in any of the approaches. Two genetic clusters, each belonging to Altai-NA and Alps-FEN populations, were apparent in our analyses, with 2 of the FEN individuals showing signs of admixture with the NA-Altai genetic cluster (individuals MM27371 and MM27370). Regarding C. tullia, the barcode and ASTRAL trees revealed the presence of 2 separate clusters, one corresponding to the FEN and Alps individuals and the second to the NA individuals (Supplementary Fig. S1G and Fig. 3H). These results were further supported by STRUCTURE, PCA, and FST showing genetic distinctiveness of the NA individuals and lack of genetic separation between FEN and Alps populations.
In the case of M. brunneata, the Eurasian populations, i.e., Alps, FEN, and Altai, showed no genetic separation (Fig. 3I and Supplementary Fig. S1I). The Nearctic population was not observed to form a monophyletic group as the individuals from Alberta clustered together within the Eurasian clade and were observed to have a Eurasian gene pool as suggested by STRUCTURE and PCA (Fig. 4I). In the case of the Arctic-alpine X. lorezi, we observed genetic distinctiveness of both the Alps and FEN populations in all 3 phylogenetic approaches with high support values as well as from a relatively high FST of 0.346 between the 2 populations. Trees based on all 3 approaches supported the close phylogenetic relatedness between the FEN population and 2 individuals each from North America and southeastern Siberia with varying support values; the phylogenetic position of the latter individuals, however, was different in the 3 approaches.
gCF and sCF
Based on the sCF vs. gCF plots, we observed that the gCF values remained on the lower side (between 0 to 25) irrespective of the quartet support values, while the sCF values ranged from 25 to 75 for all the studied species (Supplementary Fig. S4). The only exception to this pattern was E. sudetica, in which gCF values above 25 and sCF values above 75 were observed. We noticed an overall weak positive correlation between sCF and quartet support values in most of the studied species (except A. glandon), i.e., most of the branches with high quartet support showed higher sCF values.
Analysis of Introgression
The test for historical introgression was performed for populations of 7 species. Out of these, high D-statistics (>0.25) with significant P-values (P < 0.05) were observed in A. caja and C. sororiata (Table 3). In A. caja, the high value D-statistic as well as Z-score value were significant for FEN, ALT, and NA comparison (P < 0.05), suggesting an excess of ABBA pattern and thus evidence for introgression between the Altai and the Nearctic population. Similarly, in C. sororiata, the high D-statistic and Z-score were observed for 2 population combinations, suggesting introgression between the Fennoscandian and both the Altai and the Nearctic populations. A high value of the D-statistic was also observed in E. sudetica; however, it was not statistically significant (P > 0.05).
D-statistic summary table. Significant values of D-statistic (P < 0.05) are indicated in bold. Population codes: FEN, Fennoscandia; NA-North America; PY, Pyrenees
| P1 | P2 | P3 | D-statistic | Z-score | P-value | f4-ratio | BBAA | ABBA | BABA | |
|---|---|---|---|---|---|---|---|---|---|---|
| E.sudetica | FEN | PY | Alps | 0.229 | 1.687 | 0.092 | 0.356 | 17,591 | 17,212 | 10,809 |
| S. hochenwarthi | ALT | Alps | FEN | 0.033 | 0.686 | 0.493 | 0.041 | 101,791 | 98,294 | 92,101 |
| X. speciosa | ALT | FEN | Alps | 0.066 | 2.590 | 0.010 | 0.102 | 176,461 | 134,545 | 117,985 |
| A. caja | FEN | Alps | ALT | 0.010 | 0.103 | 0.918 | 0.015 | 16,852 | 10,214 | 10,003 |
| Alps | ALT | NA | 0.278 | 1.953 | 0.051 | 0.169 | 17,137 | 14,705 | 8,306 | |
| FEN | ALT | NA | 0.254 | 2.128 | 0.033 | 0.163 | 18,108 | 15,387 | 9,160 | |
| FEN | Alps | NA | 0.019 | 0.166 | 0.868 | 0.009 | 25,378 | 9,243 | 8,894 | |
| C. sororiata | Alps | FEN | ALT | 0.40 | 2.73 | 0.01 | 0.15 | 18,80 | 8,28 | 3,54 |
| ALT | NA | Alps | 0.01 | 0.05 | 0.96 | 0.00 | 24,99 | 4,77 | 4,70 | |
| NA | ALT | FEN | 0.10 | 0.80 | 0.42 | 0.10 | 20,98 | 5,63 | 4,57 | |
| Alps | FEN | NA | 0.35 | 2.47 | 0.01 | 0.18 | 18,76 | 7,38 | 3,57 | |
| C. tullia | FEN | Alps | NA | 0.05 | 1.56 | 0.12 | 0.04 | 108,66 | 57,34 | 52,11 |
| M. brunneata | Alps | FEN | ALT | 0.16 | 2.60 | 0.01 | 0.19 | 29,47 | 23,29 | 16,85 |
| Alps | ALT | NA | 0.09 | 0.92 | 0.36 | 0.10 | 43,41 | 21,17 | 17,65 | |
| ALT | FEN | NA | 0.01 | 0.07 | 0.95 | 0.01 | 48,16 | 19,52 | 19,32 | |
| Alps | FEN | NA | 0.11 | 2.05 | 0.04 | 0.12 | 59,74 | 22,27 | 17,84 |
Species Delimitation
Our species delimitation analyses suggested that tr2 had the highest tendency to split populations into separate species, followed by SODA (Supplementary Table S4). The −log(likelihood) values for all the models tested in tr2 for each of the 10 species can be found in SI. In general, tr2 was observed to support geographically separated populations as separate species (Fig. 3). For E. vittaria, E. sudetica, and X. speciosa, tr2 and SODA analysis suggested the same delimitation, supporting the separation of Palearctic Arctic-alpine populations into distinct species in E. vittaria and E. sudetica and a separation of the Alpine population as a distinct species in the case of X. speciosa. In S. hochenwarthi and A. glandon, the SODA analysis combined all the populations together into a single species, suggesting the absence of species-level differences. For the Holarctic taxa A. caja and C. sororiata, SODA analysis lumped FEN and Alps populations together. For the species C. tullia and M. brunneata, both tr2 and SODA analyses grouped the Eurasian populations into a single species. However, in connection with C. tullia, the SODA analysis suggested that the individual from Nunavut represented a separate species, while the tr2 analysis included it with its Eurasian counterparts. In the case of M. brunneata, a model where Yukon individuals were lumped together with the Eurasian individuals received the best support as compared to the other models in tr2. Regarding X. lorezi, SODA failed to produce any acceptable delimitation when we separated the NA individual and the individual from Siberia into separate populations because it requires at least 2 individuals per population to produce a reliable result (Rabiee and Mirarab 2020). Interestingly, in tr2, the support for a model in which we assigned these 2 individuals (from Canada and Siberia) to 2 separate populations and a model in which they were grouped together had the same −log(likelihood) value (−354.31, SI).
Genealogical Divergence Index (gdi) analysis supported both populations of E. vittaria as separate species (gdi> 0.7, Fig. 4). The same was true for the Pyrenean population of E. sudetica. For the rest of the splits of E. sudetica, the gdi values fell between established thresholds of intra- and interspecific divergence (0.2 < gdi < 0.7). The same held true for the FEN cluster in the case of S. hochenwarthi and for most of the splits in relation to X. speciosa. For A. glandon, both Alps and NA populations were inferred as separate species in the gdi analyses (Fig. 3). The same was observed for the clade of the Alpine individuals of X. lorezi and a clade of the Altai, NA, and 2 FEN individuals in C. sororiata. For the rest of the splits in C. sororiata, intermediate gdi values were obtained. Furthermore, for the remaining splits in X. lorezi and in M. brunneata as well as A. caja, gdi values were observed to be in the gray zone (0.2 < gdi < 0.7) and in the conspecifics category (gdi < 0.2). In C. tullia, the gdi value for the clade of NA individuals was observed to be close to the end of the gray zone (gdi = 0.66).
Discussion
The gradual differentiation of allopatric populations inevitably implies that there is an extensive period of the “gray zone” during which it is not possible to delimit the populations taxonomically in an unambiguous way (De Queiroz 2007). Allopatry poses a particular challenge for species delimitation as it is difficult to assess whether the observed difference between 2 populations is the result of an absence of opportunities to interbreed due to suppressed gene flow, an adaptation to different ecological and environmental conditions, or both (Coyne and Orr 2004, Nosil 2008). Many if not most species have fragmented distribution patterns (Mutanen et al. 2012), and the ranges of a considerable number of species extend across continents. Thus, the problem of species delimitation under allopatry is widespread but addressed mostly in connection with smaller geographic scales (Lukhtanov et al. 2015, Wagner et al. 2017, Georges et al. 2018, Dincă et al. 2019). For example, the number of Holarctic terrestrial insect species is counted in thousands (Langor and Sheffield 2019), as in Lepidoptera alone, there are several hundred (Pohl et al. 2018, own data). The taxonomy of many Holarctic species has been unstable because the degree of differentiation observed between the allopatric populations is highly variable, rendering their delimitation often challenging (Kerr et al. 2009, Landry et al. 2013).
Mitonuclear Discordance
In our study, we used a recently developed target enrichment kit containing a fixed set of protein-coding loci to understand the patterns of intraspecific variation in allopatric populations of 10 Arctic-alpine and boreo-montane Lepidoptera species of the Palearctic and Holarctic regions. We compared these nuclear gene patterns with patterns known from the mtDNA barcodes. In about 5 out of 10 cases, we observed that the barcode phylogenies reflected similar phylogenetic patterns to those based on nuclear loci (viz., S. hochenwarthi, X. speciosa, C. tullia, M. brunneata, X. lorezi), while in the remainder we observed mitonuclear discordance. In cases of P-distance comparisons, barcode P-distances tended to vary greatly between comparisons, while the variation in target enrichment P-distances between different comparisons remained lower (Fig. 1). This higher variation in barcode distances, or mitonuclear discordance in general, can be caused by (a) the faster evolution of mitochondrial genomes due to a higher mutation rate and selection involving the entire mitogenome as a single linkage group (Ballard and Whitlock 2004, Moritz and Cicero 2004), (b) a lower effective population size, (c) differential fixation of mtDNA haplotypes in different geographic areas (Després 2019), and/or (d) local fixation of associated mtDNA haplotypes due to Wolbachia-mediated selective sweeps (explained in detail in a section below). ILS, gene flow or introgression, and horizontal gene transfer are known to be the other biological causes of mitonuclear discordance (Toews and Brelsford 2012, Soucy et al. 2015, Ivanov et al. 2018). Thus, the mitonuclear discordance in A. caja and C. sororiata can be thought to have been caused by historical introgression between the populations, while in E. vittaria, E. sudetica, and A. glandon it could be explained on the basis of ILS and/or introgression (as introgression was not assessed in E. vittaria and A. glandon). In summary, while mitochondrial markers are useful, for example, in species identification, sampling design and can reveal true genetic gaps, taxonomic delimitation of allopatric populations should not solely be based on them as they may often not reflect the true species genealogy correctly.
Discordance between Concatenation and Coalescent Approaches
Based on our analyses of nuclear markers, we found the ASTRAL approach provided consistently well-resolved topologies, which, to some extent, tended to conflict with the concatenation-based ML approach. The gCF values for all the studied species remained largely on the lower side (between 0 and 25), indicating a high amount of discordance between concatenation and coalescent approaches. This was also evident from the normalized quartet scores for ASTRAL trees, especially for A. glandon, X. speciosa, and M. brunneata (Fig. 3). The causes of this discordance between the 2 approaches could be either operational or biological. Operational causes include the presence of high GC content and locus informativeness (Espeland et al. 2018). The former can be ruled out as we had removed loci with high GC content (more than 60%) from our dataset. As for the latter, we cannot rule out the possibility of stochastic errors stemming from the limited amount of information available or due to the short lengths of the loci, as the observed gCF values in almost all the cases were lower than the sCF values (Minh et al. 2020a). However, we did find that the phylogenetic signal in our genomic dataset was sufficient to recover genetically distinct lineages that belong to the same species because in E. sudetica, X. lorezi, and A. caja the target enrichment ML tree showed patterns similar to ASTRAL. One of the major biological causes of discordance between concatenation and coalescent approaches include ILS, along with other factors such as deep coalescence, gene duplication, and loss as well as gene flow, although it remains to be studied how much gene flow is necessary to cause the discordance (Kubatko and Degnan 2007, Edwards et al. 2016, Solís-Lemus et al. 2016, Jiang et al. 2020). As ASTRAL is statistically consistent under MSC framework and takes into account ILS while inferring phylogenies, it is likely to perform better in cases where ILS is significant, given that there is no significant error in gene tree estimation (Mirarab et al. 2016).
Within-Continental Patterns of Diversity
For species with disjunct Palearctic and Arctic-alpine distributions, it is evident from our results that these species regularly show genetic separation of one or more populations. In X. speciosa, the genetic distinctiveness of the Alpine population is supported by the nuclear markers in most of our analyses. Species delimitation using tr2 and SODA likewise suggested that the Alps population represents a separate species and lumped FEN and Altai populations together as one species. In S. hochenwarthi, the genetic distinctiveness of the FEN population is strongly supported by the analyses using nuclear genes. However, species delimitation analyses (SODA and gdi) did not suggest it is a separate species; thus, species-level differences were found to be absent in this population. We did not find any evidence of gene flow between the populations of these 2 species (but did notice signs to indicate that ILS was present). It seems likely that the gene flow has virtually ceased since the last glacial period and that the gradual divergence of the populations from the 2 regions is ongoing but has not yet reached completion, hence providing an excellent example of the “gray zone” and the arbitrary nature of delineation of such populations into species.
Quite likely the populations of Fennoscandia and the European mountains such as the Alps, Pyrenees, and Apennines are descendants of large populations that have inhabited the periglacial tundra belt during the last glaciations (Schmitt et al. 2010). Separations in Arctic-alpine species of Northern populations and high mountain systems in central and Southern Europe (often the Alps) are mostly recent (i.e., postglacial) phenomena and the result of species retreating northwards and into southern mountain systems during postglacial periods (Schmitt et al. 2010). We observed this Arctic-alpine separation based on analyses of nuclear markers in 3 out of 9 analyzed species, namely E. vittaria, E. sudetica, and X. lorezi (A. glandon was not analyzed for FEN population), that were supported by our species delimitation analyses. In E. vittaria, barcode P-distances supported a deep divergence between Alps and Fennoscandia (median value of P-distances more than 5%), with previous studies having revealed an even higher divergence (6.47%, Mutanen et al. 2012). These deep intraspecific barcode divergences can arise as a result of Wolbachia-mediated mitochondrial introgression and subsequent selective sweeps of the mitochondrial genome (Hilgenboecker et al. 2008), although we do not know the potential “donator” species and which of the 2 populations has undergone such a selective sweep. However, the separation of the populations is also reflected in the nuclear markers and the species delimitation analyses, which indicated a species-level distinction between both populations. Thus, we suggest further assessment of the taxonomic status.
In E. sudetica, in addition to the Arctic-alpine separation, individuals from the Pyrenees displayed a striking divergence in analyses of both mitochondrial and nuclear markers and are suggested to represent a separate species from all species delimitation analyses. Therefore, this population likely belongs to an unrecognized cryptic species. For X. lorezi, significant separation of Arctic-alpine populations was supported by all our analyses, with species delimitation further supporting a species-level distinction of the Alps population. Although we could analyze only one specimen from the Nearctic population, our results point to it being related to the FEN population.
Patterns of Diversity Across Continents
We studied the genetic patterns of 5 Holarctic species using target enrichment data and compared these patterns to those observed in their DNA barcodes. Holarctic distributions result from either past land connections across Beringia or from dispersal (Mikkola et al. 1991). Species presently occurring on both continents may, therefore, have different biogeographical histories. Furthermore, the allopatric populations of these species on both continents tend to show strong intracontinental substructuring. For the sake of simplicity, we assumed uniformity of the North American population, which may not in all cases be a reflection of the true scenario (D’Ercole et al. 2021, Campbell et al. 2022). Confirmation for this comes from our results, especially the barcodes, which in Holarctic species showed larger variations in within-population divergences.
In A. glandon, while barcodes did not reveal any genetic differentiation between the Palearctic and Nearctic populations, the populations were suggested to be separate genetic entities based on nuclear markers. This mitonuclear discordance, as well as the lack of phylogenetic resolution in the phylogenomic ML tree, points to ILS (as discussed above). Species delimitation analyses using tr2 and gdi inferred the 2 populations as separate species, while the SODA analysis suggested the presence of only a single species. Note that Agriades aquilo (Boisduval, 1832), the northern form of more widespread Alpine A. glandon (A. glandon glandon), is currently recognized as a subspecies of A. glandon and was not analyzed in the present study.
In A. caja, the Nearctic population could be shown to be differentiated from the Palearctic counterpart in the genomic data, and species delimitation analyses using tr2 and SODA suggested the Nearctic population of A. caja was a separate species, with a gray zone gdi value of 0.63 for that clade. The taxonomy of A. caja has been revised based on morphological characters by Dubatolov and Philip (2013), by which different northern populations of A. caja were attributed to the closely related Arctia brachyptera (Troubridge, 1999), A. opulenta and Arctia olschwangi (Dubatolov, 1990). However, to the best of our knowledge, this interpretation has not yet been backed by molecular data. Significant evidence of introgression observed between the Altai and the Nearctic populations suggests the historical contact between the Nearctic and Eurasian region through the Beringian land bridge, present until c. 15,000 years ago (Mikkola et al. 1991, Brubaker et al. 2005).
In C. tullia, the genetic separation that we observe in NA individuals suggests a separate species status, and recent works have already formalized these changes (Kodandaramaiah et al. 2018, Zhang et al. 2020). Based on the latest taxonomic assessments, most of the individuals of C. tullia from NA are now attributable to Coenonympha california (Westwood, 1851) (Kodandaramaiah et al. 2018, Zhang et al. 2020). The individual from Nunavut, which is shown to be part of the Eurasian clade, is the only North American sample attributable to C. tullia (as C. tullia yukonensis) (Zhang et al. 2020). An assessment of the status of this actual North American C. tullia (C. tullia yukonensis) would require further sampling.
Carsia sororiata and M. brunneata are examples of Holarctic species with a boreal distribution whose larvae feed on the Holarctic Vaccinium spp. In M. brunneata, the presence of the Eurasian gene pool in 2 individuals from Yukon suggested historical contacts between this and the Eurasian region, as Alaska and Yukon were effectively part of the Palearctic region connected to northeastern Siberia through the Beringian land bridge. Species delimitation analyses did not agree with each other regarding the separate species status of any of the M. brunneata populations. In C. sororiata, the apparent lack of differentiation of any population suggests that it had a widespread distribution even during glaciation and thus access to significant gene flow, as the evidence of historical introgression was observed especially between northern populations. Therefore, unsurprisingly, species-level differences are absent from geographically separated populations. Notably, the Alps population showed some degree of divergence (from FST values and from STRUCTURE).
Implications for Species Delimitation of Allopatric Populations
A previous study has suggested a net synonymous divergence threshold between 0.5% and 2% in nuclear genomic data as typical for taxa belonging to a gray zone, i.e., falling in the interface between intra- and interspecific variation (Roux et al. 2016). Another study found that a 0%–1.1% divergence in genome-wide RADseq data represented within-species polymorphism/intraspecific variability (Cariou et al. 2020). In our case, C. tullia is the only Holarctic species that showed a P-distance divergence higher than 1% between the continents in target enrichment data, suggesting genetic differentiation at the species level in the Nearctic population (recognized recently as a distinct species, i.e., C. california). For the rest of the Holarctic taxa, we found that target enrichment P-distances, even for between-continent comparisons, remained below 1%. Thus, solely based on P-distances alone, this would point to intraspecific variation in the populations of these species. However, there is still no well-established threshold for distinguishing intraspecific variation from interspecific variation based on genetic distances in the nuclear genome. An alternative to using pairwise genetic distance as an operational criterion for species delimitation is using the measure of population differentiation, i.e., using FST estimates. Hey and Pinho (2012) identified a threshold value of FST = 0.35 as a value above which the entities were identified as species and below which simply as populations. Thus, based on FST alone, the Nearctic population of A. caja deserves distinct species status, as do the Alps and FEN populations in X. lorezi and E. sudetica. This is partly also supported by our species delimitation analyses, specifically by tr2 and SODA. However, the FST values should be treated with caution, especially in cases of allopatry, as it implies the current lack of gene flow, even though the remnants of a historical gene flow might still be present, and it is difficult to distinguish between these 2 scenarios (Dincă et al. 2019).
Species delimitation methods that incorporate an MSC framework can help overcome the limitations of genetic distances and tree topology-based approaches, as under this model, different genomic regions are allowed to have different genealogical histories, and thus gene tree heterogeneity is incorporated (Leaché et al. 2019). Among the 3 MSC-based species delimitation methods that we tested, we observed that tr2 and SODA have the most tendency to over-split the populations into species. While both tr2 and SODA are faster and scalable to larger datasets, both methods are sensitive to population structure and do not consider gene flow between species (Fujisawa et al. 2016, Rabiee and Mirarab 2020). The difficulty of distinguishing population structure from speciation has been argued to be a problem of multispecies coalescent methods, particularly in young lineages (Sukumaran and Knowles 2017, Barley et al. 2018, Chambers and Hillis 2020). Our gdi values were calculated using BPP, and although BPP ignores the gene flow, it is known to provide more accurate parameter estimates and inference of species status (Leaché et al. 2019). However, we acknowledge that our estimates might have been influenced by the choice of priors used to calculate divergence times. Also, the gdi has a large range of ambiguity (0.2–07), which we argue reflects the arbitrary nature of species boundaries, especially in allopatric populations. This has also been reported from one of the previous studies that showed gdi values for allopatric species divergences as falling into ambiguous zones (Huang 2021). As the population versus species distinction forms a continuum (Stankowski and Ravinet 2021), particularly in the case of allopatric populations, the distinction between population and species structure is bound to be arbitrary regardless of the method.
Given this inherent arbitrariness, will it be possible to create universal standards for the delimitation of allopatric populations? Would this be a desirable goal at all? Our response to these questions is “Yes,” although we acknowledge that it will likely be very difficult to agree on those standards among taxonomists. As the delimitation of allopatric populations is bound to be based on arbitrary criteria, applying the same principles throughout taxa, or at least very broadly, would be an optimal solution. Our study demonstrates that mitochondrial markers may provide only an indication of the genetic distinctiveness of populations and that mitonuclear discordance is a widespread phenomenon. The same is likely true for any single genetic marker as the genealogy of any single gene may deviate from that of a species (Pamilo and Nei 1988, Maddison 1997). The target enrichment approach with hundreds of protein-coding loci, however, provides a robust hypothesis of the species tree, as in practice, that is a consensus of all gene trees (Maddison 1997). We find that it is less relevant whether this standard would be based on simple genetic distance, FST or more sophisticated delimitation analysis, but given the inherently arbitrary nature of this action, we cannot see what genuine benefits a more complicated approach would provide compared to a simpler one. An approach, such as using a simple divergence threshold for species delimitation purposes has not received as much appreciation among taxonomists as an approach based on phenetics logic (Collins and Cruickshank 2013). We find that the main problem with the former approach has been its application of a single marker rather than genomic-wide data and well-resolved species trees. An alternative ontological solution would be to apply a phylogenetic (cladistic) species concept (Nixon and Wheeler 1990), i.e., diagnosability, as a central criterion in species delimitation. Yet, in the case of allopatric populations that have undergone genetic bottlenecks, at least some diagnostic sites are likely to be commonly present. Hence, strict application of the phylogenetic species concept for allopatric species delimitation would almost inevitably lead to taxonomic inflation (Isaac et al. 2004, Zachos et al. 2013).
Finally, we would also like to emphasize the importance of our study in the context of climate change and biodiversity loss. Ample recent scientific evidence points to the alarming rate of global insect decline (Cardoso et al. 2020). Holarctic taxa, especially Arctic and boreal taxa, are known to be most vulnerable to anthropogenic climate change (Antão et al. 2022) as the Arctic region is undergoing rapid and unprecedented transformation due to its higher rate of warming than the global mean (Rantanen et al. 2022). Thus, determining the accurate species status of allopatric populations of these Northern species is especially important for their conservation efforts.
Conclusions
Our study is among the first to focus on species delimitation on a very broad geographic scale and based on genome-wide data. After witnessing a large number of taxa with various and often fully unexplained patterns of divergences observed in DNA barcode data sets across almost all animal groups (e.g., Roe and Sperling 2007, Shearer and Coffroth 2008, Ward 2009, Mutanen et al. 2012, Huemer et al. 2018), we first sought to gain a genomic insight into these phenomena. We find that such in-depth insight into these patterns is best obtained by genomic approaches. We further demonstrate that patterns observed in mitochondrial DNA may have a variety of biological explanations and may not always reflect the genealogy of the species, suggesting that multiple genetic markers are required to draw an accurate picture of genetic relationships between populations. Modern high-throughput DNA sequencing tools, like those employed here, have significant potential to provide a solid foundation for species delimitation of allopatric populations and might critically reduce the subjectivity and nonscalability of the delimitation process. This would be best obtained by reaching a consensus over the standard, benchmarked set of nuclear loci that the delimitation of allopatric populations should be based on in the first place and then collectively agreeing on the universal standards for the delimitation procedure itself. Finally, we acknowledge that the underlying assumption of the uniformity of the North American populations as single entities is often false, and thus, we may not have a complete and accurate taxonomic picture of the studied taxa. Consequently, we refrain from taking any formal taxonomic actions here.
Disclaimer: Nagoya Protocol: The authors attest that all legal and regulatory requirements, including export and import collection permits, have been followed for the collection of specimens from source populations at any international, national, regional, or other geographic level for all relevant field specimens collected as part of this study.
Acknowledgments
We would like to thank Laura Törmälä for her valuable help with the target enrichment laboratory work and Hannele Parkkinen for help with the barcoding. Christian Schmidt brought significant taxonomic issues to our attention in the previous drafts. The sequencing service was provided by the Biomedicum Functional Genomics Unit at the Helsinki Institute of Life Science and Biocenter Finland at the University of Helsinki. We acknowledge CSC Finland for providing computational resources to carry out bioinformatics analyses and CSC staff for their help with bioinformatics troubleshooting. We are grateful to Prof. Victor Benno Meyer‑Rochow for carefully checking the English language of our work. Finally, we thank the 2 anonymous reviewers whose constructive comments greatly helped improve the quality of the manuscript.
Author contributions
Mukta Joshi (Data curation [equal], Formal analysis [lead], Investigation [lead], Methodology [supporting], Validation [lead], Visualization [lead], Writing—original draft [lead], Writing—review & editing [equal]), Marianne Espeland (Conceptualization [equal], Methodology [lead], Resources [equal], Supervision [equal], Writing—review & editing [equal]), Peter Huemer (Conceptualization [equal], Data curation [equal], Resources [equal], Writing—review & editing [equal]), Jeremy DeWaard (Conceptualization [equal], Data curation [equal], Resources [equal], Writing—review & editing [equal]), and Marko Mutanen (Conceptualization [equal], Funding acquisition [lead], Project administration [lead], Resources [equal], Supervision [equal], Writing—review & editing [equal])
Funding
This project was funded by the Academy of Finland (grant no. 314702 to M.M.). J.R.d.W. was supported through the University of Guelph’s “Food From Thought” project, funded by the Canada First Research Excellence Fund. M.J. received funding support from the Finnish Cultural Foundation, University of Oulu Scholarship Foundation, and Oulun LuonnonystäväinYhdistys ry.
Data availability
All raw cleaned sequence data are archived on the NCBI Sequence Read Archive under BioProject ID PRJNA922447. Alignments and other data are available on Dyad via link https://datadryad.org/stash/share/PPtY7vmqqL4-IHte0Arx43Ct_rvoZ687zhnbtG0VzM4 (doi: 10.5061/dryad.ht76hdrm0).
