


Abstract
Crescent butterflies of the Phyciodes tharos group have a long-standing reputation for taxonomic difficulty. We assessed species boundaries in the P. tharos group using genome-wide single-nucleotide polymorphism (SNP) data, focusing on sampling in western Canada, where 4 species (P. tharos, P. cocyta, P. batesii, and P. pulchella) have classically been recognized. Phylogenetic and cluster-based analyses confirm that there are indeed 4 species based on the maintenance of genomic integrity in the presence of occasional hybridization and low levels of gene flow. Mitochondrial cytochrome c oxidase I (COI) does not consistently distinguish species, with haplotypes extensively shared between species. Limited sampling of P. batesii indicates complex boundaries and interactions with other Phyciodes, especially with P. pulchella and P. cocyta. This study demonstrates the power of a genome-wide perspective to elucidate the integrity of boundaries between recently diverged species that remain capable of occasional hybridization.
Introduction
DNA sequencing is commonly used to unveil patterns of genetic divergence that characterize species boundaries (Dupuis et al. 2017a,b, Tahami et al. 2021, Campbell et al. 2022, Joshi et al. 2022, Smith et al. 2022). Reduced representation methods such as double-digest restriction site-associated DNA sequencing (ddRADseq, Peterson et al. 2012) have made it feasible to quickly and cost-effectively sample hundreds to thousands of single-nucleotide polymorphisms (SNPs) across the genome, even for species that lack a reference genome (Metzker 2010, Hohenlohe et al. 2013, Andrews et al. 2016, Roe et al. 2017). This presents opportunities to reassess species delimitations and phylogenetic relationships for groups that have relatively uninformative morphology (e.g., Dupuis et al. 2017a, Lavretsky et al. 2019, Tahami et al. 2021, Campbell et al. 2022).
The Phyciodes tharos group comprises at least 4 Nearctic butterfly species: P. tharos (Drury, 1773), P. cocyta (Cramer, 1777), P. batesii (Reakirt, 1865), and P. pulchella (Boisduval, 1852) (Scott 1994, Wahlberg et al. 2003a). These species occur in open areas and forest clearings in association with Aster L. (Asteraceae), their primary larval hostplants. In areas of sympatry, some individuals, particularly females, cannot be consistently identified using morphology alone (Layberry et al. 1998, Douglas and Douglas 2005, Scott 2006, Hall et al. 2014, Schweitzer et al. 2018). Together, their ranges cover most of North America (Fig. 1) (Brock and Kaufman 2006, Glassberg 2017), and these 4 Phyciodes species co-occur in Alberta, Canada, in the absence of any other congeneric species (Fig. 1; Acorn 1993, Bird et al. 1995). Within Alberta, P. tharos orantain Scott, 1998 occurs in the southeastern prairie region, P. cocyta selenis (Kirby, 1837) and P. batesii saskatchewan Scott, 2006 are sympatric across most of the province, and P. pulchella owimba Scott, 1998 is found in the Rocky Mountains and foothills.
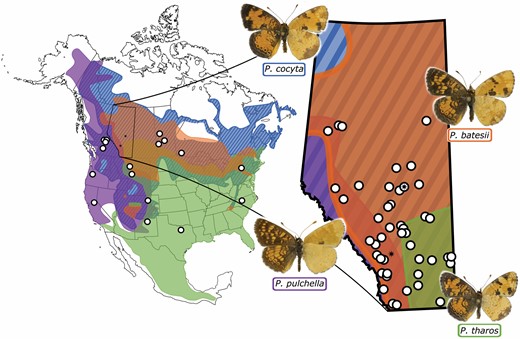
Range map for the Phyciodes tharos group of butterflies. Distributions shown are based on Layberry et al. (1998), Wahlberg et al. (2003a), Brock and Kaufman (2006), iNaturalist (2020) (research grade data only), and Lotts and Naberhaus (2020). White dots show sampling locations (details in Supplementary Table S1). Map on right shows expansion of Alberta, the region with the most intensive sampling, with black stars for locations of major cities: Edmonton and Calgary. Butterfly images are courtesy of Norbert Kondla.
Although all 4 species of the Phyciodes tharos group are considered globally secure from a conservation standpoint, P. batesii has declined in some areas since the 1960s and is now uncommon in eastern Canada and extirpated in most of its eastern range in the United States (Glassberg 1993, 2017, Cech and Tudor 2005, Brock and Kaufman 2006, Hall et al. 2014, NatureServe 2022). It is also considered threatened in the Peace River and Liard River areas of British Columbia (Guppy et al. 1994, Acorn and Sheldon 2006). Additionally, P. tharos and P. cocyta adults can easily be confused with P. batesii, and many records of P. batesii are questionable due to the likelihood of misidentification of the more common species (Douglas and Douglas 2005, Brock and Kaufman 2006, Scott 2006, Glassberg 2017, Schweitzer et al. 2018).
Molecular systematic studies of the P. tharos group have generally used only one or a few genes and failed to clarify species boundaries. COI-based analyses indicate incomplete lineage sorting, contemporary genetic exchange, or both, among all possible species pairs of the P. tharos group except P. tharos and P. pulchella, and further indicate that P. cocyta haplotypes may occur in P. tharos or P. batesii depending on proximity (Wahlberg et al. 2003a, Proshek and Houghton 2012). Most higher-level phylogenetic studies used, at best, 2 nuclear genes in combination with COI and one or few individuals per species (Wahlberg and Zimmermann 2000, Wahlberg et al. 2003b, 2005, Wahlberg 2006, Wahlberg and Freitas 2007, Long et al. 2014). Recently, Zhang et al. (2022) reported Z-chromosome and discordant mitogenome data with continent-wide geographic sampling in the P. tharos group. However, they included only one specimen from Alberta and adjacent regions and did not show results for autosomal DNA data. This work elevated P. tharos orantain to P. orantain Scott, 1998, and P. cocyta diminutor to P. diminutor Scott, 1998. Nonetheless, Zhang et al. (2022) concluded that “the evolutionary history of the tharos” group is riddled with irregularities such as hybridization and introgression. Consequently, there is a clear need for genome-wide studies in areas of contact between the taxa of the P. tharos group. Until the continent-wide relationships of these species are more fully resolved, and to promote clear communication of our findings, we provisionally retain the 4 species names that have been in prior common usage.
Our aim here is to reassess species boundaries of the P. tharos group in western Canada using genome-wide SNP markers and to examine population structure and evidence for introgression, particularly of mitochondrial DNA. Since gene flow can occur between recently diverged species (Tahami et al. 2021), we consider our results in light of the genomic integrity species concept (Sperling 2003), which, in this context, assesses whether related lineages retain sufficient genomic distinctiveness in regions of contact (i.e., limited gene flow) to be diagnosable as independently evolving lineages. We focused our sampling on Alberta, where all 4 P. tharos group species occur without range overlap by any other Phyciodes.
Materials and Methods
Specimen Collection and DNA Extraction
Most Phyciodes specimens were collected by aerial net in 2016 and 2017 across Alberta, and additional specimens were collected during 1989–2018 in 3 other Canadian provinces and 8 US states (Supplementary Table S1). Specimens were initially identified to species visually, using wing patterns and local field guides (Acorn 1993, Bird et al. 1995), and the identities of ambiguous individuals were subsequently investigated by SNP analyses. In total, 152 ingroup specimens (46 P. tharos, 74 P. cocyta, 8 P. batesii, and 24 P. pulchella) and 4 outgroup P. mylitta specimens were used in this study.
Specimens were kept alive in glassine envelopes or preserved in 95% ethanol for transport and then transferred to a −20 °C freezer for long-term storage. Legs and entire thoraces were used for DNA extraction with a DNeasy Blood and Tissue Kit (Qiagen), following the manufacturer’s protocols with an optional RNase A treatment (Sigma-Aldrich Canada Co.). Isolates were purified by ethanol precipitation and suspended in 50–100 µl Millipore water. DNA samples were assessed for quality and quantity using a Nanodrop ND-1000 Spectrophotometer (Thermo Scientific) and a Qubit Fluorometer (1.0 dsDNA BR assay kit, Invitrogen).
Voucher wings were stored in glassine envelopes and deposited in the E. H. Strickland Entomological Museum (UASM) with unique DNA extraction and UASM museum collection numbers (Supplementary Table S1).
High-throughput Sequencing, Alignment, and Filtering
Library preparation of samples followed the double-digest restriction site-associated DNA sequencing approach (ddRADseq) of Peterson et al. (2012), using 200 ng of input DNA and the PstI and MspI restriction enzymes, and was done by the University of Alberta Molecular Biology Service Unit (MBSU). Samples were indexed using 8 base pair (bp) individual-specific indexes, and single-end sequencing was performed on an Illumina NextSeq 500 to produce 75 bp reads.
Sequence reads were demultiplexed using the process_radtags program in the Stacks v2.0b pipeline (Catchen et al. 2011, 2013). To avoid occasional sequencing error that was observed in the PstI site, cutadapt v1.18 (Martin 2011) was used to trim an additional 5 bp from the 5ʹ end of each sequence read. In addition, because Stacks requires uniform sequence reads for de novo locus construction, we removed any reads containing remnant Illumina sequencing adapters. The final cleaned sequence reads were all 62 bp long. Sequence reads were assembled into putative de novo loci using the Stacks v2.0b pipeline. We required a minimum of 3 raw reads to form putative alleles within individuals, and 2 mismatches were allowed between reads within individuals to form loci. We allowed 3 mismatches between putatively homologous loci between individuals to account for variation that may exist between species.
Individuals were assigned to 1 of 5 species (P. tharos, P. cocyta, P. batesii, P. pulchella, and P. mylitta) based on preliminary morphological identifications. Both the populations program (part of the Stacks v2.0b pipeline) and VCFtools v0.1.14 (Danecek et al. 2011) were used to filter loci. In Stacks, loci were required to be present in at least 80% of individuals by putative species to be processed, and only a single SNP was output from each locus to reduce linkage disequilibrium in the dataset. Using VCFtools, we further filtered genotypes to have quality scores of 30 or greater, a minimum minor allele frequency of 5%, and removed loci that were missing in more than 20% of individuals for cluster-based analyses, which are sensitive to higher levels of missing data (Puechmaille 2016), or 50% of individuals for phylogenetic analyses, which are more tolerant of missing data (Wiens 2006, Huang and Knowles 2016). Read depth and missingness were obtained using VCFtools. To test for admixture, f3 statistics were calculated for 1,477 SNPs from 152 individuals with the program Treemix 1.12 (Reich et al. 2009, Pickrell and Pritchard 2012). Raw fastq files containing genomic SNP data were deposited to NCBI SRA as BioProject PRJNA1032909.
COI Sequencing and Alignment
The 658 bp barcoding region of COI was amplified by polymerase chain reaction (PCR) using the primers LepF (5ʹ-ATTCAACCAATCATAAAGATATTGG-3ʹ) and LepR (5ʹ-TAAACTTCTGGATGTCCAAAAAATCA-3ʹ). PCR began with a 2-min denaturation period at 94 °C followed by 35 cycles of 94 °C for 30 s, 45 °C for 30 s, and 72 °C for 2 min and then a final elongation at 72 °C for 5 min. Excess primers and nucleotides were removed from the product using exonuclease I and shrimp alkaline phosphatase (New England Biolabs). Sequencing was performed in both directions on a 3730 DNA Analyzer (Applied Biosystems) at the MBSU.
Forward and reverse sequences were merged in Geneious 10.2.6 (www.geneious.com), and base calls were manually checked. Consensus sequences were then aligned using MAFFT online (Kuraku et al. 2013, Katoh et al. 2017) under default parameters. The multiple sequence alignment was also manually checked. COI sequences were included for 153 study specimens. Three P. mylitta individuals were not included because they did not amplify properly. Fifty-six additional sequences were downloaded from GenBank (Clark et al. 2016, Supplementary Table S2) and aligned with the study sequences. All sequences were trimmed to 633 bp to match the length of the barcoding region that was consistently present in all sequences. The number of informative sites, constant sites, and singletons was obtained from IQ-TREE version 2.0.7 (Nguyen et al. 2015, Minh et al. 2020). COI sequences were deposited to GenBank as accessions OR896666 – OR896818.
Phylogenetic Analyses
Maximum likelihood phylogenetic analyses of 2443 SNPs (152 ingroup and 4 outgroup specimens) and 633 bp of COI (196 ingroup and 13 outgroup specimens) were performed in IQ-TREE version 2.0.7 (Nguyen et al. 2015, Minh et al. 2020) on Compute Canada. The perturbation strength for the tree search was 0.5 for both analyses. Ultrafast bootstrapping (UFBoot, Hoang et al. 2018) was performed for the SNP (2000 iterations) and COI (1,000 iterations) analyses. Nucleotide substitution models were selected based on the Bayesian Information Criterion in IQ-TREE’s built-in ModelFinder (Kalyaanamoorthy et al. 2017). The GTR+F+R5 model was used for SNP analysis, and the TN+R2 model was used for COI analysis. Ascertainment bias correction was not performed on the SNP dataset because there were partially constant sites due to lineage-specific polymorphisms in restriction sites (Minh et al. 2022). For the SNP analysis, nodes were collapsed if they had lower than 50% UFBoot support to produce a 50% majority rule consensus tree. The SNP tree was rooted to P. mylitta, and the COI tree was rooted to several outgroup species (P. mylitta, P. pallida, P. orseis, P. pallescens, P. picta, and P. phaon) in FigTree v1.4.3 (Rambaut 2010). Data matrices and tree files are available on Dryad (Wingert et al. 2023).
Cluster-based Analyses of SNPs
Principal component analysis (PCA) was performed on 1,477 SNPs for 152 ingroup individuals using the FactoMineR package (Lê et al. 2008, Husson et al. 2023) in R 4.0.1 (R Core Team 2020). This package replaces missing data points with the means of their respective columns. For visualization of plots, ggplot2 (Wickham 2016) and ggforce (Pedersen 2022) packages were used. Results were analyzed for 5 axes, and individuals were colored based on their species identification in the main STRUCTURE analysis.
Bayesian clustering analysis was performed on 1,477 SNPs for 152 ingroup individuals using the program STRUCTURE 2.3.4 (Pritchard et al. 2000). Ten independent replicates were run for K-values 2 through 6, with 500,000 burn-in iterations and 5 million MCMC iterations each, using the admixture model and the nolocprior option. Results for K = 4 were plotted as pie chart graphics on a map using the program QGIS (2020) (Supplementary Fig. S1). Hierarchical analyses of clusters recovered in STRUCTURE were performed to detect sub-structure within species. For each hierarchical analysis, 2 million MCMC iterations were run with 200,000 burn-in iterations for K-values 2 through 4. In these hierarchical analyses, the P. batesii and P. pulchella clusters were analyzed together because there were only 6 individuals of the former species, and the P. batesii individuals appeared to be admixed with P. pulchella (see Results). Individuals that may be F1 hybrids (approximately 50% admixture) were included in sub-structure analyses for both of their putative parental species. STRUCTURE HARVESTER v0.6.94 (Earl and vonHoldt 2012) was used to collate results and obtain summary statistics. Collated results were submitted to the beta CLUMPAK web server (Kopelman et al. 2015), which summarized results using a Markov clustering algorithm. The optimal value of K was selected based on the likelihood of the data (Ln Pr(X|K)) (Pritchard et al. 2010) and comparison to the phylogenetic tree to assess biological plausibility. The Evanno method was also applied (Evanno et al. 2005), though this method often only detects the highest level of structure in a dataset (Janes et al. 2017). The data matrix for cluster-based analyses is available on Dryad (Wingert et al. 2023).
Results
Sequencing Statistics
The unfiltered SNP dataset yielded 12,172 loci. The average filtered read depth was 30.7 for individuals, with a range of 11–73, and 30.4 for sites with a range of 7–314. Mean read depth and missingness data by the individual are provided in Supplementary Table S3. After filtering, locus coverage for the phylogenetic dataset (i.e., the proportion of filtered loci present in each individual) for ingroup specimens averaged 83%, while outgroup specimens (used in phylogenetic analyses only) averaged 49% (Supplementary Table S3). Filtering for phylogenetic and cluster-based analyses retained 2,443 and 1,477 SNPs, respectively.
COI sequences had little missing data in both the original and trimmed data sets (<0.04%). Over half of the missing data were from 2 outgroup individuals from Wahlberg et al. (2003a). The trimmed data used for analysis (633 bp) had 87 informative, 34 singleton, and 512 constant sites. There were 79 unique haplotypes of 633 bp across 209 individuals. Identical haplotypes were shared widely, whether at distant localities or in individuals from the same locality that belonged to different lineages in the SNP analyses.
Phylogenetic Analyses
The maximum likelihood SNP tree produced 3 primary clades that correspond to P. pulchella, P. cocyta, and P. tharos (Fig. 2A). The P. pulchella clade branched off first, and P. cocyta and P. tharos were sister to one another. Eight specimens, putatively representing P. batesii, formed an intermediate stepwise “grade” of individuals paraphyletic with respect to the clade containing P. tharos + P. cocyta. Other than a few specimens from the United States in the P. pulchella and P. tharos clades, there is little evidence of geographic structuring in the SNP phylogeny; individuals from distant localities were found together in the tree, sometimes with high support.
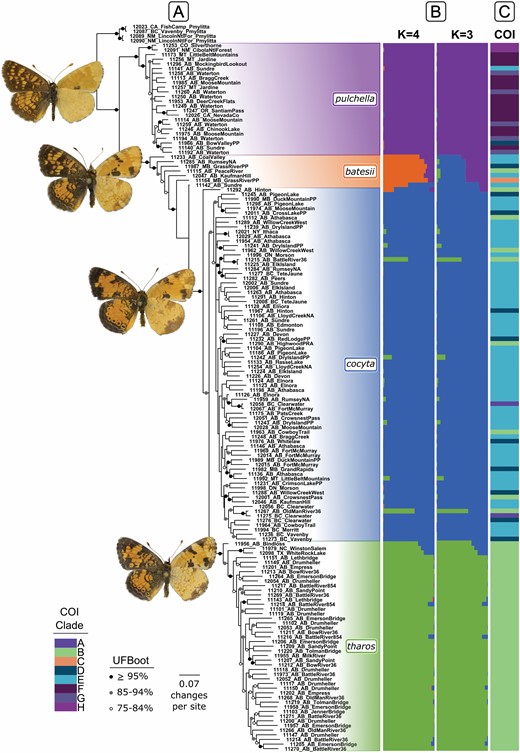
(A) Maximum likelihood consensus tree of 2443 SNPs for 156 individuals. Branches with < 50% UFBoot support are collapsed and support of > 75% is indicated on branches. (B) STRUCTURE analyses of 1,477 SNPs with individuals aligned to SNP tree. (C) Membership in haplotype groups (Wahlberg et al. 2003a) from ML analysis of 633 bp of COI (Supplementary Fig. S2), with individuals aligned to SNP tree. Butterflies images are courtesy of Norbert Kondla.
The maximum likelihood COI tree was less resolved than the SNP phylogeny and several individuals exhibited mitonuclear discordance (Fig. 2A, C, Supplementary Fig. S2). There was strong support (≥95% UFBoot) for most of the main clades but less for relationships among them, and the P. batesii individuals did not form a distinct grouping. Overall, the phylogeny was consistent with Wahlberg et al. (2003a), and lettered clades from that study are marked on the nearest corresponding nodes or branches in Supplementary Fig. S2 (as in Proshek and Houghton [2012]). Three individuals (A) branched off before all other P. tharos group individuals, including 2 P. cocyta individuals from British Columbia that had the same COI haplotype, and one P. pulchella from California from Wahlberg et al. (2003a). Clade B included all P. tharos individuals, as well as 10 P. cocyta (8 from this study), and 3 P. batesii (1 from this study). Three clades corresponding to Wahlberg’s C, D, and E contained most P. cocyta and P. batesii individuals, and 3 P. pulchella (2 from this study). Clade E was part of an unresolved group of 4 clades, of which 3 were entirely P. pulchella (F, G, H). Thus, none of the 4 Phyciodes species was consistently diagnosable with COI sequences.
Cluster-based Analyses of SNPs
Principal component analysis of SNP data for all species produced clear primary clusters. The first dimension separated P. pulchella from the other species, with P. batesii specimens intermediate between P. pulchella and P. cocyta/P. tharos (Fig. 3A). The second dimension separated P. tharos from P. cocyta (Fig. 3A), while the third dimension showed the 6 P. batesii specimens as distinct from the 3 other species (Fig. 3B). Two putative F1 hybrid individuals appeared between their putative parental species. Principal components 4 and 5 showed geographic clustering for P. pulchella from the United States and P. cocyta from British Columbia (data not shown).
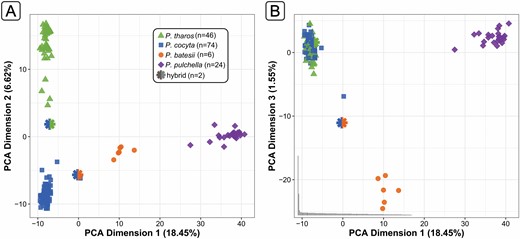
Principal component analysis of 1,477 SNPs for 152 individuals. (A) The first two dimensions show P. pulchella as the most genetically distinct, with P. batesii intermediate between P. cocyta and P. pulchella. Two potential F1 hybrid individuals each appear between their likely parental species. (B) The third dimension shows P. batesii as genetically distinct from the other 3 species.
STRUCTURE analysis of all individuals indicated an optimal value of K = 4 (Fig. 2B, Supplementary Fig. S3), and higher values did not produce additional meaningful clusters (Supplementary Fig. S4). ΔK was highest for K = 2 (Supplementary Fig. S3a), grouping P. tharos with P. cocyta and P. batesii with P. pulchella (Supplementary Fig. S4). This may reflect both hierarchical structuring in the data and unequal sample sizes; ΔK estimates using the Evanno method are known to be sensitive to these factors (Janes et al. 2017). ΔK also had a small peak at K = 3 (Supplementary Fig. S3a), consistent with (Ln Pr(X|K)), which began to plateau at K = 3 and increased marginally for K = 4 (Supplementary Fig. S3b).
Overall, STRUCTURE clusters for K = 3 and 4 were consistent with the SNP phylogeny, and most sample genotypes (129/152) had Q-values (proportions of admixture) of 95% or greater (Fig. 2A, B). The K = 3 plot recognized P. pulchella, P. tharos, and P. cocyta as separate entities, with common admixture between the latter two species, while the putative P. batesii appeared as an unresolved cluster, most with Q-values of approximately 50% for both P. pulchella and P. cocyta. The K = 4 plot further resolved P. batesii individuals as a distinct cluster with reduced proportions of shared ancestry with P. pulchella. One individual appears to be a P. batesii X cocyta hybrid (11142), while another appears to be closer to P. cocyta (11292) with admixture from P. batesii and P. pulchella (Fig. 2A, B). Additionally, one individual in the P. cocyta cluster appears to be a P. tharos X cocyta (11215) F1 hybrid, while another individual may be a backcross between P. tharos and P. cocyta (11267). Sub-structure analyses resulted in clusters that correspond with species boundaries (P. batesii and P. pulchella), geography (P. tharos), or intraspecific variation (P. cocyta) (Supplementary Fig. S5). Evidence of admixture was also recovered by f3 statistics, with significant admixture between P. batesii with P. cocyta and P. pulchella (Z = −6.96) and P. batesii with P. tharos and P. pulchella (Z = −3.95) (Supplementary Table S4).
Discussion
How Many Species in the Phyciodes tharos group?
The number of species in the Phyciodes tharos group has remained uncertain due to substantial variation in nearly every trait used to diagnose these species (Scott 1994, 1998, 2006), incomplete reproductive isolation (Oliver 1972, 1978, 1979a, b, 1980, Scott 1986), and shared mitochondrial COI haplotypes between species (Wahlberg et al. 2003a, Proshek and Houghton 2012). In our geographically focused study, genome-wide SNPs produced a phylogenetic tree that was consistent with the 4 traditionally delimited species. Geographic distance did not obscure phylogenetic relationships, and samples of each species from Alberta clustered with individuals of the same species from across their ranges (Fig. 2A). As with Wahlberg et al. (2003a) and Proshek and Houghton (2012), our COI tree was only partly resolved; P. batesii did not form a unique grouping, and haplotypes were shared between all species pairs except for P. tharos and P. pulchella (Fig. 2C, Supplementary Fig. S2).
STRUCTURE and PCA analyses also support the existence of 4 species in Alberta. Unambiguous clusters were recovered in the K = 4 STRUCTURE plot and on the first 3 PCA dimensions (Figs. 2B and 3). Little sub-structuring is apparent within species (Supplementary Fig. S5). Phyciodes tharos from the southern United States exhibited shared ancestry with P. cocyta (Supplementary Fig. S1), despite being outside the P. cocyta geographic range and formed a distinct cluster in the substructure analysis (Supplementary Fig. S5). This may be due to subspecific divergence, retained ancestral polymorphism, or introgression with an unsampled Phyciodes species from that region that is not otherwise represented in the STRUCTURE analysis (Beerli 2004, Slatkin 2005).
Incomplete Lineage Sorting or Ancient Introgression?
All P. batesii individuals exhibit shared ancestry with P. pulchella (Fig. 2B, Supplementary Table S4). Given that two of the P. batesii individuals are from Manitoba, which is located east of Alberta and far outside the geographic range of P. pulchella (Supplementary Table S1, Supplementary Fig. S1), and P. batesii were collected in different localities over several years, it is unlikely that genomic similarity to P. pulchella is the result of recent hybridization. It is also unlikely that the putative P. pulchella SNPs are from unsampled “ghost populations” (Beerli 2004, Slatkin 2005) on the edge of the sampling area because there are no other Phyciodes species that occur near Manitoba (Brock and Kaufman 2006).
Genetic material may be shared between closely related species through shared ancestry (Lavretsky et al. 2019), but speciation can also involve, or even be driven by, gene flow between diverging lineages (Mallet 2007, Mallet et al. 2007, Sousa and Hey 2013, Dupuis and Sperling 2015, Tahami et al. 2021). Thus, it is possible that P. batesii and P. pulchella share retained ancestral genomic material or, alternatively, that the evolutionary history of the P. batesii lineage involved episodic introgression with P. pulchella during divergence. However, low sample sizes can affect the accuracy of estimates of genetic diversity, and more comprehensive sampling of P. batesii may yield additional SNPs that are unique to this species (Puechmaille 2016, Lawson et al. 2018).
Contemporary Introgression and Genomic Integrity
The genomic integrity species concept considers species as divergent lineages that maintain their genomic integrity upon contact (Sperling 2003). Genome-wide data for the P. tharos group produced 4 clusters with evidence of gene flow among them (Fig. 2A, B), and recognition of these 4 lineages as species is consistent with the genomic integrity concept.
Based on both genome-wide SNPs and mitochondrial sequence data, most genetic interaction appears to occur between P. tharos and P. cocyta. There is evidence of one F1 hybrid between these species and several individuals with varying levels of recent gene flow in areas of sympatry in Alberta (Fig. 2B, Supplementary Fig. S1). The P. cocyta individuals from the United States also show evidence of introgression from P. tharos in areas of sympatry, indicating that these species may interact somewhat regularly, albeit at low levels, across their range. Gene flow does not appear to be biased in either direction based on SNPs, but our data does suggest the unidirectional movement of COI from P. tharos to P. cocyta (Fig. 2C). The timing of broods, particularly in the spring, may be responsible, as male butterflies tend to emerge before females (Scott 1977, Wiklund and Fagerström 1977). In Alberta, P. tharos is the first of the 4 species to emerge (Bird et al. 1995), and so, female P. tharos may overlap with newly emerging P. cocyta males.
We found one likely F1 hybrid between P. cocyta and P. batesii (Fig. 2B, Supplementary Fig. S1). Additionally, the P. cocyta individual in the SNP tree grade shares ancestry with P. batesii. The intermediacy of this individual may help explain the weak separation between P. cocyta and P. batesii in the tree. Given that P. batesii appears to consistently share COI haplotypes with either P. cocyta or P. tharos, it is likely that there has been a long history of introgression of P. batesii with these species (Fig. 2C, Supplementary Fig. S2, Wahlberg et al. 2003a, Proshek & Houghton 2012).
This is the first study to present genome-wide evidence for the 4 traditionally recognized species in the Phyciodes tharos group. The maintenance of separate lineages despite gene flow supports the traditionally recognized species according to the genomic integrity species concept. These findings demonstrate the utility of genome-wide data for assessing difficult taxonomic relationships. As in previous studies, we found that COI haplotypes are shared between most species and are thus an ineffective identification tool for this group. We suggest that shared genomic ancestry between species may be due to incomplete lineage sorting, ancient introgression, and ongoing hybridization. By limiting our sampling primarily to Alberta, we were able to assess these taxa without having to consider admixture from other Phyciodes species. We recommend comprehensive sampling of Phyciodes batesii to better understand its species boundaries, especially with P. pulchella and P. cocyta. We also suggest a North America-wide genomic study of all Phyciodes species to better understand the evolutionary history of this group.
Disclaimer: Nagoya Protocol: The authors attest that all legal and regulatory requirements, including export and import collection permits, have been followed for the collection of specimens from source populations at any international, national, regional, or other geographic level for all relevant field specimens collected as part of this study.
Acknowledgments
We particularly thank Gary Anweiler, Barb and Jim Beck, Sean Bishop, Wayne Brehaut, Barb Campbell, G. Carscallen, Bruce Christensen, Julian Dupuis, Paula Evans, Simon Ferguson, Rowan French, Todd Gilligan, Nick Grishin, Laura Hay, Gerald Hilchie, Robert Holmberg, Bonnie Hood, Cheryl Kee, Norbert Kondla, Dave Lawrie, Jonathan Leggo, Zac MacDonald, Aiden Maston, Andrew Mitchell, Tyler Nelson, Ted Pike, Federico Riva, Vic Romanyshyn, Dan Rubinoff, Thomas Sperling, and William Sperling for help with specimen collection. We thank Victor Shegelski and Danny Shpeley of the Strickland Museum of Entomology at the University of Alberta for access to museum specimens and for accepting voucher specimens. We also thank Julian Dupuis and Oksana Vernygora for their advice on phylogenetic analysis. We additionally acknowledge the Molecular Biology Service Unit at the University of Alberta for sequencing support, as well as Compute Canada (www.computecanada.ca) and Westgrid (www.westgrid.ca) for computational support. We would like to thank editor, Jason Bond, subject editor, Marko Mutanen, and 2 anonymous reviewers for their valuable feedback during review.
Funding
This work was funded by a Natural Sciences and Engineering Research Council (NSERC) Discovery grant to F.A.H.S. (RGPIN-2018-04920).
Author Contributions
Brittany Wingert (Conceptualization [Lead], Data curation [Lead], Formal analysis [Lead], Investigation [Lead], Methodology [Lead], Validation [Lead], Visualization [Lead], Writing—original draft [Lead], Writing—review & editing [Lead]), Erin Campbell (Conceptualization [Supporting], Investigation [Supporting], Methodology [Supporting], Supervision [Supporting], Visualization [Supporting], Writing—review & editing [Supporting]), John Acorn (Conceptualization [Supporting], Investigation [Supporting], Supervision [Supporting], Visualization [Supporting], Writing—review & editing [Supporting]), and Felix Sperling (Conceptualization [Supporting], Funding acquisition [Lead], Investigation [Supporting], Methodology [Supporting], Project administration [Lead], Supervision [Lead], Visualization [Supporting], Writing—original draft [Supporting], Writing—review & editing [Supporting])
