


Abstract
3,4-Methylenedioxymethamphetamine (MDMA) is a widely used recreational substance inducing acute release of serotonin. Previous studies in chronic MDMA users demonstrated selective adaptations in the serotonin system, which were assumed to be associated with cognitive deficits. However, serotonin functions are strongly entangled with glutamate as well as γ-aminobutyric acid (GABA) neurotransmission, and studies in MDMA-exposed rats show long-term adaptations in glutamatergic and GABAergic signaling.
We used proton magnetic resonance spectroscopy (MRS) to measure the glutamate-glutamine complex (GLX) and GABA concentrations in the left striatum and medial anterior cingulate cortex (ACC) of 44 chronic but recently abstinent MDMA users and 42 MDMA-naïve healthy controls. While the Mescher-Garwood point-resolved-spectroscopy sequence (MEGA-PRESS) is best suited to quantify GABA, recent studies reported poor agreement between conventional short–echo-time PRESS and MEGA-PRESS for GLX measures. Here, we applied both sequences to assess their agreement and potential confounders underlying the diverging results.
Chronic MDMA users showed elevated GLX levels in the striatum but not the ACC. Regarding GABA, we found no group difference in either region, although a negative association with MDMA use frequency was observed in the striatum. Overall, GLX measures from MEGA-PRESS, with its longer echo time, appeared to be less confounded by macromolecule signal than the short–echo-time PRESS and thus provided more robust results.
Our findings suggest that MDMA use affects not only serotonin but also striatal GLX and GABA concentrations. These insights may offer new mechanistic explanations for cognitive deficits (e.g., impaired impulse control) observed in MDMA users.
3,4-Methylenedioxymethamphetamine (MDMA) is a strong serotonin-releasing agent, and its chronic use has been associated with selective changes in the serotonin system that were suggested to result in cognitive deficits consistently observed in MDMA users (e.g., deficits in declarative memory and impulse control). However, a clear mechanistic link is missing. Here, we applied proton magnetic resonance spectroscopy (MRS) and showed that chronic MDMA use is associated with alterations in the glutamate-glutamine complex (GLX) and γ-aminobutyric acid (GABA) concentration in the striatum but not the anterior cingulate cortex. These findings indicate that chronic MDMA use is related to changes in the principal excitatory and inhibitory neurotransmitter systems, and thus cognitive deficits commonly observed in MDMA users might stem from glutamatergic and GABAergic changes, particularly in the striatum.
INTRODUCTION
Neural functioning is based on the interplay between the principal excitatory and inhibitory neurotransmitters glutamate and γ-aminobutyric acid (GABA). In addition, their interaction is modulated by monoaminergic neurotransmitters (i.e., serotonin [5-HT], dopamine, and noradrenaline), shaping the signal transmission in the brain. Specifically, 5-HT modulates excitatory and inhibitory activity via adaptation of presynaptic glutamate and GABA release or postsynaptic excitability of glutamatergic and GABAergic neurons (Ciranna, 2006).
3,4-Methylenedioxymethamphetamine (MDMA; “ecstasy”) is a strong 5-HT and noradrenaline releaser, targeting primarily transporters of both transmitters in the brain (Rothman and Baumann, 2003; Hysek et al., 2011). In humans, MDMA has been reported to elevate mood and wakefulness as well as empathy (Liechti et al., 2000; Hysek et al., 2014). After cannabis and cocaine, MDMA currently has the third-highest prevalence of illicit substance use in Europe (European Monitoring Centre for Drugs and Drug Addiction, 2022). Chronic use of MDMA has been repeatedly associated with cognitive deficits, such as impaired memory and impulse control (Morgan et al., 2006; Quednow et al., 2006, 2007; Wunderli et al., 2017), which have been suggested to result from MDMA-induced selective neurotoxicity in the 5-HT system. Studies in recently abstinent recreational MDMA users consistently reported long-term 5-HT depletion, 5-HT transporter deficiency, and increased 5-HT2A receptor density in the brain that persisted months after last use (McCann et al., 1994; Kish et al., 2000; Roberts et al., 2016; Müller et al., 2019). Moreover, animal studies have shown severe MDMA-induced degradation of 5-HT nerve terminals (Commins et al., 1987; Ricaurte et al., 1988). Thus, although some impact of repeated MDMA use on the 5-HT system is evident, precisely how the major excitatory and inhibitory neurotransmitter systems are altered by MDMA use in humans remains elusive.
In rats, repeated administration of MDMA permanently attenuated 5-HT–mediated inhibition of glutamate-evoked cell firing in the striatum (Obradovic et al., 1998). Furthermore, chronic MDMA exposure in rats was associated with increased glutamate levels in the prefrontal cortex and enhanced expression of glutamatergic receptor genes in the cortex and striatum (Kindlundh-Högberg et al., 2008; Perrine et al., 2010). Additionally, repeated MDMA administration decreased GABA concentration in the rat hippocampus and increased gene expression of GABA transporter subunits in the rat frontal cortex as well as midbrain (Simantov, 2004; Perrine et al., 2010). Thus, although there is evidence from animal models that repeated MDMA-induced 5-HT release indirectly alters glutamatergic and GABAergic neurotransmission in the long term, this has not yet been demonstrated in humans.
So far only two studies have reported glutamate concentrations measured via proton magnetic resonance spectroscopy (MRS) in chronic MDMA users, and neither study observed an effect in the occipital or midfrontal cortex nor in the striatum (Chang et al., 1999; Liu et al., 2011). However, their sample sizes were considerably smaller (included MDMA users n = 21 and n = 25, respectively), substance use was only assessed via self-reports, and analyses did not include any covariates (e.g., co-use of other substances). Because MDMA users tend to display a widespread pattern of polysubstance use (Gouzoulis-Mayfrank and Daumann, 2006) and self-reports generally underestimate substance use (Steinhoff et al., 2023), controlling for co-use of other substances using objective quantification via hair toxicological analysis is critical. Moreover, Chang et al. (1999) used a 1.5-Tesla scanner, which is known to provide lower accuracy in quantifying glutamate and GABA (Gonen et al., 2001). Notably, no published study to date has investigated GABA in MDMA users employing MRS.
MRS is, to date, the only available non-invasive method to measure glutamate and GABA concentrations in the human brain in vivo. Glutamate is frequently measured using a conventional point resolved spectroscopy sequence (PRESS; Bottomley, 1987) with a short echo time (TE) of 30–35 milliseconds, but due to strong overlap of their resonance at clinical magnetic field strength, glutamate and glutamine are often reported as a composite signal (glutamate-glutamine complex [GLX]) (Bell et al., 2021). In contrast to GLX, a specialized sequence is required to reliably detect GABA, and most often the Mescher-Garwood PRESS sequence (MEGA-PRESS) with a longer TE (68/80 ms) is applied (Mescher et al., 1998). Both PRESS and MEGA-PRESS have been shown to reliably detect GLX when measuring phantoms with known concentrations of metabolites (Sanaei Nezhad et al., 2018; van Veenendaal et al., 2018), and both sequences separately provided a high test–retest reliability in humans in vivo (Baeshen et al., 2020; Shyu et al., 2021). However, recent studies have shown poor agreement between PRESS and MEGA-PRESS on GLX measurements in humans. The mechanisms responsible for this divergence are still poorly understood (van Veenendaal et al., 2018; Bell et al., 2021) but likely involve difficulties in appropriately modeling broad underlying background signals from macromolecules. Therefore, by applying both PRESS and MEGA-PRESS in this study, we examined the consistency of GLX quantification between these sequences, focusing in particular on region-specific agreement and factors that may determine the possible discrepancy.
The main objective of this study was to assess GLX and GABA levels in the left striatum and anterior cingulate cortex (ACC) in human chronic MDMA users and matched healthy control participants. The region of interests chosen in this study are similar to the previous studies assessing effects of MDMA use on brain metabolites in humans (Chang et al., 1999; Liu et al., 2011). However, none of these studies have measured GABA levels in these regions. We adopted a conventional volume of interest (VOI) approach to measure brain neurotransmitters because there are strong a priori hypotheses about the relevance of the selected regions to our study. Several studies have shown that GABA and glutamate play a critical role in impulsive behavior related to substance use (Goodman, 2008; Kalivas and Volkow, 2011; McCullumsmith and Sanacora, 2015; Naaijen et al., 2015), and they have been shown to modulate inhibitory control in healthy, nondrug-using individuals (Silveri et al., 2013; Hayes et al., 2014; Haag et al., 2015; Quetscher et al., 2015). Specifically, striatal GABA concentrations, as well as GABA levels in the ACC, have been shown to predict impulsivity and inhibitory control. It has also been shown that striatal GABAergic and glutamatergic concentrations highly modulate the behavioral performance during inhibitory control (Dharmadhikari et al., 2015; Haag et al., 2015; Quetscher et al., 2015). MDMA use has been constantly associated with increased impulsive behavior and impaired inhibitory control in several studies (Morgan et al., 2006; Quednow et al., 2007; Hanson et al., 2008). It has been suggested that this is related to 5-HT depletion in MDMA users (Verdejo-García et al., 2008). However, clear mechanistic evidence in humans is lacking to date, and potential adaptations in glutamate and GABA levels might hint at a distinct mechanistic explanation. Additionally, the striatum and ACC are key loci for the initiation and maintenance of substance use, specifically linked to glutamatergic and GABAergic signaling, respectively (Kalivas, 2009; Koob and Volkow, 2016). Notably, MDMA-related changes in glutamatergic and GABAergic neurotransmission might potentially result in a hyperexcitable state and glutamatergic excitotoxicity, which could contribute to MDMA-related neurotoxic effects (Finnegan and Taraska, 1996; Quinton and Yamamoto, 2006). Taken together, the striatum and ACC are critical structures that might be involved in impulse control deficits in MDMA users. Previously, MDMA use-related molecular changes in humans that persist for months after last use have been attributed exclusively to the 5-HT system, and with this study we aimed to assess whether long-term changes also occur in the main excitatory and inhibitory systems. The raphe nuclei provide substantial afferent input to the striatum as well as ACC, and 5-HT has profound inhibitory effects in these regions (Finch et al., 1984; Guerra et al., 1998; Miguelez et al., 2014; Tian et al., 2017). Accordingly, known long-term 5-HT adaptations in MDMA users are likely to affect major inhibitory and excitatory neurotransmitters in these regions as well. We hypothesized that GLX and GABA concentrations are altered in MDMA users due the prominent influence of 5-HT signaling on glutamatergic and GABAergic neurotransmission, along with initial supporting evidence from animal studies (Obradovic et al., 1998; Ciranna, 2006; Kindlundh-Högberg et al., 2008).
METHODS
Participants
MDMA users were included if they had used MDMA on more than 25 occasions and their last consumption was no longer than 4 months ago, which was verified by forensic hair toxicology (see below). Control participants were excluded if they had used illicit substances other than cannabis on more than 15 occasions during their lifetime. Further, general exclusion criteria included past or current Axis I DSM-IV psychiatric disorder (with the exception of substance use disorders for the MDMA user group); current or previous neurological disorders; severe somatic diseases or head injury; current use of medications that affect the central nervous system; previous or current intravenous heroin use; daily cannabis consumption; a DSM-IV diagnosis of schizophrenia, bipolar disorder, or obsessive-compulsive disorder in first-degree relatives; and any MRI contraindications. Participants were instructed to abstain from psychotropic substances for at least 3 days (tested via urine toxicology, see below) and from alcohol for 24 hours before attending the study. The Ethics Committee of Canton Zurich approved the study (BASEC-Nr. 2018-02125), and all participants gave written informed consent according to the Declaration of Helsinki.
The measured sample comprised 49 chronic MDMA users and 47 MDMA-naïve healthy controls aged between 18 and 45 years. Five participants of the MDMA user group were excluded due to the lack of MDMA use confirmation by forensic hair toxicological analysis (n = 4) or diagnosis of an Axis I DSM-IV psychiatric disorder (n = 1). Five control participants had to be excluded due to the detection of MDMA traces in hair analysis. Diffusion tensor imaging data of the this sample have already been published in Zimmermann et al. (2022). The remaining participants in both groups were matched for age, sex, verbal intelligence, years of education, and nicotine use. After quality control of MRS data (see below), the data of participants with clear artefacts in the MRS spectrum were discarded from analysis.
Clinical and Substance Use Assessment
DSM-IV Axis I disorders were assessed by trained psychologists using the Mini-International Neuropsychiatric Interview for DSM-IV Axis I disorders (Sheehan et al., 1998), with the exception of the presence and severity of substance use disorders, which were evaluated based on the Structured Clinical Interview for DSM-5 Axis I disorders (First, 2015). Participants also completed the Attention-Deficit/Hyperactivity Disorder Self-Rating Scale (Rösler et al., 2004), the Center for Epidemiologic Studies Depression Scale (Eaton et al., 2004), and a standardized German vocabulary test to estimate their premorbid verbal intelligence (verbal IQ) (Mehrfachwahl-Wortschatz-Intelligenztest; Lehrl et al., 1995). The standardized Interview for Psychotropic Drug Consumption (Quednow et al., 2004) was used to assess self-reported substance use history. Moreover, to objectively quantify substance use within 4 months prior to study participation, hair was sampled from the occiput (proximal 4 cm), if applicable; otherwise body hair was collected (n = 8). Forensic hair toxicological analyses were performed using liquid chromatography-tandem mass spectrometry as described in Scholz et al. (2021). Additionally, to assess acute drug intoxication, urine samples were analyzed using liquid chromatography-tandem mass spectrometry.
MRI and Spectroscopy
MRI measurements were conducted at the Psychiatric University Hospital Zurich on a 3-Tesla Achieva scanner (Philips Healthcare, Amsterdam, Netherlands) with 80-mT/m gradients and a 32-channel receive head coil. To allow accurate placement of the volume of interest (VOI), a T1-weighted 3D Turbo-Field-Echo sequence with 1-mm isotropic resolution (TR = 8.1 ms, TE = 3.7 ms) was conducted. The VOIs for the MRS measurements were positioned in the left striatum (30 × 30 × 30 mm3) and midline ACC (40 × 30 × 20 mm3) as displayed in Figure 1. Because no lateral effects between left and right striatum were observed in previous studies measuring GLX and GABA in the striatum (Haag et al., 2015; Quetscher et al., 2015; Bensmann et al., 2020; Takacs et al., 2021), the striatum was measured unilaterally only. The PRESS sequence (TR = 2000 ms, TE = 30 ms) was applied using 4 dynamics, each including 64 averages, resulting in 256 transients per spectrum. The MEGA-PRESS sequence (TR = 3000 ms, TE = 68 ms) included 128 transients per spectrum. Both sequences used a spectral width of 2000 Hz and 2048 spectral points, VAPOR water suppression, and second-order automatic pencil-beam shim. Processing was performed using ReconFrame (GyroTools LLC, Zurich, Switzerland) and included eddy-current correction, frequency-and-phase alignment of individual transients (adopted from FID-A toolbox) (Simpson et al., 2017), and residual water filter. Metabolite concentrations for both sequences were extracted from fitting an LCModel version 6.3 (Provencher, 2001). The LCModel for the PRESS spectra was fitted using a simulated basis set including 20 metabolites (alanine, aspartate, glucose, creatine, phosphocreatine, glutamine [GLN], glutamate [GLU], glycerophosphocholine, phosphocholine, lactate, myo-inositol, N-acetyl-aspartate [NAA], N-acetyl-aspartyl-glutamate [NAAG], scyllo-inositol, glutathione, taurine, glycine, phosphoethanolamine, ascorbate, and GABA), whereas the simulated basis set for MEGA-PRESS spectra included 6 metabolites (GABA, GLN, GLU, glutathione, NAA, and NAAG). However, only GLX and GABA were output variables of interest in this study. We have chosen GLX instead of GLU as the primary outcome because there is evidence that PRESS scans with a short TE might not be able to accurately separate the GLU and GLN signals (Henry et al., 2011), and it is currently controversial whether separation of GLU and GLN is comparable between PRESS and MEGA-PRESS (van Veenendaal et al., 2018). Therefore, GLU and GLN were compared between groups only in a subsequent exploratory analysis to explore whether the observed group difference was driven by GLU or GLN. Brain tissue within VOI was segmented into grey matter, white matter, and cerebrospinal fluid using SPM12 (Ashburner and Friston, 2005) to perform appropriate tissue correction. Metabolite concentrations are reported as the ratio to the unsuppressed water peak and reflect an estimation of metabolite concentration in moles per kilogram of brain water excluding water within CSF. Data quality of spectra was assessed for artefacts via visual inspection by an experienced MR physicist, and, in accordance with (Kreis, 2004), participants with inadequate data quality were excluded. Moreover, data quality was assessed based on signal-to-noise ratio (SNR), full width half maximum of spectral peaks, coefficient of variation, and relative Cramér-Rao lower bounds. An overview of quality measures per sequence, metabolite, region, and participant group is reported in Table 2. Complete and detailed MRS parameter specifications are listed supplementary Table 1.
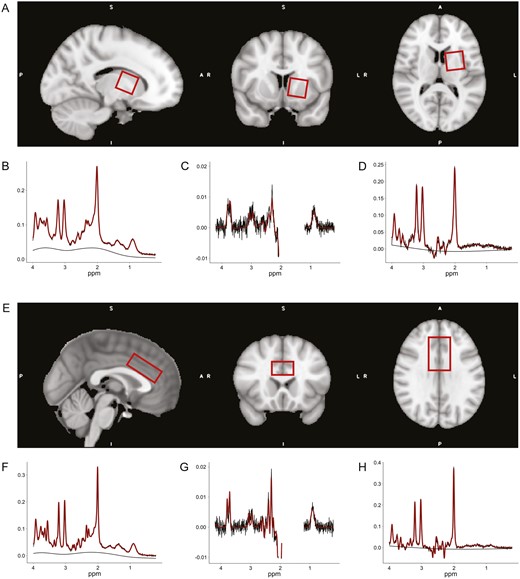
Exemplary position of the proton magnetic resonance spectroscopy (MRS) volume of interests (VOIs) in Montreal Neurological Institute (MNI) space and representative spectra from one participant. (A) Placement of the VOI in the left striatum (30 × 30 × 30 mm3). The VOI was rotated towards midline in axial plane and in anterior direction in sagittal plane, to cover as much as possible of the caudate nucleus and the putamen, while avoiding any parts of the ventricles. (B–D) Exemplary spectra of the left striatum from 1 participant with full width at half maximum (FWHM) = 9.76 Hz. (B) PRESS spectra with signal-to-noise ratio (SNR) = 28. (C) MEGA-PRESS difference (MEGAdiff) spectra with SNR = 19. (D) MEGA-PRESS OFF subresonance (MEGAoff) spectra with SNR = 25. (E) Placement of the VOI in the anterior cingulate cortex (ACC) (40 × 30 × 20 mm3). The VOI was positioned on top of the corpus callosum, centered at midline, and translated as well as rotated in the anterior direction of the sagittal plane, such that the anterior edge of the VOI was above the most anterior part of the corpus callosum genu. Hence, including most parts of the dorsal ACC. (F-H) Exemplary spectra of the ACC from 1 participant with FWHM = 6.59 Hz. (F) PRESS spectra with SNR = 48. (G) MEGAdiff spectra with SNR = 28. (H) MEGAoff spectra with SNR = 36. The smooth black lines represent the baseline model determined by LCModel.
Comparison of GLX Quantification From PRESS and MEGA-PRESS
The signal of GABA displays three coupled resonances (3.0, 2.3, and 1.9 ppm), which are overlapped by other uncoupled resonances of higher concentration. Thus, two different scans are necessary to reveal the GABA peak at 3.0 ppm using a subtraction technique, J-difference spectral editing. In the so-called ON scan, an editing pulse is applied at a frequency of 1.9 ppm, which modulates the coupled GABA signal at 3.0 ppm but not its overlapping metabolites (Maddock et al., 2018; Bell et al., 2021). In the OFF scan, the editing pulse is chosen such that it does not affect the 3.0-ppm GABA resonance. During postprocessing, the ON scans are then subtracted from the OFF scans, and the resulting difference spectra (MEGAdiff) reveals the GABA signal at 3.0 ppm (Mullins et al., 2014). However, GLX can also be extracted via MEGA-PRESS, specifically either from the MEGAdiff or the OFF subspectra (MEGAoff). The latter is most similar to a short-TE PRESS acquisition of GLX, except that it is acquired at a different TE (Maddock et al., 2018). Accordingly, GLX quantifications from PRESS, MEGAdiff, and MEGAoff were compared with test the agreement between both sequences.
Statistical Analysis
Group differences regarding GLX and GABA were estimated using linear regression models on z-scored metabolite concentrations. Covariates for the regression models included age, sex, and co-use of substances other than MDMA (alcohol use [estimated use within 6 months prior to testing according to self-reports], cannabis, and stimulant use [i.e., cocaine and amphetamine; respective hair residuals from hair toxicological analysis]). These covariates were included based on the evidence that age (Sailasuta et al., 2008), sex (O’Gorman et al., 2011), and the use of above-mentioned substances (Chen et al., 2020) affect GLX and GABA concentrations in the human brain. Although we rigorously excluded participants whose MRS spectra showed prominent artefacts, the GLX and GABA concentrations still contained outlier data points, and therefore robust regression models as implemented in the function lmrob from the R-package robustbase (Maechler et al., 2021) were additionally applied to confirm group differences. Robust regression is a form of weighted linear regression minimizing the influence of outlier data points, and here the estimation of robust regression coefficients was achieved using an MM-type estimator as described in Koller and Stahel (2011). A correlation analysis was further performed to assess the relationship between metabolite concentration and frequency of MDMA use within MDMA users, as well as to estimate consistency between GLX quantification of PRESS/MEGA-PRESS and MEGAdiff/MEGAoff. All correlation coefficients reflect robust estimates based on the approach described above. All tests were 2-tailed, and an alpha-level of 5% was used. Sensitivity power analysis showed that the present sample was able to detect effects of Cohen d > 0.58 based on a power of 80% (computed using the R-package pwr) (Champely et al., 2017). Statistical analysis and data visualization were performed in R version 4.0.3 (R Core Team, 2021). Data and analysis code used for this study can be accessed at https://github.com/jziNeuro/MRS_MDMA_publication.
RESULTS
Demographic and Substance Use Characteristics of Sample
MDMA users did not differ from the control group regarding demographic variables as well as attention-deficit/hyperactivity disorder and depression symptoms (Table 1). MDMA users co-used other substances, such as cannabis and stimulants, even though to a lesser extent, so that MDMA was clearly the most frequently used illicit substance. Based on the SCID-5 diagnostic interview, 6 users had a moderate MDMA use disorder and 5 users a mild MDMA use disorder according to DSM-5 criteria.
Overview on Demographics and Substance Use of MDMA User and Control Groups
| Controls (n = 42) | MDMA user (n = 44) | Statistic | P | |
|---|---|---|---|---|
| Age, y | 29.9 (6.7) | 30.18 (6.8) | 0.19 | .85 |
| Sex (female, male) | 24/18 | 25/19 | 0.00 | 1.00 |
| Years of school education | 9.9 (1.3) | 10.4 (1.5) | 1.43 | .16 |
| Verbal intelligence | 104.4 (10.6) | 101.8 (10.5) | 1.15 | .25 |
| ADHD total score | 11.2 (7.4) | 13.9 (10.6) | 1.40 | .17 |
| CESD total score | 10.9 (9.2) | 12.7 (11.3) | 0.80 | .43 |
| MDMA | ||||
| Consumed last 6 mo (y/n) | 0/42 | 44/0 | 82.04 | <.001 |
| Dose per week, mga | 0.0 (0.0) | 100.9 (130.1) | 5.03 | <.001 |
| Occasions per weeka | 0.0 (0.0) | 0.4 (0.3) | 7.99 | <.001 |
| Use, y | 0.0 (0.0) | 9.1 (5.9) | 9.92 | <.001 |
| Cumulative dose lifetime, g | 0.02 (0.1) | 90.6 (148.1) | 3.97 | <.001 |
| Cumulative dose lifetime (tablets)b | 0.1 (0.6) | 604.2 (987.0) | — | — |
| Days since last consumptionc | — | 21.7 (17.7), n = 44 | — | — |
| Positive urine testing (y/n) | 0/42 | 0/44 | — | — |
| Hair analysis, pg/mg] | 0.0 (0.0) | 786.0 (826.6) | 2.37 | .020 |
| Nicotine | ||||
| Consumed last 6 mo (y/n) | 22/20 | 27/17 | 0.39 | .53 |
| Cigarettes per day | 2.9 (5.3) | 4.2 (6.2) | 1.03 | .31 |
| Use, y | 7.1 (7.6) | 10.2 (8.9) | 1.75 | .084 |
| Alcohol | ||||
| Consumed last 6 mo (y/n) | 36/6 | 44/0 | 4.74 | .030 |
| Dose per week, ga | 0.1 (0.1) | 0.2 (0.2) | 1.97 | .052 |
| Occasions per weeka | 2.0 (1.7) | 2.1 (1.8) | 0.30 | .77 |
| Use, y | 12.0 (7.5) | 13.8 (7.2) | 1.10 | .28 |
| Cumulative dose lifetime, kg | 91.7 (137.4) | 154.2 (205.8) | 1.65 | .10 |
| Days since last consumptionc | 7.9 (23.9), n = 36 | 15.7 (32.4), n = 44 | 1.20 | .23 |
| Cannabis | ||||
| Consumed last 6 mo (y/n) | 10/32 | 26/18 | 9.59 | .002 |
| Dose per week, ga | 0.04 (0.1) | 0.3 (0.7) | 1.88 | .063 |
| Occasions per weeka | 0.2 (0.7) | 0.6 (1.3) | 1.71 | .090 |
| Use, y | 4.7 (6.6) | 9.4 (7.8) | 3.04 | .003 |
| Cumulative dose lifetime, g | 217.4 (600.1) | 733.6 (1225.0) | 2.46 | .016 |
| Days since last consumptionc | 32.8 (54.9), n = 10 | 25.6 (30.7), n = 26 | 0.50 | .62 |
| Positive urine testing (y/n) | 2/40 | 1/43 | 0.00 | .97 |
| Hair analysis, pg/mgd | 0.00 (0.00) | 0.00 (0.00) | 2.41 | .018 |
| Amphetamine | ||||
| Consumed last 6 mo (y/n) | 0/42 | 23/21 | 27.36 | <.001 |
| Dose per week, ga | 0.0 (0.0) | 0.04 (0.1) | 2.68 | .009 |
| Occasions per weeka | 0.0 (0.0) | 0.1 (0.3) | 3.12 | .002 |
| Use, y | 0.0 (0.0) | 4.6 (6.9) | 4.29 | <.001 |
| Cumulative dose lifetime, g | 0.01 (0.03) | 102.9 (341.6) | 1.95 | .054 |
| Days since last consumptionc | — | 43.2 (49.2), n = 23 | — | — |
| Positive urine testing (y/n) | 0/42 | 0/44 | — | — |
| Hair analysis, pg/mgd | 0.0 (0.0) | 17.0 (25.2) | 2.60 | .011 |
| Cocaine | ||||
| Consumed last 6 mo (y/n) | 3/39 | 27/17 | 25.48 | <.001 |
| Dose per week, ga | 0.0 (0.0) | 0.1 (0.2) | 2.74 | .007 |
| Occasions per weeka | 0.0 (0.01) | 0.2 (0.4) | 2.76 | .007 |
| Use, y | 0.0 (0.0) | 4.1 (6.1) | 4.31 | <.001 |
| Cumulative dose lifetime, g | 0.03 (0.1) | 37.4 (85.2) | 2.84 | .006 |
| Days since last consumptionc | 56.3 (34.2), n = 3 | 60.1 (60.3), n = 27 | 0.11 | .92 |
| Positive urine testing (y/n) | 0/42 | 1/43 | 0.00 | 1.00 |
| Hair analysis, pg/mgd | 0.0 (0.0) | 147.0 (217.9) | 1.19 | .24 |
Abbreviations: ADHD, Attention-Deficit/Hyperactivity Disorder; CESD, Center for Epidemiologic Studies Depression Scale.
Values reflect mean and SD, except that for hair residuals the median and median absolute deviation are shown due to a highly right-skewed distribution. Independent t tests were used for quantitative data and chi-squared tests for frequency data; significant P values are displayed in bold.
aWithin 6 months before study participation.
bIn 150-mg tablets.
cDays since last consumption reflects the average for participants reporting to have used the substance within 6 months before study participation, and therefore sample size (n) is shown.
dHair residuals reflect sum score of respective substance and its metabolites as quantified via forensic hair toxicology.
MDMA Use and GLX Levels
Linear regression models including covariates for age, sex, and co-use of other substances revealed significantly increased GLX concentrations in the left striatum of MDMA users (β = .71, t[67] = 2.72, P = .008; Cohen d = 0.57; Figure 2A). Notably, this effect remained significant when using robust linear regression to account for outlier data points (β = .56, t[67] = 2.11, P = .038; see supplementary Table 4). In the ACC, on the other hand, no effect of MDMA use on GLX levels was found (β = −.23, t[54] = −0.73, P = .46; Cohen d = 0.16). To assess whether observed group differences regarding GLX in the left striatum resulted from subacute effects rather than chronic long-term adaptations, we tested the association between GLX concentration and days since last MDMA use occasion (range 5–107 days) within the user group. However, no relation was observed (r[34] = −0.02, P = .97). Furthermore, among MDMA users, no association between GLX concentration and MDMA use frequency was observed in the left striatum (r[34] = 0.12, P = .57), nor in the ACC (r[20] = −0.15, P = .44). Complete standard and robust linear regression outcomes for the left striatum and ACC are listed in supplementary Tables 2–5.
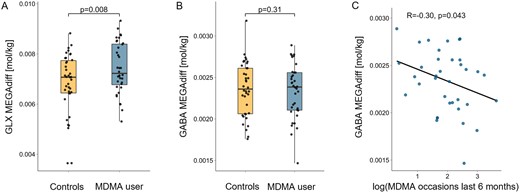
The effects of MDMA use on glutamate-glutamine (GLX) and GABA in the left striatum. (A) Chronic MDMA users displayed increased GLX concentrations quantified via MEGA-PRESS difference spectra (MEGAdiff) in the left striatum. The P value reflects the estimated group difference using linear regression on z-scored GLX concentrations including covariates for age, sex and co-use of other substances. Due to outlier data points, this effect was confirmed by robust regression. (B) No group difference was found regarding GABA concentration in the left striatum. (C) However, a significant negative correlation between MDMA use intensity (number of use occasions within 6 months prior to study) and GABA concentration in the left striatum was observed within MDMA users. The correlation coefficient reflects a robust correlation estimate.
In an exploratory follow-up analysis, to potentially disentangle effects of MDMA use on either glutamate or glutamine in the striatum, linear regression models including the same covariates as above were computed for the two metabolites separately. In the left striatum, glutamate but not glutamine concentrations were elevated in MDMA users (glutamate: β = .61, t[67] = 2.28, P = .026, Cohen d = 0.57; glutamine: β = .30, t[67] = 1.14, P = .26, Cohen d = 0.06; see supplementary Table 6 for complete regression outcomes).
MDMA Use and GABA Levels
GABA levels in MDMA users did not differ from healthy controls in the left striatum (β = −.28, t[67] = −1.02, P = .31; Cohen = 0.08; Figure 2B) and ACC (β = −.14, t[54] = −0.43, P = .67; Cohen d = 0.05). However, among MDMA users, a significant negative correlation between GABA concentration in the left striatum and MDMA use intensity (number of occasions within 6 months prior to testing) was observed (r[34] = −0.30, P = .043, Figure 2C), but no association was found with the number of days since last use occasion (r[34] = −0.09, P = .58).
Quality Characteristics of MRS Measurements
Quality metrics of MRS acquisition as well as analyzed and excluded participants per sequence, region, and group are listed in Table 2. PRESS displayed higher SNR and lower coefficient of variation than both MEGAdiff and MEGAoff. The higher SNR for short-TE PRESS compared with the MEGAoff spectrum was expected due to the higher number of acquisitions contributing to the spectrum, as well as the smaller T2 relaxation attenuation.
MRS Quality Metrics per Sequence, Region, and Participant Group
| PRESS | MEGAdiff | MEGAoff | |||||
|---|---|---|---|---|---|---|---|
| HC | MDMA | HC | MDMA | HC | MDMA | ||
| L Striatum | n analyzed (n excluded) | 34 (8) | 35 (9) | 38 (4) | 36 (8) | 38 (4) | 37 (7) |
| FWHM (Hz)a | 11.02 (1.52) | 10.48 (1.43) | — | — | — | — | |
| SNR | 43.97 (4.52) | 44.49 (4.43) | 16.16 (3.1) | 16.83 (3.53) | 22.37 (4.47) | 23.57 (4.6) | |
| CoVGLX | 0.09 | 0.08 | 0.18 | 0.14 | 0.21 | 0.26 | |
| CoVGABA | — | — | 0.14 | 0.14 | — | — | |
| CRLBGLX | 3 (2-4) | 3 (2-4) | 4.5 (3-10) | 4 (3-9) | 12 (7-35) | 10 (5-25) | |
| CRLBGABA | — | — | 6 (5-8) | 6 (5-9) | — | — | |
| ACC | n analyzed (n excluded) | 39 (3) | 42 (2) | 30 (12) | 31 (13) | 30 (12) | 33 (11) |
| FWHM (Hz)a | 6.58 (0.43) | 6.75 (0.46) | — | — | — | — | |
| SNR | 45.85 (2.58) | 45.74 (3.17) | 26.77 (5.4) | 25.26 (3.79) | 34.2 (4.76) | 31.79 (5.12) | |
| CoVGLX | 0.06 | 0.06 | 0.08 | 0.08 | 0.08 | 0.10 | |
| CoVGABA | — | — | 0.18 | 0.14 | — | — | |
| CRLBGLX | 3 (2-3) | 3 (2-3) | 3 (2-5) | 3 (3-5) | 5 (3-10) | 6 (4-9) | |
| CRLBGABA | — | — | 7 (5-11) | 7 (6-9) | — | — | |
Abbreviations: ACC, anterior cingulate cortex; CoV, coefficient of variation, CRLB, Cramér-Rao lower bound computed by LCModel; FWHM, full width at half maximum estimated by LCModel; GABA, γ-aminobutyric acid; GLX, glutamate-glutamine complex; HC, healthy control group; L Striatum, left striatum; DMA, MDMA user group; MEGAdiff, quantified from MEGA-PRESS difference spectra; MEGAoff, quantified from MEGA-PRESS OFF subresonance spectra; SNR, signal-to-noise ratio.
Values reflect mean and if applicable SD, except CRLB is reported as median and range.
aFWHM was assessed based on the water scan of the PRESS sequence.
Comparison of GLX Quantification From PRESS and MEGA-PRESS
In the ACC, a robust correlation was observed between GLX from PRESS and MEGAdiff (r[57] = 0.51, P < .0001; Figure 3D) as well as MEGAoff (r[59] = 0.43, P < .0001; Figure 3E). In contrast, the concordance between PRESS and MEGA-PRESS regarding GLX quantification in the left striatum was poor. No correlation between PRESS and either MEGAdiff (r[62] = 0.05, P = .70; Figure 3A) or MEGAoff (r[63] = −0.14, P = .15; Figure 3B) was observed in the left striatum for GLX. On the other hand, the consistency between GLX from MEGAdiff and MEGAoff was high and better than the agreement between PRESS and MEGA-PRESS in both regions (left striatum: r[72] = 0.63, P < .0001, Figure 3C; ACC: (r[72] = 0.55, P < .0001, Figure 3F).
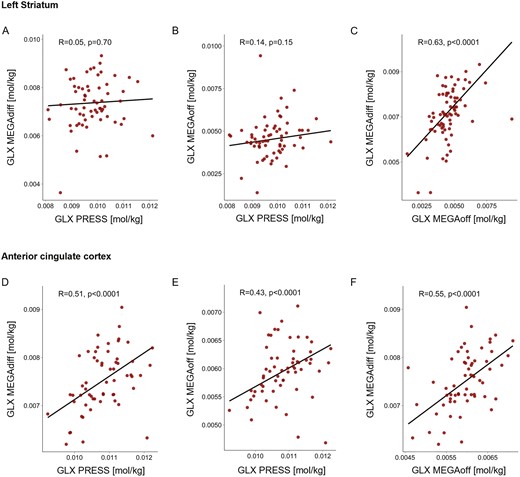
Correlation of glutamate-glutamine (GLX) concentration between PRESS, MEGA-PRESS difference spectra (MEGAdiff), and OFF subresonance spectra (MEGAoff) in the left striatum and anterior cingulate cortex (ACC). Left striatum: No correlation was observed regarding GLX concentration between PRESS and either (A) MEGAdiff or (B) MEGAoff. ACC: GLX concentration from PRESS and (C) MEGAdiff as well as (D) MEGAoff displayed moderate but highly significant correlations. Between MEGAdiff and MEGAoff, in both the left striatum (C) as well as ACC (F), a moderate but strongly significant correlation was observed for GLX. All correlation coefficients reflect robust correlation estimates.
Because the concordance of PRESS and MEGA-PRESS was poor in the striatum, we performed several quality control assessments to confirm which sequence provided more accurate GLX measurements in this study: (1) to test whether the discrepancy was related to interfering macromolecule signals (e.g., proteins and polypeptides), the agreement between sequences for a metabolite that is strongly confounded by macromolecules and one that is only weakly confounded was evaluated; (2) the LCModel baseline estimation was qualitatively compared between sequences; (3) signal artefacts and the resulting exclusion of participants were qualitatively assessed for each sequence; (4) difference between sequences parameters (i.e., echo time [TE]) and its relation to suppression of confounding signal were considered.
Whereas NAA+NAAG overlaps with the resonance of macromolecules, creatine/phosphocreatine (Cre+PCre) is only weakly affected by interfering macromolecule signal (Cudalbu et al., 2021). The concordance between PRESS and MEGA-PRESS in the striatum was high for Cre+PCre (r[72] = 0.51, P < .0001) but low for NAA+NAAG (r[59] = 0.28, P = .018). In the ACC, the correlation was robust for both Cre+PCre (r[72] = 0.75, P < .0001) and NAA+NAAG (r[59] = 0.54, P < .0001; see supplementary Figure 1).
The LCModel baseline estimation showed lower baseline amplitudes in the striatum in the MEGAoff with its longer echo time than in the PRESS (see exemplary spectra in Figure 1).
This was also reflected in the decreased number of participants excluded due to signal artefacts in MEGA-PRESS as opposed to PRESS in the striatum (see Table 2).
Because the interfering macromolecule signal is better attenuated in the MEGA-PRESS (due to its longer TE), the discrepancy between MEGA-PRESS and PRESS in the striatum appears to be due to a misestimated macromolecule contribution in (the short TE) PRESS. This is supported by the high agreement between MEGAdiff and MEGAoff, with the latter being similar to the PRESS acquisition, except for the longer TE. Overall, these results are consistent with a recent study showing that different modeling approaches yield diverging results when an underlying macromolecular signal is present (Zöllner et al., 2021). Taken together, MEGA-PRESS provided more robust and reliable results in the striatum and, thus, only GLX results from MEGAdiff were reported above. However, complete outcomes of both sequences are reported in the Supplement Tables 2–4.
DISCUSSION
Chronic MDMA users showed elevated GLX levels, relative to MDMA-naïve controls, in the left striatum but not the ACC. Moreover, although no GABA-related group differences were observed in both investigated regions, higher MDMA use frequency was associated with lower GABA concentrations in the left striatum. However, this finding should be interpreted with caution in the absence of a significant group difference. The observed elevated GLX levels in the striatum of MDMA users challenge the selectivity of MDMA-induced long-term adaptations in neurotransmitter systems, which have previously been exclusively attributed to the 5-HT system. Furthermore, our results may indicate that the alterations in GLX reflect long-term neuroplastic adaptations rather than subacute effects of MDMA use, given the absence of a relation between GLX concentration and the abstinence duration of MDMA use (range, 5–107 days), although this hypothesis cannot be entirely confirmed in an observational study. The interpretation of GLX in terms of neurotransmitter alterations is complicated because the glutamate–glutamine cycle is tightly linked to the energy metabolism of the brain (Massucci et al., 2013). However, our exploratory follow-up analysis suggested that the increase in GLX is due to glutamate rather than glutamine, and accordingly, MDMA use may actually affect glutamate at the neurotransmitter level.
The increased GLX concentration in the MDMA user group might be related to MDMA-induced alterations in the 5-HT system, although a relationship between GLX levels and intensity of MDMA use was absent. The serotonergic projections from the raphe nuclei to the striatum, together with the nigrostriatal dopaminergic and corticostriatal glutamatergic projections, form the main afferents of the striatum (Guerra et al., 1998). The striatum consists mainly of GABAergic neurons (Kreitzer, 2009), and, accordingly, striatal glutamate release derives only from afferent projections of the cortex, thalamus, and hippocampus (Pittenger et al., 2011). The effect of 5-HT in the striatum is mainly inhibitory (Miguelez et al., 2014), and, hence, the chronic 5-HT depletion in regular MDMA users (Kish et al., 2000) might reduce the inhibitory control of 5-HT on the striatum. This hypothesis is supported by findings in rats that after repeated MDMA administration, the inhibitory effect of 5-HT on glutamate release in the ventral striatum is attenuated (Obradovic et al., 1998). Accordingly, glutamate might be released more strongly and facilitate long-term potentiation at glutamatergic synapses in the striatum. This could explain the observed elevated GLX levels in MDMA users, as a sustained increase in extracellular glutamate was observed after long-term potentiation at glutamatergic synapses in rats (Richter-Levin et al., 1995). In addition, increased expression of glutamate receptor genes in the striatum was observed in rats after repeated MDMA administration (Kindlundh-Högberg et al., 2008), which also supports a possible long-term potentiation at glutamatergic synapses.
The elevated GLX levels in the striatum of chronic MDMA users observed in this study are in conflict with Liu et al. (2011), who reported no effect of MDMA use on GLX in the striatum. However, they solely used the PRESS sequence to quantify GLX in the striatum, which we have shown in this study may be more strongly distorted by confounding signal, especially in structures near large ventricles. Moreover, the MDMA users in their study were substantially less severe users than in our study and also displayed a longer abstinence period (use in their study = 3.6 years; in our sample = 9.1 years; lifetime use = 158.1 to 604.2 tablets, abstinence duration = 4.95 months to 21 days). On the other hand, the lack of an effect in the ACC in our study is consistent with the observations from Chang et al. (1999) and Liu et al. (2011) of no difference regarding GLX levels in the midfrontal cortex of MDMA users. The reported evidence here for altered GLX levels in MDMA users as well as the additional weak evidence for affected GABA concentrations in the left striatum might provide novel explanations for cognitive deficits commonly reported in MDMA users. Thus, our study raises the possibility that 5-HT adaptations may not solely be responsible for the impulse control deficits commonly observed in chronic MDMA users, as previously assumed (Morgan et al., 2006; Quednow et al., 2007; Hanson et al., 2008), but that long-term alterations of GLX and GABA levels may also play an important role. The increased striatal GLX levels in MDMA users might point to an imbalance in the fronto-striatal pathways commonly associated with impulsive behavior (Dalley and Robbins, 2017). It has been shown that increased striatal glutamate levels are associated with elevated dopamine concentrations and might enhance dopamine release (Rogeau et al., 2022). Moreover, previous studies proposed that highly impulsive individuals exhibit potentiated striatal dopamine release in response to novel, salient, or rewarding stimuli (Buckholtz et al., 2010). According to these results, we speculate that elevated GLX levels in MDMA users might promote increased salience-related striatal dopamine release and thus enhance impulsive behavior. This hypothesis would also match previous neurobiological models of compulsory substance use suggesting dopamine-dependent excessive attribution of salience to drug-related cues and inadequate inhibitory control over these reinforcing circuits (Goldstein and Volkow, 2002; Kozak et al., 2019). We did not, however, observe a clear association of the GLX concentration in the striatum and the intensity of MDMA use. Thus, it could be argued that elevated GLX levels in the striatum might rather reflect a general feature of, or even a risk factor for, substance use. However, this is rather unlikely given that studies on stimulant users have reported the opposite, that is, reduced glutamate levels in the nucleus accumbens (Engeli et al., 2021). Moreover, higher cocaine use was associated with lower glutamine levels in the pregenual anterior cingulate cortex (Hulka et al., 2016).
In our study, MEGA-PRESS provided more reliable GLX quantifications in the striatum than PRESS, while in the ACC outcomes of both sequences were comparable. In contrast, the agreement between MEGAdiff and MEGAoff was strong in both regions. The diverging GLX results for PRESS and MEGA-PRESS observed here are in line with previous studies (van Veenendaal et al., 2018; Bell et al., 2021), and findings collectively indicate that the comparability of PRESS and MEGA-PRESS may be region specific and dependent on measurement quality. Accordingly, regions with inherently lower measurement quality (e.g., structures near large ventricles such as the striatum) may benefit from the longer TE of the MEGA-PRESS. A longer TE may reduce the susceptibility to confounding signals, because lipids and macromolecules contribute less to the spectra at longer TEs due to their short relaxation time (Behar et al., 1994) and may decrease baseline distortions during acquisition. Moreover, it has been shown that the choice of macromolecular and baseline modeling substantially influences the quantification of metabolite resonances, suggesting that their successful separation with linear-combination modeling algorithms remains an unresolved issue (Zöllner et al., 2021). We encourage future clinical studies applying both sequences to report the agreement between them to improve our understanding of the diverging results, which is critical for the advancement of clinical MRS studies.
Our results are limited by the fact that glutamate represents a precursor for the synthesis of GABA, making it difficult to fully decipher the interpretation of the measured GLX concentration in terms of glutamate or GABA. Another potential limitation is that only one side of the striatum was measured; however, we did not expect any lateralization effects. Furthermore, this study has not been pre-registered. Nevertheless, we are confident that the transparent reporting in this manuscript and making data as well as analysis code publicly available ensure the credibility of our results. However, the sample size analyzed in this study allowed detection of only moderate to large effect sizes (Cohen d > 0.58) at 80% power, and the lack of significant group differences in the ACC as well as GABA in the striatum may be due to a lack of sufficient statistical power, considering that metabolites such as GLX and GABA provide rather low SNR in MRS measurements (Wijtenburg et al., 2019).
In conclusion, we have provided evidence that MDMA use not only affects the 5-HT system, as previously thought, but is in addition associated with long-term alterations in striatal GLX levels. Moreover, we have shown that that GABA concentration in the striatum is related to MDMA use intensity. These adaptations appear to be region specific, as an effect was only observed in the left striatum but not in the ACC. Future studies should address the functional consequences of these striatal adaptations, in particular their potential relation to impulsivity and cognitive control.
Acknowledgments
We thank Samia Borra, Mariana Carrillo Vázquez, Selina Caviezel, Marco Guglielmo, Xenia Häfeli, Mauro Mey, Anna-Katharina Schmid, and Babette Winter for assistance with recruitment and data acquisition.
This work was supported by Swiss National Science Foundation grant 320030L_179450 to B.B.Q. and German Research Foundation grant BE 4045/34-1 to C.B.
Interest Statement
E.S. has received speaker and consulting honoraria’s from Lundbeck Switzerland, Lundbeck Denmark, Janssen Switzerland, OM Pharma Switzerland, Recordati Switzerland, Otsuka Switzerland, Mepha Pharma Switzerland, Schwabe Pharma Switzerland, Schwabe Pharma Germany, and financial support from the Swiss National Science Foundation and University of Zürich.
Data Availability
Data and code used for statistical analysis can be accessed at https://github.com/jziNeuro/MRS_MDMA_publication.
