


Abstract
An imbalance in the inflammatory tumor necrosis factor system, including soluble tumor necrosis factor receptor 2 (sTNFR2), may contribute to the pathophysiology of schizophrenia.
We measured the plasma levels of sTNFR2 in 256 healthy controls and 250 patients with schizophrenia including antipsychotic drug-free patients and treatment-resistant patients. We also explored the possible association between plasma sTNFR2 levels and cognitive performance in healthy controls and patients with schizophrenia using the Wechsler Adult Intelligence Scale, Third Edition, the Wechsler Memory Scale-Revised, and the Rey Auditory Verbal Learning Test. An association between plasma sTNFR2 levels and hippocampal volume in controls and patients with schizophrenia was also investigated via MRI.
We found that the plasma levels of sTNFR2 were significantly higher in patients with schizophrenia, including both antipsychotic drug-free patients and treatment-resistant patients. We found a significant negative association between plasma sTNFR2 levels and cognitive performance in controls and patients with schizophrenia. Hippocampal volume was also negatively associated with plasma sTNFR2 levels in patients with schizophrenia.
Together, these convergent data suggest a possible biological mechanism for schizophrenia, whereby increased sTNFR2 levels are associated with a smaller hippocampal volume and cognitive impairment.
The tumor necrosis factor (TNF) system, including soluble tumor necrosis factor receptor 2 (sTNFR2), might be involved in the pathophysiology of schizophrenia. We found that the plasma levels of sTNFR2 were significantly higher in patients with schizophrenia, including antipsychotic drug-free patients. As far as we know, this is the first study to demonstrate that plasma sTNFR2 levels are significantly increased in antipsychotic drugs-free patients with schizophrenia. sTNFR2 are reported to negatively affect both hippocampal structure and cognitive functioning. However, the correlations between sTNFR2 levels and hippocampal structure and cognitive functioning have not been thoroughly investigated in patients with schizophrenia. We found a significant negative association between plasma sTNFR2 levels and cognitive performance in controls and patients with schizophrenia. Hippocampal volume was also negatively associated with plasma sTNFR2 levels in patients with schizophrenia.
Introduction
Increasing evidence has indicated that inflammation may play a critical role in the pathophysiology of schizophrenia (Monji et al., 2009; Dean et al., 2013; Na et al., 2014; Hung et al., 2017). Tumor necrosis factor-α (TNF-α) is a proinflammatory cytokine involved in the innate immune response. TNF-α and the downstream TNF-α signaling pathways of 2 distinct membrane-bound receptors, soluble tumor necrosis factor receptor 1 (sTNFR1) and soluble tumor necrosis factor receptor 2 (sTNFR2), play critical roles in brain function, including neurotransmission, synapse formation, and neurogenesis (McCoy and Tansey, 2008). sTNFR1 and sTNFR2 are differentially expressed and controlled; sTNFR1 is historically thought to promote apoptosis and cytotoxicity, while cell survival, proliferation, and protective cellular responses induced by TNF-α are attributed primarily to sTNFR2 (Montgomery and Bowers, 2012). Depletion of sTNFR2, but not sTNFR1, has been reported to lead to hippocampal neuron death through different signal transduction pathways than those of sTNFR1 (Yang et al., 2002), suggesting that sTNFR2 plays protective roles in hippocampal neurons. Protective roles of sTNFR2 signaling were also reported in individuals with neurodegenerative disorders, including Alzheimer’s disease (Shen et al., 1997). Several studies have demonstrated that patients with schizophrenia have increased peripheral levels of sTNFR2 (Coelho et al., 2008; Noto et al., 2013; Hoseth et al., 2017). We also previously reported that patients with schizophrenia have increased levels of plasma sTNFR2 (Yamamori et al., 2016). Together, these findings indicate that sTNFR2 might be involved in the pathophysiology of schizophrenia.
Many studies have reported that patients with schizophrenia demonstrate smaller hippocampal volumes (Okada et al., 2016) and cognitive decline (Hashimoto et al., 2013; Fujino et al., 2014, 2016; Ohi et al., 2015) than those without. Elevated peripheral proinflammatory cytokines are reported to negatively affect both hippocampal structure and cognitive functioning. Higher peripheral sTNFR2 levels were also reported to be associated with smaller hippocampal volume in a community sample (Schmidt et al., 2016), as well as with poorer cognitive test scores in a community-living aged population (Gao et al., 2016), in Parkinson’s disease patients (Rocha et al., 2014), and in mood disorder patients (Doganavsargil-Baysal et al., 2013; Bobińska et al., 2017). However, the correlations between peripheral sTNFR2 levels and hippocampal structure and cognitive functioning have not been thoroughly investigated in patients with schizophrenia.
We hypothesized that sTNFR2 are elevated as compensatory response to proinflammatory imbalance in the TNF system and play protective roles to prevent hippocampal volume loss in schizophrenia. The aim of this study was to investigate the plasma levels of sTNFR2 in patients with schizophrenia in a large Japanese cohort that included antipsychotic drug-free patients and treatment-resistant patients. We further investigated the possible association between plasma levels of sTNFR2 and hippocampal volume and cognitive functioning in patients with schizophrenia.
Methods
Subjects
A total of 250 patients with schizophrenia and 256 healthy controls were included in this study. The patients and healthy controls were age and gender matched (Table 1). Blood samples were collected, and plasma was used for the analysis. Most cases were recruited at the Osaka University Hospital. One set of Osaka samples of 40 patients with schizophrenia and 40 healthy controls are the same samples used in the previous study that showed a significant increase of plasma sTNFR2 in patients with schizophrenia (Yamamori et al., 2016). In all, 80 patients with schizophrenia and 80 healthy controls were recruited at Chiba University Hospital and Tokushima University Hospital. Each subject had been diagnosed and assessed by at least 2 trained psychiatrists according to the Diagnostic and Statistical Manual of Mental Disorders, Fourth Edition (DSM-IV), criteria based on a structured clinical interview for DSM-IV axis I disorders (SCID-I). Symptoms of schizophrenia were assessed with the Positive and Negative Syndrome Scale (PANSS). The total of prescribed antipsychotics was calculated using chlorpromazine (CPZ) equivalents (mg/d) (Inada and Inagaki, 2015). Patients with comorbidities of substance-related disorders or mental retardation were excluded. The “drug-free” patients took no antipsychotics for over 1 week. “Treatment-resistant” was defined according to the following criteria mentioned in CPZ drug information in JAPAN: (1) non- or little response to treatment from at least 2 adequately dosed antipsychotic trials for at least 4 weeks (including at least 1 second-generation antipsychotic, >600 mg/d of CPZ equivalent) and patients never had the Global Assessment of Functioning scores >40. (2) Intolerance to at least 2 second-generation antipsychotics because of uncontrolled extrapyramidal symptoms. All subjects included in this study met the criteria of non- or little response. Controls were recruited through local advertisements. Psychiatrically, medically, and neurologically healthy controls were evaluated via the DSM-IV structured clinical interview, nonpatient version that included the interview whether the subject has physical problems. Subjects were excluded if they had neurological or medical conditions that could potentially affect the central nervous system, such as an atypical headache, head trauma with loss of consciousness, chronic lung disease, kidney disease, chronic hepatic disease, thyroid disease, active stage cancer, cerebrovascular disease, epilepsy, or seizures. Neurological and medical conditions were assessed mainly by interview. In the case of patients, blood tests were also conducted to confirm medical conditions. Written informed consent was obtained from all subjects after the procedures had been fully explained. This study was conducted in accordance with the World Medical Association’s Declaration of Helsinki and was approved by the Research Ethical Committee of Osaka University, Chiba University and Tokushima University.
Demographic Variables of Subjects
| Variables | Osaka-1 | Osaka-2 | Osaka-3 | Drug Free | Treatment-Resistant SCZ | Tokushima | Chiba | Total | ||||||||
|---|---|---|---|---|---|---|---|---|---|---|---|---|---|---|---|---|
| HC | SCZ | HC | SCZ | HC | SCZ | HC | SCZ | HC | SCZ | HC | SCZ | HC | SCZ | HC | SCZ | |
| n=35 | n=32 | n=40 | n=39 | n=40 | n=40 | n=39 | n=37 | n=22 | n=22 | n=40 | n=40 | n=40 | n=40 | n=256 | n=250 | |
| Age (y) | 54.5±5.9 | 57.3±11.9 | 37.8±12.2 | 38±12.3 | 42.3±12.2 | 41.4±11.8 | 35±12 | 35.5±13.1 | 38.1±12.9 | 39.1±13.3 | 52±7.2 | 55.2±6.1 | 32.4±6.2 | 31.9±5.7 | 41.8±12.7 | 42.5±14 |
| Gender (male/ female) | 15/20 | 11/21 | 20/20 | 20/19 | 20/20 | 20/20 | 23/16 | 23/14 | 12/10 | 12/10 | 20/20 | 20/20 | 20/20 | 20/20 | 130/126 | 126/124 |
| Age of onset | 36.1±15.2 | 26.6±11.1 | N/A | 26.6±11.8 | 21.8±8.4 | N/A | 24.8±5.1 | 27.1±11.4 | ||||||||
| Duration of illness | 20.5±15.1 | 11.4±9.9 | N/A | 9.5±7.4 | 17.3±11.2 | N/A | 7.1±4.3 | 12.3±10.8 | ||||||||
| CPZ dose (mg) | 608.8±505.4 | 562.6±398.3 | N/A | 0 | 993.2±236.2 | N/A | N/A | 680.4±442 | ||||||||
| PANSS positive | 18.4±7.3 | 17.1±5.6 | N/A | 20.1±6.5 | 23±4.4 | N/A | N/A | 19.3±6.4 | ||||||||
| PANSS negative | 17.5±7.4 | 19.6±5.6 | N/A | 18.4±6.8 | 25.3±5.5 | N/A | N/A | 19.8±6.8 | ||||||||
| PANSS general | 36.8±12.7 | 42.2±13.1 | N/A | 41.4±14.6 | 53.8±9.3 | N/A | N/A | 42.8±13.8 | ||||||||
| PANSS total | 72.7±25.5 | 79±23.1 | N/A | 79.9±25.8 | 102.1±17.9 | N/A | N/A | 81.9±25.3 | ||||||||
Abbreviations: CPZ, chlorpromadine; HC, healthy control; NA, not available; PANSS, Positive and Negative Syndrome Scale; SCZ, schizophrenia.
The mean±SD is shown.
Determination of Plasma sTNFR2 Levels
Plasma levels of sTNFR2 were determined with Quantikine human ELISA kits from R&D Systems. According to the manufacturer’s instructions in the ELISA kits, the intra-assay and inter-assay CVs for the sTNFR2 ELISAs, as measured in 20 plasma samples, averaged 3.5% and 4.1%, respectively. The minimum detectable dose of human sTNF2 was 0.6 pg/mL, and all values obtained from our plasma samples were above the minimum detectable dose. All plasma samples were sent to Chiba University, and the plasma levels of sTNFR2 were measured in Chiba University.
Imaging Processing
All MRI data were sent to National Institute for Physiological Sciences, and FreeSurfer analysis was done in National Institute for Physiological Sciences. Among the subjects, 167 healthy subjects and 94 patients with schizophrenia underwent MRI. MRI data were obtained using one of the following 3 scanners: (1) 1.5T GE Signa EXCITE system; (2) 3.0T GE Signa HDxt; (3) 3.0T GE MR750. A 3-dimensional volumetric acquisition of a T1-weighted gradient echo sequence produced a gapless series of sagittal sections using a spoiled gradient-recalled acquisition in the steady-state sequence. The sequence parameters for each scanner were as follows: (1) 1.5T GE Signa EXCITE: number of slices, 124; TE/TR, 4.2/12.6 ms; flip angle, 15°; acquisition matrix, 256×256; 1NEX, FOV, 24×24 cm; and slice thickness, 1.4 mm; (2) 3.0T GE Signa HDxt: number of slices, 172; TE/TR, 2.9/7.2 ms; flip angle, 11°; acquisition matrix, 256×256; 1NEX, FOV, 24×24 cm; and slice thickness, 1 mm; and (3) 3.0T GE MR 750: number of slices, 156; TE/TR, 3.1/8.2 ms; flip angle, 11°; acquisition matrix, 256×256; 1NEX, FOV, 24×24 cm; and slice thickness, 1.2 mm. Original T1-weighted images were checked by visual inspection. We excluded images with insufficient brain coverage (field-of-view problem), those with low signal-to-noise ratios or any artifacts (e.g., motion artifacts and magnetic susceptibility artifacts), and those with any abnormal organic findings (e.g., large cerebellar cysts and cavum septum pellucidum).
T1-weighted imaging data of 153 healthy subjects and 82 patients with schizophrenia were processed with FreeSurfer 5.3 software (http://surfer.nmr.mgh.harvard.edu), as described previously (van Erp et al., 2016). Through this procedure, we obtained images of subcortical segmentation and regional volumes (for the bilateral lateral ventricles, thalamus, caudate, putamen, globus pallidus, hippocampus, amygdala, accumbens, and the ICV), and left hippocampal volume data were used to assess the reproducibility of the association with plasma levels of sTNFR2.
Assessment of Cognitive Functions
Cognitive function was assessed with the Wechsler Adult Intelligence Scale, Third Edition (WAIS-III) (Wechsler, 1997; Committee, 2006), the Wechsler Memory Scale-Revised (WMS-R) (Wechsler, 1987), and the Rey Auditory Verbal Learning Test (AVLT). The numbers of subjects who underwent testing with the WAIS-III, WMS-R, and AVLT are shown in Table 3.
Statistical Analysis
The statistical analysis was performed with SPSS 20.0 software for Windows (SPSS Japan Inc). Variables were expressed as the mean±SD. Data normality was assessed via Kolmogorov-Smirnov and Shapiro-Wilk tests, and the plasma sTNFR2 levels did not show a Gaussian distribution. Differences in clinical characteristics between patients and controls were analyzed using χ2 tests for categorical variables and the Mann–Whitney U-test for continuous variables. The groups did not differ with respect to age or gender (P>.05). Differences in the plasma levels of sTNFR2, cognitive and memory functions, and hippocampal volume between the patients and controls were analyzed via the Mann-Whitney U-test. Correlations were examined with Spearman’s rank correlation. Potential confounders of plasma sTNFR2 (age, sex, smoking status) were investigated with nonparametric tests (Mann-Whitney U-test and Spearman’s rank correlation), and the P values of these confounders were <.05. These confounders were controlled using partial correlations. In the analysis of patients with schizophrenia, CPZ dose was also controlled. The Bonferroni correction was used for multiple comparison corrections. Differences were considered statistically significant for P <.05.
The MR images were processed with SPM12 (Wellcome Department of imaging Neuroscience, University College London, UK, http://www.fil.ion.ucl.ac.uk/spm) in MATLAB R2015b (The Mathworks, Natick, MA, USA) for tissue segmentation and anatomical normalization using the diffeomorphic anatomical registration through an exponentiated lie algebra (DARTEL) algorithm. Custom DARTEL templates were generated from all participants’ gray matter and white matter images. After spatial normalization, the gray matter images were modulated to preserve the volume, followed by smoothing with an 8-mm full width at half maximum Gaussian kernel. For this preprocessing, default parameters were used. In addition, the total intracranial volume was calculated by summing up the gray matter volume, white matter volume, and cerebrospinal fluid volume using the “Tissue Volumes” function of SPM12. To account for several covariates, we used a multiple regression model and explored the correlation between the serum level of sTNFR and gray matter volume, treating age, gender, and total intracranial volume as confounding covariates. Since we used images from multiple scanners, scanner site was modeled as a factor as previous studies employed (Stonnington et al., 2008). However, since we were interested in the correlation between sTNFR2 and grey matter, we modified the design matrix so that we could explore the correlation accounting for the scanner difference (supplementary Figure 1). Detail is explained in the supplementary Information. Beside whole brain analysis, we performed small volume correction, since we were interested in cognitive function, especially memory. For this analysis, we generated a mask of bilateral hippocampi using the Neuromorphometrics atlas implemented in SPM12. The significance threshold was also set to family-wise error corrected P value<.05. At the same time, we extracted the volume of whole right and left hippocampus using “get_totals” script by Ged Ridgway (http://www0.cs.ucl.ac.uk/staff/g.ridgway/vbm/get_totals.m_x0001). We employed the Neuromorphometric atlas implemented in SPM12 to define both left and right hippocampus.
Results
Plasma Levels of sTNFR2
The plasma levels of sTNFR2 were compared between the schizophrenia patient group (total n=250) and the control group (total n=256). Seven sets of samples were investigated, including 3 sets of samples from Osaka, 2 sets of samples from Tokushima and Chiba, 1 set of antipsychotic drug-free patient samples from Osaka, and 1 set of treatment-resistant schizophrenia samples from Osaka (Table 1). All sample sets were age and gender matched. In all sets of samples, the plasma levels of sTNFR2 were significantly higher in patients than in controls (Figure 1; Table 2, Mann-Whitney U-test; z=-8.21, P=2.3×10⁻¹⁶).

The plasma levels of sTNFR2 were measured in healthy controls (HC) (n=256) and schizophrenia (SCZ) patients (n=250). The bars represent mean values±SD. ***P<.001 by Mann-Whitney U-test.
sTNFR2 Expression in Plasma
| Variables | Osaka-1 (35vs32) | Osaka-2 (40vs39) | Osaka-3 (40vs40) | Drug free (39vs37) | Treatment resistant SCZ (22vs22) | Tokushima (40vs40) | Chiba (40vs40) | Total (256vs250) |
|---|---|---|---|---|---|---|---|---|
| HC (ng/mL) | 1.88±0.44 | 1.68±0.42 | 1.81±0.37 | 1.93±0.45 | 2.01±0.66 | 2.50±0.64 | 1.98±0.44 | 1.97±0.54 |
| SCZ (ng/mL) | 2.65±0.89 | 1.96±0.54 | 2.46±0.68 | 2.28±0.66 | 2.99±0.94 | 3.57±1.25 | 2.27±0.60 | 2.57±0.96 |
| P value | 1.9×10⁻⁴*** | .014* | 5.1×10⁻⁷*** | .017* | 4.7×10⁻⁴*** | 2.5×10⁻⁶*** | .019* | 2.3×10⁻¹⁶*** |
| Effect size | 1.70 | 0.73 | 1.29 | 1.07 | 2.11 | 2.68 | 0.94 | 1.68 |
Abbreviations: HC, healthy control; SCZ, schizophrenia.
*P<.05, **P<.01, ***P<.005.
The mean±SD is shown.
sTNFR2 and Cognitive and Memory Function
Cognitive function was investigated using the WAIS-III, and memory function was investigated using the WMS-R and AVLT. Cognitive and memory functions were compared between the schizophrenia patient group and the control group. Data of cognitive and memory functions were available in 3 sets of samples from Osaka, 1 set of antipsychotic drug-free patient samples from Osaka, and 1 set of treatment-resistant schizophrenia samples from Osaka. In all categories of cognitive and memory functions, scores were significantly lower in patients than in controls (supplementary Table 1b). When we see the difference in each drug-free, treatment-resistant, and remaining patients with schizophrenia (OSAKA 1–3), and healthy controls, significant decline in schizophrenia was observed in all sets of samples (supplementary Table 1a).
The relationship between plasma sTNFR2 levels and cognitive function was investigated via the WAIS-III. Plasma sTNFR2 levels were significantly and negatively correlated with the WAIS Verbal IQ (VIQ), Performance IQ (PIQ), Full-scale IQ (FIQ) (Fig. 2a), Picture Completion Block Design and Matrix Reasoning (PO), and Block Design and Matrix Reasoning (PS) in all samples (patients with schizophrenia and healthy controls) after Bonferroni correction (Table 3, VIQ; r=-0.19, P=2.4×10⁻³, corrected P=.031, PIQ; r=-0.21, P=8.1×10⁻⁴, corrected P=.011, FIQ; r=-0.22, P=3.5×10⁻⁴, corrected P=4.5×10⁻³, PO; r=-0.2, P=1.5×10⁻³, corrected P=.019, PS; r=-0.2, P=1.0×10⁻³, corrected P=.013). No significant correlation was observed when correlations between sTNFR2 levels and cognitive functions assessed via the WAIS-III were investigated in patients with schizophrenia or in healthy controls (Table 3). To exclude the effects of age, gender, and smoking status, we conducted a partial correlation analysis between the plasma sTNFR2 levels and cognitive function assessed via WAIS-III using age, gender, and smoking status as control variables. In patients with schizophrenia, CPZ dose was also controlled. Plasma sTNFR2 levels were significantly and negatively correlated with VIQ, PIQ, FIQ, and all 4 secondary indices of the WAIS-III (VC; Vocabulary, Similarities and Information, PO, WM; Arithmetic, Digit Span and Letter Number Sequencing, and PS) in all samples (patients with schizophrenia and healthy controls) as shown in supplementary Table 2. Then, we see the correlation in each drug-free, treatment-resistant, and remaining patients with schizophrenia (OSAKA 1–3) and healthy controls. Significant and negative correlation was observed between plasma sTNFR2 levels and FIQ in the remaining patients with schizophrenia and healthy controls (supplementary Table 3a, FIQ; r=-0.23, P=2.8×10⁻³, corrected P=.04) in all samples (patients with schizophrenia and healthy controls).
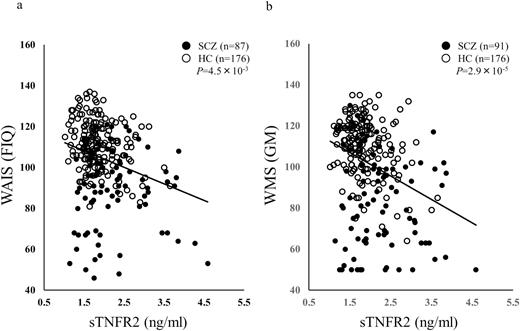
Correlation of WAIS Full-Scale IQ (FIQ) (a), WMS General Memory (GM) (b), and plasma levels of sTNFR2. sTNFR2 was negatively correlated with both FIQ and GM.
Correlation between Plasma sTNFR2 Levels and Cognitive Function
| Total | Schizophrenia | Healthy Control | ||||||||||||
|---|---|---|---|---|---|---|---|---|---|---|---|---|---|---|
| n | r | P | Corrected P value | n | r | P | Corrected P value | n | r | P | Corrected P value | |||
| IQ | WAIS | VIQ | 263 | -0.19 | 2.4×10⁻³** | .031* | 87 | 0.14 | n.s. | n.s. | 176 | -0.19 | .012* | n.s. |
| PIQ | 263 | -0.21 | 8.1×10⁻⁴*** | .011* | 87 | 0.04 | n.s. | n.s. | 176 | -0.13 | n.s. | n.s. | ||
| FIQ | 263 | -0.22 | 3.5×10⁻⁴*** | 4.5×10⁻³*** | 87 | 0.09 | n.s. | n.s. | 176 | -0.19 | .012* | n.s. | ||
| VC | 263 | -0.16 | .011* | n.s. | 87 | 0.16 | n.s. | n.s. | 176 | -0.19 | .014* | n.s. | ||
| PO | 263 | -0.2 | 1.5×10⁻³*** | .019* | 87 | 0.03 | n.s. | n.s. | 176 | -0.16 | .036* | n.s. | ||
| WM | 260 | -0.16 | 9.5×10⁻³** | n.s. | 84 | 0.08 | n.s. | n.s. | 176 | -0.15 | .049* | n.s. | ||
| PS | 260 | -0.2 | 1.0×10⁻³*** | .013* | 84 | 0.01 | n.s. | n.s. | 176 | -0.1 | n.s. | n.s. | ||
| Memory | WMS | VerM | 267 | -0.26 | 1.3×10⁻⁵*** | 1.7×10⁻⁴*** | 91 | -0.02 | n.s. | n.s. | 176 | -0.15 | .049* | n.s. |
| ViM | 267 | -0.22 | 2.2×10⁻⁴*** | 2.8×10⁻³*** | 91 | -0.13 | n.s. | n.s. | 176 | -0.13 | n.s. | n.s. | ||
| GM | 267 | -0.28 | 2.2×10⁻⁶*** | 2.9×10⁻⁵*** | 91 | -0.06 | n.s. | n.s. | 176 | -0.16 | .03* | n.s. | ||
| A/C | 267 | -0.15 | .018* | n.s. | 91 | 0.02 | n.s. | n.s. | 176 | -0.06 | n.s. | n.s. | ||
| DR | 267 | -0.26 | 2.2×10⁻⁵*** | 2.9×10⁻⁴*** | 91 | -0.11 | n.s. | n.s. | 176 | -0.11 | n.s. | n.s. | ||
| AVLT | total recall | 257 | -0.36 | 2.4×10⁻⁹*** | 3.2×10⁻⁸*** | 81 | -0.23 | .03* | n.s. | 176 | -0.32 | 1.2×10⁻⁵*** | 1.6×10⁻⁴*** | |
*P<.05, **P<.01, ***P<.005
Abbreviations: A/C, Attention and Concentration; DR, delayed recall; FIQ, Full-scale IQ; GM, General Memory; n.s., not significant; VIQ, Verbal IQ; PIQ, Performance IQ; PO, Picture Completion Block Design and Matrix Reasoning; PS, Block Design and Matrix Reasoning; VerM, Verbal Memory; ViM, Visual Memory; WM, Airthmetic, Digit Span and Letter Number Sequencing.
We also investigated the relationship between the plasma sTNFR2 levels and memory functions using the WMS-R and AVLT. Plasma sTNFR2 levels were significantly and negatively correlated with the WMS-R Verbal Memory (VerM), Visual Memory (ViM), and General Memory (GM) subscales (Figure 2b), as well as Delayed recall (DR) and total recall in the AVLT in all samples (patients with schizophrenia and healthy controls) after Bonferroni correction (Table 3; VerM; r=-0.26, P=1.3×10⁻⁵, corrected P=1.7×10⁻⁴, ViM; r=-0.22, P=2.2×10⁻⁴, corrected P=2.8×10⁻³, GM; r=-0.28, P=2.2×10⁻⁶, corrected P=2.9×10⁻⁵, DR; r=-0.26, P=2.2×10⁻⁵, corrected P=2.9×10⁻⁴, AVLT; r=-0.36, P=2.4×10⁻⁹, corrected P=3.2×10⁻⁸). No significant correlations were observed between sTNFR2 levels and memory function assessed via the WMS-R and AVLT in patients with schizophrenia. In healthy controls, plasma sTNFR2 levels were significantly and negatively correlated with total recall of the AVLT (Table 3; r=-0.32, P=1.2×10⁻⁵, corrected P=1.6×10⁻⁴). To exclude the effects of age, gender, and smoking status, we conducted a partial correlation analysis between the plasma sTNFR2 levels and memory functions assessed via the WMS-R and AVLT using age, gender, and smoking status as control variables. In patients with schizophrenia, CPZ dose was also controlled. Plasma sTNFR2 levels were significantly and negatively correlated with VerM, ViM, GM, A/C (Attention and Concentration), DR, and total recall in the AVLT in all samples (patients with schizophrenia and healthy controls) as shown in supplementary Table 2. Plasma sTNFR2 levels were significantly and negatively correlated with total recall in the AVLT only in healthy controls by partial correlation analysis using age, gender, and smoking status as control variables (supplementary Table 2). Then, we see the correlation in each drug-free, treatment-resistant, and remaining patients with schizophrenia (OSAKA 1–3) and healthy controls. Significant and negative correlation was observed between plasma sTNFR2 levels and VerM, ViM, GM, DR, and total recall in the AVLT in the remaining patients with schizophrenia and healthy controls (supplementary Table 3a, VerM; r=-0.27, P=2.8×10⁻⁴, corrected P=3.7×10⁻³, ViM; r=-0.24, P=1.3×10⁻³, corrected P=.02, GM; r=-0.31, P=3.2×10⁻⁵, corrected P=4.1×10⁻⁴, DR; r=-0.27, P=3.7×10⁻⁴, corrected P=4.8×10⁻³, AVLT; r=-0.42, P=1.9×10⁻⁸, corrected P=2.5×10⁻⁷).
sTNFR2 and Hippocampal Volume
Hippocampal volume was compared between the schizophrenia patient group and the control group. Left and right hippocampal volume was assessed by voxel-based morphometry (VBM) and FreeSurfer analysis. MRI data were available in 3 sets of samples from Osaka, 1 set of antipsychotic drug-free patient samples from Osaka, and 1 set of treatment-resistant schizophrenia samples from Osaka. Both left and right hippocampal volume were significantly smaller in patients than in controls (supplementary Table 4). When we see the difference in each drug-free, treatment-resistant, and remaining patients with schizophrenia and healthy controls, significant decrease of hippocampal volume in schizophrenia was observed in all sets of samples (supplementary Table 4).
Whole brain correlational analysis between sTNFR2 and grey matter volume by VBM analysis revealed no significant region. However, small volume correction revealed negative correlation between sTNFR2 and left hippocampus. (supplementary Figure 2, P=.031, family-wise error corrected for multiple comparison, k=28, x=-33, y=-26, z=-9). Since we found significant correlation between STNFR2 and a cluster in left hippocampus, we investigated the relationships between plasma sTMFR2 levels and left whole hippocampal volume. Plasma sTNFR2 levels were significantly and negatively correlated with left whole hippocampal volume (patients with schizophrenia and healthy controls) (Figure 3a, total; n=261, r=-0.14, P=.02). Anatomical atlases from which the signal was extracted are shown in Figure 3b. Plasma sTNFR2 levels remained significantly and negatively correlated with left hippocampal volume measured by VBM analysis only in patients with schizophrenia (SCZ; n=94, r=-0.22, P=.03). No significant correlation was observed between sTNFR2 levels and left hippocampal volume in healthy controls (HC; n=167, r=-0.04, P=.61). To exclude the effects of age, gender, and smoking status, we conducted a partial correlation analysis between the plasma sTNFR2 levels and left hippocampal volume using age, gender, and smoking status as control variables. In patients with schizophrenia, CPZ dose was also controlled. Plasma sTNFR2 levels were still found to be significantly and negatively correlated with hippocampal volume in all samples (patients with schizophrenia and healthy controls) and in patients with schizophrenia using a partial correlation analysis (total; n=239, r=-0.26, P=4.8×10⁻⁵, SCZ; n=71, r=-0.27, P=.02).
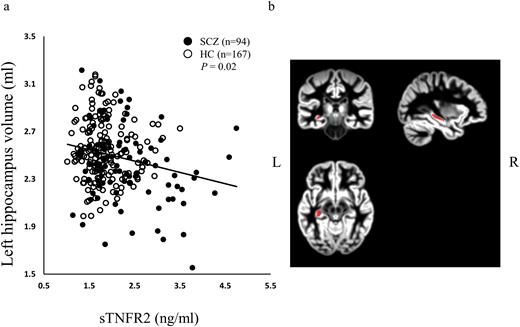
Correlation of the left hippocampus volume and plasma levels of sTNFR2 (a). sTNFR2 was negatively correlated with the left hippocampus volume. Anatomical atlas from which the signal was extracted are shown in (b). Y axis shows the volume of left hippocampus (mL).
To confirm the negative correlation between the plasma sTNFR2 levels and hippocampal volume, FreeSurfer analysis was also conducted. A significant negative correlation between plasma sTNFR2 levels and left hippocampal volume measured by FreeSurfer analysis was observed in all samples (patients with schizophrenia and healthy controls) (total; n=235, r=-0.16, P=.016, SCZ; n=82, r=-0.19, P=.09, HC; n=153, r=-0.04, P=.63). A partial correlation using age, gender, and smoking status as control variables did not change the results (total; n=214, r=-0.24, P=4.3×10⁻⁴).
Correlation Between Clinical Variables and Plasma Level of sTNFR2
We also observed the correlations between clinical variables and plasma level of sTNFR2. PANSS positive subscale scores and duration of illness were positively and significantly correlated with plasma level of sTNFR2 (supplementary Table 5, PANSS-positive; r=0.23, P=.01, duration of illness; r=0.35, P=7.9×10⁻⁵). PANSS scores were also negatively and significantly correlated with many of cognitive functions (supplementary Table 5).
Discussion
In this study, we confirmed that the plasma levels of sTNFR2 were significantly increased in patients with schizophrenia in a large Japanese cohort that include antipsychotic drugs-free patients and treatment-resistant patients. The involvement of inflammatory-related pathways, including TNF-α-related pathways, in schizophrenia has been implied by many studies (Dean et al., 2013). Our data showing higher plasma sTNFR2 levels in patients with schizophrenia are consistent with the results of previous studies (Coelho et al., 2008; Noto et al., 2013; Hoseth et al., 2017). Many studies have shown that proinflammatory cytokines including TNF-α are etiological factors for schizophrenia (Na et al., 2014). Considering the neuroprotective roles of sTNFR2, it is possible that high levels of sTNFR2 in schizophrenia are the compensatory response to proinflammatory imbalance in the TNF system. To the best of our knowledge, this is the first study to demonstrate that plasma sTNFR2 levels are significantly increased in antipsychotic drugs-free patients with schizophrenia, suggesting that higher levels of sTNFR2 in patients with schizophrenia are not the result of medication. It has been reported that sTNFR1, but not sTNFR2, levels are higher in treatment-resistant patients than in controls (Noto et al., 2013). However, our results showed that sTNFR2 levels were also higher in treatment-resistant patients than in controls.
It has been reported that higher peripheral levels of sTNFR2 are associated with worse cognitive function in community samples (Gao et al., 2016), Parkinson’s disease patients (Rocha et al., 2014), and mood disorder patients (Doganavsargil-Baysal et al., 2013; Bobińska et al., 2017). The plasma TNF-α/sTNFRs (sTNFR1 and sTNFR2) ratio was also reported to be significantly associated with working memory assessed via the WAIS-III in patients with schizophrenia. However, an association between plasma sTNFR2 levels and cognitive function has not been investigated in patients with schizophrenia. We found that higher plasma sTNFR2 levels were associated with worse cognitive function. A significant association was observed mainly in all samples (patients with schizophrenia and healthy controls), and we did not detect a significant association in patients with schizophrenia only. The effect of sTNFR2 on cognitive function might be the indirect one in the pathophysiology of schizophrenia. Most subcategories of both the WAIS and WMS-R were associated with plasma sTNFR2 levels, suggesting that sTNFR2 is associated with general cognitive and memory functions rather than specific functions.
Higher peripheral sTNFR2 levels were reported to be associated with smaller hippocampal volume in a community sample (Schmidt et al., 2016). However, an association between peripheral sTNFR2 levels and hippocampal volume in patients with schizophrenia has not yet been investigated. An association between the plasma levels of sTNFR1 and hippocampal volume was investigated in patients with schizophrenia, and no significant association was observed (Hoseth et al., 2016). We found the significant negative association between plasma level of sTNFR2 and hippocampal volume in patients with schizophrenia at least in VBM analysis. Although we found significant negative correlation of sTNFR2 levels and cognition mainly in healthy controls, a significant correlation of sTNFR2 levels and hippocampal volume was observed mainly in patients with schizophrenia, and we did not detect a significant association in healthy controls only. The results showing discrepancy between cognition and brain volume. It is possible that sTNFR2 levels have a more direct effect on hippocampal volume than cognition in pathophysiology of schizophrenia. Experimental data suggest that administration of TNF-α attenuate hippocampal growth (Seguin et al., 2009), whereas depletion of sTNFR2 lead to hippocampal neuron death (Yang et al., 2002). It is possible that sTNFR2 play protective roles in hippocampus against activation of TNF system that could potentially contribute to a decrease in hippocampal volume.
The results of this study should be evaluated in light of certain limitations. First, plasma sampling conditions, such as the time of sampling and diet, might modulate the plasma levels of investigated markers. However, these conditions were not controlled for in this study. In addition, sTNFRs (sTNFR1 and sTMFR2) have been reported to be correlated with body mass index (BMI) (Hinze-Selch et al., 2000; Himmerich et al., 2006), and this association indicates that BMI should be controlled for in such studies. However, the BMI of our subjects was not available and was therefore not controlled for in this study.
The results that increased plasma sTNFR2 levels are associated with a smaller hippocampal volume and cognitive impairment in schizophrenia suggest that sTNFR2 might play an important role in the pathophysiology in schizophrenia. Further studies are needed to elucidate the mechanism how sTNFR2 in schizophrenia have effect on hippocampal volume loss and cognitive impairment.
Supplementary Material
Supplementary data are available at International Journal of Neuropsychopharmacology online.
Funding
This work was supported by a Grant-in-Aid for Scientific Research (B) (25293250, 16H05375), a Grant-in-Aid for Scientific Research (C) (25461730), and a Grant-in-Aid for Young Scientists (B) (15K19726) from the Japan Society for the Promotion of Science; the Health and Labour Sciences Research Grants for Comprehensive Research on Persons with Disabilities from the Japan Agency for Medical Research and Development; Brain Mapping by Integrated Neurotechnologies for Disease Studies from the Ministry of Education, Science, Sports, Culture and Technology in Japan. The funders had no role in the study design, data collection and analysis, decision to publish, or preparation of the manuscript.
Acknowledgments
We thank all the individuals who participated in this study.
Statement of interest
None.
