


Abstract
Chronic exposure to the glucocorticoid hormone corticosterone exerts cellular stress-induced toxic effects that have been associated with neurodegenerative and psychiatric disorders. Docosahexaenoic acid is a polyunsaturated fatty acid that has been shown to be of benefit in stress-related disorders, putatively through protective action in neurons.
We investigated the protective effect of docosahexaenoic acid against glucocorticoid hormone corticosterone-induced cellular changes in cortical cell cultures containing both astrocytes and neurons.
We found that glucocorticoid hormone corticosterone (100, 150, 200 μM) at different time points (48 and 72 hours) induced a dose- and time-dependent reduction in cellular viability as assessed by methyl thiazolyl tetrazolium. Moreover, glucocorticoid hormone corticosterone (200 μM, 72 hours) decreased the percentage composition of neurons while increasing the percentage of astrocytes as assessed by βIII-tubulin and glial fibrillary acidic protein immunostaining, respectively. In contrast, docosahexaenoic acid treatment (6 μM) increased docosahexaenoic acid content and attenuated glucocorticoid hormone corticosterone (200 μM)-induced cell death (72 hours) in cortical cultures. This translates into a capacity for docosahexaenoic acid to prevent neuronal death as well as astrocyte overgrowth following chronic exposure to glucocorticoid hormone corticosterone. Furthermore, docosahexaenoic acid (6 μM) reversed glucocorticoid hormone corticosterone-induced neuronal apoptosis as assessed by terminal deoxynucleotidyl transferase–mediated nick-end labeling and attenuated glucocorticoid hormone corticosterone-induced reductions in brain derived neurotrophic factor mRNA expression in these cultures. Finally, docosahexaenoic acid inhibited glucocorticoid hormone corticosterone-induced downregulation of glucocorticoid receptor expression on βIII- tubulin-positive neurons.
This work supports the view that docosahexaenoic acid may be beneficial in ameliorating stress-related cellular changes in the brain and may be of value in psychiatric disorders.
Introduction
Many neuropsychiatric disorders, including anxiety and depression, are associated with alterations in the hypothalamic-pituitary-adrenal axis and elevated concentrations of glucocorticoids (Kronenberg et al., 2009). Preclinical studies have shown that chronic exposure to glucocorticoids is deleterious to the structural and functional plasticity of adult rat brain (Sapolsky and Pulsinelli, 1985; Zhu et al., 2013), although acute treatment with glucocorticoids can be neuroprotective (Jeanneteau et al., 2008). Chronic elevation of glucocorticoid levels alters the cellular composition and white matter structure of rodent hippocampus both in vitro and in vivo (Chetty et al., 2014) and induces a number of behavioral abnormalities similar to depression and anxiety in mice (Ardayfio and Kim, 2006; Murray et al., 2008).
Stress-induced increases in glucocorticoids has also been shown to impair the prefrontal cortex (PFC) structure and function (Arnsten, 2009). Indeed, the PFC is one of the most sensitive brain areas to the detrimental effects of stress exposure (Arnsten, 2009) and has a high density of glucocorticoid receptors (GRs) (Chao et al., 1989; Barsegyan et al., 2010). High doses of glucocorticoids have been shown to impair PFC-dependent working memory in humans (Lupien et al., 1999). Moreover, chronic corticosterone (CORT) treatment has also been shown to produce neuronal impairment in the PFC, such as reduced distal dendritic spines of neurons and neuronal loss in rats (Wellman, 2001; Seib and Wellman, 2003; Cerqueira et al., 2005). An inverse relationship between glucocorticoid levels and brain derived neurotrophic factor (BDNF), a neurotrophin involved in cellular plasticity and neuronal survival (Lipsky and Marini, 2007), has been described both in humans and rodents (Issa et al., 2010). Strategies to attenuate the effects of glucocorticoids on brain function may result in novel treatment approaches for depression and anxiety.
Docosahexaenoic acid (DHA; 22:6n-3) represents the most abundant omega-3 polyunsaturated fatty acid (PUFA) in the mammalian brain, and as such it has been implicated in the regulation of brain structure, signalling, and plasticity (Salem et al., 2001; Sharma et al., 2012; Crupi et al., 2013). DHA, mostly concentrated in the frontal cortex and hippocampus of rat (Xiao et al., 2005), regulates frontal cortex BDNF levels both in vitro and in vivo (Rao et al., 2007). Moreover, it has been shown that BDNF/DHA cotreatment reduced cell death by approximately 50% compared with controls in vitro after chronic treatment of either 72 or 144 hours (Calandria et al., 2012). In accordance with these findings, chronic PUFA supplementation promotes beneficial effects on anxiety and depressive-like behaviors in stress-induced animals (Ferraz et al., 2011). Moreover, growing evidence points to a decreased dietary PUFA intake associated with an increased prevalence of mental illness, including stress-related diseases (McNamara et al., 2007; Levant et al., 2008; Mathieu et al., 2011). Indeed, postmortem orbitofrontal cortex DHA levels are 22% lower in major depressive disorder patients relative to normal controls (McNamara et al., 2007). Clinical observations have shown chronic PUFA supplementation to be beneficial in reducing certain anxiety behaviors as well as in treating major depressive disorder (Yehuda et al., 2005; Grosso et al., 2014).
In view of the above, we investigated whether DHA could abrogate CORT-induced toxic effects in primary cortical cell cultures that contained both astrocytes and neurons. Furthermore, we predicted that these effects would be related to molecular changes at the level of BDNF and GR.
Materials and Methods
Primary Cultures of Postnatal Day 1/2 Rat Cortex
All scientific procedures were carried out in line with Directive 2010/63/EU and were approved by the Animal Experimentation Ethics Committee of University College Cork #2012/036. Mixed cortical cell cultures, consisting of both neurons and astrocytes, were prepared from postnatal day 1/2 Sprague Dawley rats (Biological Services Unit, University College Cork) as previously described (Long-Smith et al., 2010). Rats were decapitated, the cerebral cortices dissected out, and the meninges removed. Tissue was mechanically dissociated and incubated in trypsin (0.25 μg/mL, Sigma-Aldrich) for 15 minutes at 37°C with 5% CO2. This was replaced with prewarmed dissociation medium (DMEM-F12 supplemented with fetal calf serum [10%, Sigma-Aldrich] and DNase [0.1mg/mL, Sigma-Aldrich]). The suspension was inverted gently for 1 minute, triturated with a flame-polished Pasteur pipette, and passed through a sterile mesh filter (40 μm). The suspension was centrifuged at 200g for 5 minutes at 20°C, and the pellet was resuspended in warm culture media (DMEM-F12 supplemented with fetal calf serum [1%, Sigma-Aldrich], B-27 [2%, Gibco], penicillin/streptomycin [1%], d-glutamine [1%, Sigma-Aldrich], and d-glucose [55mM, Sigma-Aldrich]). Suspended cells were plated at a density of 4.5×10⁴ cells on circular 13-mm-diameter coverslips, coated with poly-D-lysine (0.1mg/mL, Sigma-Aldrich) in a 24-well plate, and incubated in a humidified atmosphere containing 5% CO2: 95% O2 at 37°C for 2 hours prior to being flooded with prewarmed culture media. The day after, all cells were grown in culture medium containing α-tocopherol (40 μM), bovine serum albumin (0.01%), and ethanol (0.3%). Thereafter, one-half of the media was replaced every 2 to 3 days for the duration of the experiment.
Treatment
Dose Response of Effect of CORT on Mixed Cortical Cultures
First, we assessed the optimal dose of CORT in mixed cortical cultures. The experimental timeline is shown in Figure 1D. Briefly, cells were treated with CORT (75, 100, 150, 200 μM) after 7, 8, or 9 divisions (DIV), respectively.

Corticosterone (CORT)-induced reduction in dehydrogenase activity in rat mixed cortical cultures is prevented by glucocorticoid receptor (GR) antagonist RU486. (A-C) CORT dose-dependent reduction in dehydrogenase activity at 24, 48, and 72 hours, respectively. (D) Schematic representing CORT, GR antagonist RU486, and mineralcorticoid receptor (MR) antagonist spironolactone (SPIRO) treatments. (E) RU486 (10 μM), but not SPIRO (50 μM), blocks the decrease in dehydrogenase activity upon treatment with CORT. Intergroup comparisons: *P < 0.05, **P < 0.01, and ***P < 0.001 compared with control (-); &&P < 0.01 compared with CORT (200 μM). Data are presented as mean ± SEM (n = 3).
RU486 and Spironolactone Effects on Mixed Cortical Cultures
Second, we determined whether GRs or mineralcorticoid receptors (MRs) mediated the effect of CORT in mixed cortical cultures. The experimental timeline is shown in Figure 1D. Briefly, cells were cotreated with CORT (200 μM) and with the GR antagonist RU486 (10 μM) or the MR antagonist spironolactone (SPIRO; 50 μM) after 7 DIV.
Dose Response of Effect of DHA on Mixed Cortical Cultures
Third, we assessed the optimal dose of DHA in mixed cortical cultures. The experimental timeline is shown in Figure 2B. Briefly, cells were treated with DHA (3, 6 μM) after 1 DIV.
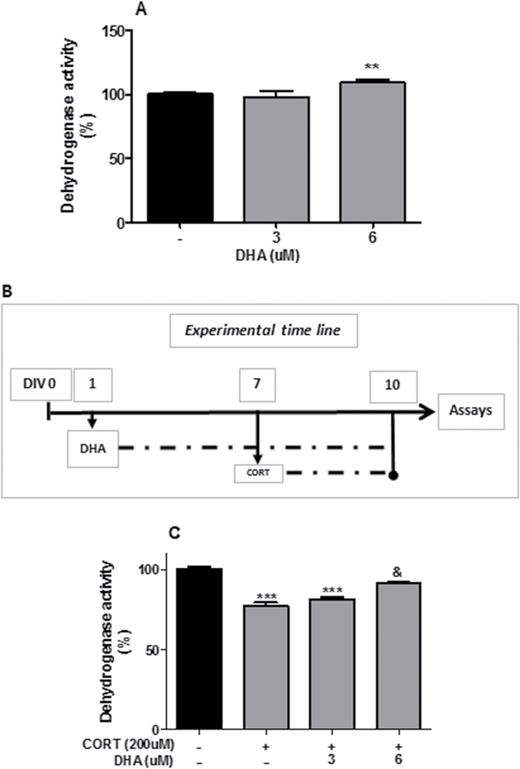
Docosahexaenoic acid (DHA) prevented corticosterone (CORT)-induced reduction in dehydrogenase activity in rat mixed cortical cultures. (A) DHA dose-dependent increase in dehydrogenase activity. (B) Schematic representing CORT and DHA treatments. (C) DHA prevention of CORT-induced reduction in dehydrogenase activity. Intergroup comparisons: **P < 0.01 and ***P < 0.001 compared with control (-); &P < 0.05 compared with CORT (200 μM). Data are presented as mean ± SEM (n = 3).
Preventive Effect of DHA against CORT on Mixed Cortical Cultures
Fourth, we determined whether DHA reversed CORT-induced effect on mixed primary culture. The experimental timeline is shown in Figure 2B. Briefly, cells were pretreated with DHA (6 μM) after 1 DIV before treatment with CORT (200 μM) after 7 DIV.
To avoid DHA oxidation, one-half of the media was replaced every 2 to 3 days. DHA, CORT, RU486, SPIRO, α-tocopherol, and bovine serum albumin-fatty acids free were purchased from Sigma-Aldrich. All treatments were freshly prepared.
Methyl Thiazolyl Tetrazolium (MTT) Assay
Cell viability was assessed by measuring the reduction of MTT by mitochondrial dehydrogenase of viable cells as previously described (Godinho et al., 2014). Medium was removed and replaced with 300 μL of fresh culture medium containing MTT reagent (1mg/mL) for 3 hours at 37oC. The formazan crystals produced were dissolved in 100 μL of dimethyl sulfoxide. Absorbance was measured at 590nm using a UV plate reader. Four wells per treatment were analyzed from 3 independent experiments. Results were expressed as percent dehydrogenase activity compared with untreated controls.
Fatty Acid Analysis
For fatty acid analysis, cells were washed in Hank’s Balanced Salt Solution. Trypsin (0.25 μg/mL, Sigma-Aldrich) was used to remove adherent cells from culture surface and harvested with a cell scraper. Cells were then spun down at 1200rpm for 5 minutes and supernatant was discarded. Lipids were extracted from cell pellets with chloroform:methanol (2:1 v/v) as described previously (Folch et al., 1957). Fatty acid methyl esters (FAMEs) were prepared by first using 10mL 0.5 N NaOH in methanol for 10 minutes at 90°C followed by 10mL 14% BF3 in methanol for 10 minutes at 90°C (Park and Goins, 1994). FAMEs were recovered with hexane. Prior to gas chromatography analysis, samples were dried over anhydrous sodium sulphate (0.5g) for 1 hour, concentrated under nitrogen, and stored at -20°C. FAMEs were separated using gas chromatography (Agilent 7890B, Agilent Technologies, Santa Clara, CA) fitted with a flame ionisation detector, using a Chrompack CP Sil 88 column (Chrompack, JVA Analytical, 100-m×0.25-mm internal diameter, 0.25-μm film thickness) and helium as the carrier gas. The column oven was programmed to be held initially at 80°C for 8 minutes and increased to 8.5°C/min to a final column temperature of 200°C. The injection volume used was 0.5 μL, with an automatic sample injection (CTC Autosampler, Model 80) on an Aglient Multimode Inlet on-column temperature programmable injector. Peaks were integrated using the Agilent OpenLAB Chemstation software (version A.01.06.111). Identification of FAMEs was carried out by comparison of retention times with pure FAME standards (Nu-Chek Prep, Elysian, MN) and quantified against an internal standard (C17:0). Results are expressed as g/100g total FAME.
Immunocytochemistry
Culture media was removed and cells were washed with prewarmed Hank’s Balanced Salt Solution. Cells were fixed with ice-cold methanol for 10 minutes at -20°C and subsequently washed and permeabilized in phosphate buffered solution (PBS) containing Tween 20 (0.02%) 3 times for 5 minutes. Cells were incubated in 5% normal horse serum in PBS containing Tween 20 overnight at 4 °C to attenuate nonspecific antibody binding. Cells were incubated overnight at 4°C in antibodies that target βIII-tubulin-positive neurons (1:300; mouse monoclonal, Promega), glial fibrillary acidic protein (GFAP)-positive astrocytes (1:300; rabbit polyclonal, Dako), or GRs (1:100; rabbit monoclonal, Cell Signaling). Cells were subsequently incubated in the appropriate secondary antibody: Alexa Fluor 488 donkey anti-rabbit IgG or Alexa Fluor 594 donkey anti-mouse IgG (all 1:2000; Molecular Probes). Cells were counterstained with bisbenzimide (1:2500; Sigma-Aldrich) to identify the nuclei and mounted onto glass coverslips with an aqueous mounting medium (Dako). For each antibody, the cells from one coverslip were incubated in blocking solution and secondary antibody, without primary antibody (to account for nonspecific binding of the secondary antibody), and showed a complete absence of immunofluorescent staining (data not shown).
Cell Counts and Densitometry
An upright microscope (AX70, Olympus, Hamburg, Germany) was used to analyze the immuno-positive cell composition of the primary culture as previously described (Green and Nolan, 2012). Immuno-positive cells were counted in 5 randomly chosen fields of view from each of the 4 coverslips and divided by the total number of cells per 5 fields of view to give an average percentage for each coverslip. Only βIII-tubulin or GFAP-positive cells with a differentiated phenotype were counted. Four wells per treatment were analyzed from 3 independent experiments. The densitometry of 40 GR-positive neurons, selected from 5 randomly chosen fields of view from each of the 3 coverslips per treatment, was carried out using Image J software (version 1.38X, NIH, Bethesda, MD). For each photomicrograph, background measurements were subtracted from each GR-positive cell value to obtain a corrected fluorescence measurement. Each experiment was independently repeated 3 times.
TUNEL: Apoptosis
Fragmented DNA of apoptotic cells was measured using the terminal deoxynucleotidyl transferase–mediated nick-end labeling (TUNEL) staining provided by the DeadEnd Fluorometric TUNEL System according to the manufacturer’s instructions (Promega). Cells were counterstained with bisbenzimide (1:2500; Sigma-Aldrich) to label nuclei and double stained with ΒIII-tubulin (1:300; mouse monoclonal, Promega) to detect apoptotic neurons. Apoptotic-positive cells and apoptotic-positive neurons were counted in 5 randomly chosen fields of view from each of the 4 coverslips and divided by the total number of cells or the total number of neurons, respectively, per 5 fields of view to give an average percentage for each coverslip. Four wells per treatment were analyzed from 3 independent experiments.
RNA Isolation and Quantitative Real-Time PCR
Total RNA was isolated from mixed cortical primary culture using the ReliaPrep RNA Cell Miniprep system as per the manufacturer’s instructions (Promega). Briefly, cells were harvested using a denaturing lysis solution. The lysate was then transferred to a microcentrifuge tube in the presence of isopropanol and centrifuged. The filter was then washed and finally the RNA was eluted using Nuclease-Free Water. Isolated RNA was stored at -80°C until further processing. RNA concentration was quantified using the ND-1000 spectrophotometer (NanoDrop), and RNA quality was assessed using the Agilent 2100 Bioanalyzer.
Analysis of RNA expression levels was carried as previously described (O’ Connor et al., 2013). Briefly, equal amounts of RNA were first reverse transcribed to cDNA using High Capacity cDNA Reverse Transcription Kit (Applied Biosystems, Life Technologies, Carlsbad, CA). Real-time PCR was performed using TaqMan Universal Master Mix II, no UNG, and TaqMan Gene Expression Assays designed by Applied Biosystems for rat genes on the ABI7300 Real Time PCR machine (Applied Biosystems, Warrington, UK). Each sample was analyzed in triplicate for both target gene and endogenous control using the 7300 System SDS Software (Applied Biosystems, Life Technologies). All assays were controlled for the absence of genomic DNA amplification. β-actin (VIC/MGB Probe, Primer Limited, Applied Biosystems) was used as an endogenous control. Cycle threshold (Ct) values were recorded. The Ct value for the target gene in each sample was normalized to its endogenous control transformed to relative gene expression value using the 2−ΔCt method (Simen et al., 2006). Four wells per treatment were analyzed from 3 independent experiments.
BDNF Protein Detection Levels by ELISA
Supernatant was collected from cortical cell cultures. Cortical cells where lysed using T-PER buffer (Thermo scientific) containing protease and phosphatase inhibitor cocktail (Roche). Cell extracts were obtained after centrifugation at 14000g for 10 minutes. Protein concentrations from each sample were then measured using a Pierce BCA protein assay kit (Thermo scientific) and normalized. Thus, BDNF levels were measured in cellular media and cortical cellular extracts using an ELISA kit according to the manufacturer’s instructions (BDNF Emax Immunoassay (Promega Corp, Madison, WI). Briefly, the monoclonal antibody was added to each well of a 96-well plate and incubated overnight at 4°C. The following were added to the wells sequentially: samples and BDNF standards in duplicate (incubated 2 hours at room temperature), anti-human BDNF pAb (incubated 2 hours at room temperature), anti-IgY HRP (incubated 1 hour at room temperature), and TMB solution (incubated 20 minutes at room temperature). The plate was washed with Tris-buffered saline 0.05% Tween 20 buffer. Finally, a stop solution was added, and absorbance was read at 450nm using a microplate reader (Bio-Rad Laboratories) within 30 minutes of the addition of the stop solution. BDNF concentration was calculated based on a standard curve. Values are expressed in pg/mL protein.
Statistics
All data are presented as mean±SEM. Data were analyzed using a 1 or 2-way ANOVA as appropriate, followed by Fisher’s LSD posthoc test, using the statistical software package SPSS 21.0 (IBM). A P-value of 0.05 was selected as the threshold of statistical significance.
Results
MTT: Cell Viability
We first analyzed the effect of a range of CORT concentration (75, 100, 150, 200 μM) on dehydrogenase activity in rat mixed cortical cultures at different time points (24, 48, 72 hours) using the MTT assay (Figure 1A-C). Administration of CORT for a period of 24 hours did not induce changes in dehydrogenase activity at any of the concentrations used (Figure 1A). However, after both 48 and 72 hours, CORT treatment (200 μM) significantly reduced dehydrogenase activity (P<.05; P<.001) while also reducing its activity after treatment with 150 μM for 72 hours (P<.01) (Figure 1B-C). To determine if GRs or MRs mediated the effect, we cotreated cells with CORT (200 μM) and with the GR antagonist RU486 (10 μM), or the MR antagonist SPIRO (50 μM) for 72 hours. RU486, but not SPIRO, significantly attenuated the CORT-induced decrease in dehydrogenase activity (P<.01), indicating that this effect is mediated by the GR (Figure 1E). Secondly, we analyzed the effect of DHA on dehydrogenase activity and its potential protective effect against CORT (200 μM, 72 hours). DHA (6 μM) induced an increase in dehydrogenase activity compared with untreated control cultures (P<.01) (Figure 2A). Moreover, this concentration of DHA reversed CORT-induced decrease in dehydrogenase activity in rat mixed cortical cultures (P<.05) as shown in Figure 2C.
Fatty Acids Analysis
Subsequently, we wished to establish the effects of both CORT (200 μM) and DHA (6 μM) on the fatty acid cellular composition of rat mixed cortical cultures. Administration of DHA significantly increased DHA content in both DHA and CORT+DHA groups. In contrast, CORT (200 μM, 72 hours) increased the n-6:n-3 fatty acids ratio compared with all the groups (Table 1).
Fatty Acids Analysis
| Control | DHA (6 μM) | CORT (200 μM) | CORT+DHA | |
|---|---|---|---|---|
| SFA | ||||
| 14:0 | 3.1±0.2 | 2.9±0.4 | 3.1±0.2 | 3.2±0.4 |
| 16:0 | 39.5±1.1 | 41.5±1 | 39.6±1.1 | 39.5±0.9 |
| 18:0 | 25.5±0.4 | 25±0.9 | 27.3±0.3* | 26.0±0.8 |
| 20:0 | 0.7±0 | 0.5±0.2 | 0.8±0.1 | 0.8±0.1 |
| Total SFA | 68.8 | 69.9 | 70.8 | 69.4 |
| MUFA | ||||
| 16:1 | 1.1±0.1 | 1.4±0.3 | 1.1±0.1 | 1.0±0 |
| 18:1t n-9 | 3.0±0.3 | 1.9±0.7* | 3.2±0.3 | 3.1±0.3 |
| 18:1c n-9 | 14.8±0.5 | 14.7±0.9 | 12.6±0.2** | 13.8±0.8 |
| 18:1 t n-7 | 1.7±0.1 | 1.6±0.1 | 1.4±0.1 | 1.5±0.2 |
| Total MUFA | 20.6 | 19.7 | 18.4 | 19.4 |
| PUFA | ||||
| 18:2 n-6 | 2.5±0.1 | 2.7±0.3 | 2.8±0.1 | 2.5±0.3 |
| 18:3 n-6 | 4.0±0.5 | 3.3±1.0 | 4.7±0.5 | 4.6±0.5 |
| 20:4 n-6 | 2.8±0.3 | 2.5±0.5 | 2.8±0.5 | 2.5±0.3 |
| 22:4 n-6 | 0.3±0.3 | n.d. | 0.1±0.1 | n.d. |
| 22:6 n-3 | 1.0±0.3 | 1.9±0.6* | 0.5±0.4 | 1.6±0.2& |
| Total PUFA | 10.6 | 10.4 | 10.8 | 11.2 |
| n6:n3 | 10.1 | 4.4 | 22.5 | 5.9 |
Abbreviations: CORT, corticosterone; DHA, docosahexaenoic acid; MUFA, monounsaturated fatty acid; n.d., not detected; PUFA, polyunsaturated fatty acid; SFA, saturated fatty acid.
*P<.05 relative to control, **P<.01 relative to control, &P<.05 relative to CORT (200 μM). Data are expressed as mean g/100g total FAME±SEM of duplicate samples from 3 independent experiments.
Immunostaining: Quantification of Cell Phenotypes
To examine the effects of both CORT and DHA on the cellular composition of rat mixed cortical cultures, cells were treated with CORT (200 μM, 72 hours) or DHA (6 μM, 9 DIV) or pretreated with DHA for 6 days before treatment with CORT, as described above. Immunocytochemistry for bisbenzimide, βIII-tubulin, and GFAP was used to visualize cellular nuclei, postmitotic neurons, and astrocytes, respectively (Figure 3A). CORT decreased the number of total cells (P<.05) as shown in Figure 3B. Moreover, CORT exerted a bimodal effect on cellular composition. Specifically, CORT decreased the percentage composition of neurons (P<.001) while increasing the percentage of astrocytes in culture (P<.01) (Figure 3C-D). DHA attenuated the CORT-dependent decrease in number of total cells stained with bisbenzimide. Furthermore, DHA reversed both the CORT-induced decrease in the percentage composition of neurons (P<.01) and the increase in the percentage composition of astrocytes (P<.05) in these cultures (Figure 3C-D).
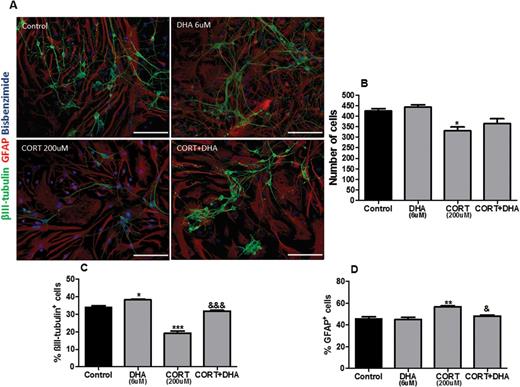
Docosahexaenoic acid (DHA) prevented corticosterone (CORT)-induced changes in the cellular composition of rat mixed cortical cultures. (A) Representative photomicrographs of cells immunocytochemically stained for βIII-tubulin (green), glial fibrillary acidic protein (GFAP) (red), and bisbenzimide (blue). (B) Quantification of total cells stained with bisbenzimide. (C) Percentage composition of βIII-tubulin+cells (D) and GFAP+cells. Scale bar=50μm. Intergroup comparisons: *P < 0.05, **P < 0.01 compared with control; &P < 0.05 and &&&P < 0.01 compared with CORT (200 μM). Data are presented as mean ± SEM (n = 3).
TUNEL: Apoptosis
To establish whether the CORT-induced reduction of the mitochondrial dehydrogenase activity is due to apoptosis, we analyzed the percentage of total apoptotic cells as well as of apoptotic neurons in mixed cortical cultures (Figure 4A). Furthermore, we investigated a potential reversal effect exerted by DHA. CORT treatment (200 μM, 72 hours) induced a trend toward an increased percentage of apoptotic cells (P=.079) as well as significantly increasing the percentage composition of apoptotic neurons (P<.01). In contrast, pretreatment with DHA (6 μM, 6 DIV) reversed the CORT-induced increase in total apoptotic cells (P<.01) and apoptotic neurons (P<.01) (Figure 4B-C).
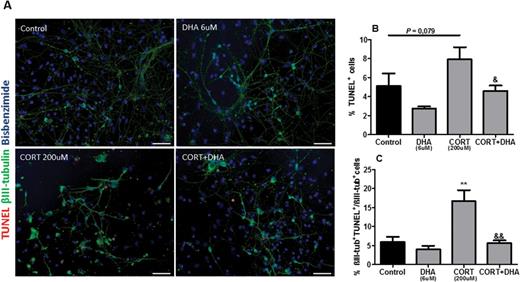
Docosahexaenoic acid (DHA) prevented corticosterone (CORT)-induced apoptosis in rat mixed cortical cultures. (A) Representative photomicrographs of cells immunocytochemically stained for terminal deoxynucleotidyl transferase–mediated nick-end labeling (TUNEL) (red), βIII-tubulin (green), and bisbenzimide (blue). (B) Percentage composition of TUNEL+cells. (C) Percentage of βIII-tub+TUNEL+/ βIII-tub+cells. Scale bar=100μm. Intergroup comparisons: **P < 0.01 compared with control; &P < 0.05 and &&P < 0.01 compared with CORT (200 μM). Data are presented as mean ± SEM (n = 3).
GR Expression
Having established that DHA ameliorated CORT-related cellular changes in rat mixed cortical cultures, we wanted to establish the molecular mechanisms implicated in these effects. We focused specifically on the GR, as treatment with the GR antagonist RU486 prevented CORT-induced cell death. Immunocytochemical analyses revealed that CORT decreased the expression levels of GR in mature neurons (P<.01). Interestingly, pretreatment with DHA inhibited the CORT-induced downregulation of GR expression on βIII-tubulin-positive neurons (Figure 5A-B).
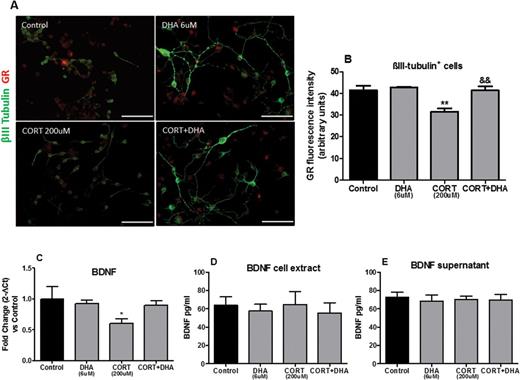
Docosahexaenoic acid (DHA) prevented corticosterone (CORT)-induced changes in the glucocorticoid receptor (GR) and in the gene expressions of rat mixed cortical cultures. (A) Representative photomicrographs of cells immunocytochemically stained for βIII-tubulin (green) and GR (red). (B) Mean densitometry analysis of GR protein in βIII-tubulin+cells. Scale bar=100μm. (C) Relative brain derived neurotrophic factor (BDNF) gene expression from RNA extracted by rat mixed cortical cultures. (D- E) BDNF protein expression levels in rat mixed cortical cultures. Intergroup comparisons: **P < 0.01 compared with control, &&P < 0.01 compared with CORT (200 μM). Data are presented as mean ± SEM (n = 3).
BDNF mRNA and Protein Expression Levels
Subsequently, we wished to establish whether CORT-induced GR downregulation in neurons is associated with reductions in the neurotrophin BDNF mRNA levels and whether such effects are reversed by DHA intervention. In CORT-treated (200 μM, 72 hours) rat mixed cortical cultures, we found a significant reduction in BDNF (P<.05) expression levels. DHA reversed the CORT-induced decrease in BDNF mRNA expression levels, as shown in Figure 5C. However, no changes were observed at BDNF protein levels in any of the experimental groups upon treatment (Figure 5D-E).
Discussion
The present study demonstrates a key role for DHA in reversing CORT-induced cellular changes in cerebral cortex. Specifically, we show that CORT-induced cellular toxicity exerts a bimodal effect on the neuronal and glial cell composition, which is abolished by DHA treatment in vitro. We demonstrate that DHA reverses CORT-induced neuronal apoptosis and attenuates CORT-induced reductions in BDNF expression levels in these cultures. We show that DHA inhibits CORT-induced downregulation of GR expression on neurons.
We first demonstrated that CORT, in a dose- and time-dependent manner, reduces rat cortical cell viability. In accordance with our findings, a CORT-dependent decreased cellular viability in different rat brain areas such as cortex (Liu et al., 2010a, 2010b), hippocampus (Zhou et al., 2000), and hypothalamus (Zhang et al., 2012) has been already shown. We also demonstrated that CORT treatment increased the n-6:n-3 fatty acid ratio. A higher n-6:n-3 ratio has been previously associated with the development of stress-related pathologies (Maes et al., 1996; Peet et al., 1998). Interestingly, our study showed differential CORT effects on the cellular composition of the rat mixed cortical primary culture. Indeed, the percentage composition of neuronal cells was reduced by CORT, whereas the percentage of astrocytes was increased. Specifically, our data also showed that cortical neuronal cell death was induced by apoptosis. That CORT decreases the number of neurons is in line with earlier in vitro and in vivo investigations at cortical, hippocampal, and hypothalamic levels (Sapolsky et al., 1985; Crochemore et al., 2005; Liu et al., 2010a, 2010b; Zhu et al., 2013). However, evidence of the impact of glucocorticoids on glial cells is limited. Bridges et al. (2008) have shown that chronic CORT administration, over a period of 21 days, increases astrocyte numbers in the CA1 hippocampal region of both male and female rats. Accordingly, it has been shown that stress increases the hippocampal GFAP-immunoreactive astrocytes by 30% compared with control (Lambert et al., 2000). However, the meaning of astrocyte overgrowth subsequent to stress or CORT treatment remains unknown. This phenomenon could be considered as part of a greater neuronal damage by impeding the neuron-glia interaction. Indeed, astrogliosis has been shown to impede the movement of substances through the extracellular space, altering the extra-synaptic communication between glia and glia, and glia and neurons (Sykova, 2001, 2004, 2005; Sykova et al., 2002). This may also provide further understanding in regards to impairments in cognition and emotional state observed as a consequence of chronic stress (Lupien et al., 2009). Noteworthy, alteration in neuronal and glial cell loss, cell atrophy, or increased number of cells have been reported postmortem in psychiatric disorders (Rajkowska, 2000).
DHA treatment had a significant impact on cortical cell cultures treated with CORT. Indeed, we found that a specific DHA dose (6 μM) increased DHA cellular content as well as prevented CORT cellular death and neuronal apoptosis. These data are in agreement with other studies that showed increased neuronal survival as well as prevention of cortical neuronal apoptosis in primary culture after DHA treatment (Cao et al., 2005; Florent et al., 2006). Accordingly, increased DHA content in the brain has been found to protect against several neurotoxic insults such as ischemia (Belayev et al., 2009), glutamate excitotoxicity (Blondeau et al., 2002; Ozyurt et al., 2007), and traumatic head injury (Wu et al., 2004). Of note, although DHA increased the percentage of dehydrogenase activity, it did not significantly reverse CORT-induced cell loss observed by counting the total number of cellular nuclei in these cultures. The reason of this discrepancy may be due to the two different methods applied. The analysis of dehydrogenase activity assesses cellular metabolic activity, which reflects the number of viable cells present in the cultures. Instead, the manual counting of cellular nuclei represents a direct method of analysis of cell viability. Moreover, the ability of DHA to reverse CORT-induced increase percentage composition of astrocytes may be the reason why DHA did not significantly reverse CORT-induced cell loss.
Both GR and MR represent the receptors through which CORT exerts its effects. The fact that blockade of CORT-induced cellular changes by cotreatment of the cell culture with RU486, a GR antagonist, but not with SPIRO, an MR antagonist, suggests that CORT exerts its effect on cell viability through the activation of the GR only. This is in agreement with previous studies that have suggested a differential effect of MR and GR on cell death in rodents (Behl et al., 1997; Almeida et al., 2000). Moreover, it has been shown that GR-mediated apoptosis is counteracted by MR agonist aldosterone in hippocampal neurons (Crochemore et al., 2005). In our study, chronic CORT treatment downregulated GR expression levels in cortical neurons. Interestingly, pharmacological inhibition of GR deactivates the CamKII-BDNF-CREB pathway that mediates long-term memory formation in hippocampal adult rats (Chen et al., 2012). Of note, we demonstrated that chronic CORT treatment decreases BDNF cortical expression levels. This is in agreement with several studies showing decreased BDNF levels subsequent to chronic CORT treatment both in the rat frontal cortex (Dwivedi et al., 2006) and hippocampus (Schaaf et al., 1998, 2000; Dwivedi et al., 2006).
In our study, CORT-induced reduction in both GR and BDNF expression levels was attenuated by DHA. This effect may represent a mechanism by which DHA reverses CORT-induced cellular toxicity. Indeed, DHA has been shown to increase BDNF levels both in vitro (Rao et al., 2007) and in vivo (Lipsky and Marini, 2007; Rao et al., 2007; Wu et al., 2008), suggesting potential neurotrophic and neuroprotective properties. However, at the timepoint of the analysis, the regulation of BDNF transcript was not correlated with the change in protein, which may be due to differences in the rate of transcription and translation and (or) in the half-life and stability of the mRNA and protein molecules (Vogel and Marcotte, 2012). With the noted limitations taken into consideration, it is worth noting that given BDNF’s involvement in neuronal survival and cell plasticity (Lipsky and Marini, 2007) and its expression levels regulated by GR (Chen et al., 2012), it is likely that both GR and BDNF are involved in the DHA-induced reversal of CORT-induced cellular changes in our cortical cultures.
Having established that pretreatment with DHA is able to prevent CORT-induced cellular changes in mixed cortical cultures, future studies should focus on varying the time between each intervention and also investigate coadministration. Moreover, considering the correlation between Western diets, enriched in n-6 PUFAs, and the increased risk of development of stress-related pathologies, such as depression (Quirk et al., 2013), future studies should investigate the effect of n-6 PUFAs such as arachidonic acid in mixed cortical cultures. Arachidonic acid may induce comparable effects to CORT or increase its negative effects in mixed cortical cultures.
It is worth noting that all our results are based on data generated in cell culture systems. Such in vitro paradigms as well as animal models have limitations, and to date none faithfully recapitulate all of the clinical and pathological phenotypes of mental illnesses. Cellular models are instrumental in dissecting a complex pathological process into simpler molecular events. Cell systems appear to be the correct choice for preliminary studies on the molecular action of new drugs or potential toxins and for understanding the role of single genetic factors. Indeed, this approach could lead to transformative new tools for the study of disease mechanisms and can be potentially used for high-throughput drug screening. Moreover, being rodent genome-based they represent a reliable preliminary investigation that requires confirmation in the same species of animal models for the direct investigation of pathophysiological characteristics in far less time and a less labor-intensive manner.
In conclusion, we provided further evidence on the effects of CORT on neuronal apoptosis and astrocyte overgrowth as well as changes in BDNF expression levels and GR downregulation in mixed cortical cultures. Furthermore, we identified DHA as a novel compound able to reverse such changes. This study contributes to our knowledge on the beneficial role of PUFAs that may be considered as future treatment strategies to counteract glucocorticoids-induced impairments in clinical settings.
Statement of Interest
The APC Microbiome Institute has conducted studies in collaboration with several companies including GSK, Pfizer, Cremo, Suntory Wellness, Wyeth, Nutritica, and Mead Johnson. T.G.D. and J.F.C. have spoken at meetings sponsored by food and pharmaceutical companies.
Acknowledgments
This work was supported by Food Institutional Research Measure (grant number 10/RD/TMFRC/709) to T.G.D. and P.K., Science Foundation Ireland in the form of a centre grant (Alimentary Pharmabiotic Centre; grant no. SFI/12/RC/2273) to T.G.D. and J.F.C., and by an Investigator Award (grant no. 12/IA/1537) to Y.N. and J.F.C.
References
