


Abstract
The shortcomings of clonazepam therapy include tolerance, withdrawal symptoms, and adverse effects such as drowsiness, dizziness, and confusion leading to increased risk of falls. Inter-individual variability in the incidence of adverse events in patients partly originates from the differences in clonazepam metabolism due to genetic and nongenetic factors.
Since the prominent role in clonazepam nitro-reduction and acetylation of 7-amino-clonazepam is assigned to CYP3A and N-acetyl transferase 2 enzymes, respectively, the association between the patients’ CYP3A status (CYP3A5 genotype, CYP3A4 expression) or N-acetyl transferase 2 acetylator phenotype and clonazepam metabolism (plasma concentrations of clonazepam and 7-amino-clonazepam) was evaluated in 98 psychiatric patients suffering from schizophrenia or bipolar disorders.
The patients’ CYP3A4 expression was found to be the major determinant of clonazepam plasma concentrations normalized by the dose and bodyweight (1263.5±482.9 and 558.5±202.4ng/mL per mg/kg bodyweight in low and normal expressers, respectively, P<.0001). Consequently, the dose requirement for the therapeutic concentration of clonazepam was substantially lower in low-CYP3A4 expresser patients than in normal expressers (0.029±0.011 vs 0.058±0.024mg/kg bodyweight, P<.0001). Furthermore, significantly higher (about 2-fold) plasma concentration ratio of 7-amino-clonazepam and clonazepam was observed in the patients displaying normal CYP3A4 expression and slower N-acetylation than all the others.
Prospective assaying of CYP3A4 expression and N-acetyl transferase 2 acetylator phenotype can better identify the patients with higher risk of adverse reactions and can facilitate the improvement of personalized clonazepam therapy and withdrawal regimen.
Inter-individual variability in clonazepam metabolism by CYP3A and N-acetyl transferase 2 enzymes was assumed to highly contribute to the incidence of adverse reactions. The patients’ CYP3A4 expression was found to be the major determinant of clonazepam plasma concentrations, whereas CYP3A5 genotype and N-acetyl transferase 2 acetylator phenotype did not influence the steady-state levels of clonazepam. Therefore, CYP3A4 expression-guided clonazepam dosing (0.029mg/kg for low expressers and 0.058mg/kg for normal expressers) was proposed for achieving the optimal plasma concentrations. Furthermore, normal CYP3A4 expression and slow N-acetyl transferase 2 acetylator phenotype evoking high plasma concentration ratio of 7-amino-clonazepam and clonazepam may account for low efficacy or withdrawal symptoms of clonazepam. Prospective assaying of CYP3A4 expression and N-acetyl transferase 2 acetylator phenotype can better identify the patients with higher risk of adverse reactions and facilitate the improvement of personalized clonazepam therapy and withdrawal regimen.
Introduction
Clonazepam was initially introduced as an antiepileptic agent; however, it is a useful therapeutic adjunct in psychiatric disorders (Nardi and Perna, 2006; Mendonca et al., 2015). It is successful in treatment of logorrhea, impulsivity, and grandiosity symptoms in patients with bipolar disorders (Moreno et al., 2004). In schizophrenia, clonazepam is given to decrease the level of agitation, anxiety, and tension or to manage aggression (Bodkin, 1990). Although the precise mechanism of clonazepam action has not been completely clarified, it has been demonstrated that the major targets are GABA-A receptors. Clonazepam potentiates the effect of GABA in the brain by increasing the GABAergic inhibition (Jenner et al., 1986; Lehoullier and Ticku, 1987). It is well tolerated in most of the patients; however, adverse events (e.g., drowsiness, dizziness, and confusion) can occur. The sedative effect seems to be more problematic for the elderly than for younger patients, because changes associated with aging result in greater risk of injuries from falls (Passaro et al., 2000; Pariente et al., 2008; Sylvestre et al., 2012). Long-term clonazepam users may experience pharmacodynamic tolerance and dependence as well as withdrawal symptoms (tremor, dizziness, sweating, headache, seizure) following discontinuation of clonazepam treatment (Chouinard, 2004; Riss et al., 2008). The severity of withdrawal symptoms appears to be influenced by several factors, such as the duration of clonazepam therapy, dosage, and the rate of drug-tapering.
Clonazepam is extensively metabolized by nitro-reduction to 7-amino-clonazepam, which is further N-acetylated to 7-acetamido-clonazepam (Figure 1) (Eschenhof, 1973; Peng et al., 1984a, 1984b). Hydroxylation of these metabolites and the parent compound to the respective 3-hydroxy metabolites has also been reported; however, it is considered to be a minor metabolic pathway (Eschenhof, 1973; de Silva and Bekersky, 1974; Knop et al., 1975). In human plasma, the hydroxylated metabolites were found to be present at very low concentrations or absent, whereas the concentration of 7-amino-clonazepam can be as high as or even higher than the concentration of clonazepam (Naestoft and Larsen, 1974; Sjö et al., 1975). Although no pharmacological activity is attributed to 7-amino-clonazepam, it has some affinity for benzodiazepine receptor and is able to compete with clonazepam. 7-Amino-clonazepam has been assumed to competitively modify the effect of clonazepam on GABA-A response and appears to exert mild effects as a partial agonist for the GABA-A receptor (Munakata et al., 2008). Furthermore, high levels of 7-amino-clonazepam in patients have been associated with withdrawal symptoms (Sjö et al., 1975).
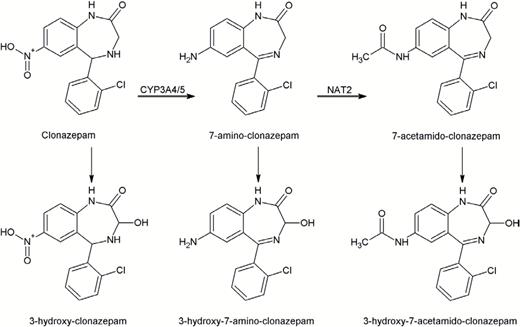
Metabolic pathways of clonazepam.
Nitro-reduction, the major route of clonazepam metabolism, is catalyzed by CYP3A enzymes (Seree et al., 1993), whereas N-acetyl transferase 2 (NAT2) is responsible for the acetylation of 7-amino-clonazepam (Miller et al., 1981; Olivera et al., 2007). CYP3A4 activity displays more than 100-fold inter-individual variability (Temesvári et al., 2012), which is partly attributed to genetic factors. CYP3A4*1B allele leads to increased transcription; however, the clinical significance of CYP3A4*1B to CYP3A4 function is doubtful (Garcia-Martin et al., 2002; Amirimani et al., 2003). CYP3A4*22 displays low hepatic CYP3A4 expression and results in decreased CYP3A4 activity (Okubo et al., 2013). Elens et al. (2013) suggested to evaluate the association between CYP3A4*22 and pharmacokinetic behavior of CYP3A substrates in combination with CYP3A5 genotype. CYP3A5*3 allele results in splicing defect and nonfunctional CYP3A5 protein. Those individuals who have functional CYP3A5 enzyme are presumed to metabolize some CYP3A substrates more rapidly than CYP3A5 nonexpressers. Human NAT2 is a polymorphic gene, generally dividing the population into slow and rapid acetylators (McDonagh et al., 2014). NAT2*4 is the wild-type allele, responsible for rapid acetylator phenotype, whereas NAT2*5, NAT2*6, and NAT2*7, the most common alleles in white populations, are defined as slow acetylator alleles. The polymorphic CYP3A and NAT2 alleles may explain some inter-individual differences in blood concentrations of clonazepam and 7-amino-clonazepam; however, nongenetic factors (hormones, diseases, age, medication) can modify CYP3A4 activities, resulting in transient poor (or extensive) metabolism. The genotype determines the potential for the expression of functional or nonfunctional CYP enzyme, whereas nongenetic factors give rise to altered phenotypes. CYP3A4*1/*1 genotype, predicted to be translated to CYP3A4 enzyme with normal function, may be switched into poor (or extensive) metabolism due to phenoconversion (Shah and Smith, 2015).
Patients’ clonazepam-metabolizing capacity can be estimated by the evaluation of CYP3A status and acetylator phenotype. Although CYP3A5 expressers and slow or rapid acetylators are simply identified by CYP3A5 and NAT2 genotyping, the crucial task is the assessment of hepatic CYP3A4 activity. We previously described a complex diagnostic system (CYPtest) that determines CYP3A-metabolizing capacity by the current CYP3A4 expression in leukocytes. CYP3A4 mRNA levels in leukocytes were proven to inform about the hepatic CYP3A4 activity (Temesvári et al., 2012). Patients with CYP3A4*22 allele are predicted to display decreased CYP3A4 mRNA levels, which lead to permanent low CYP3A4 activity, whereas nongenetic factors modifying the expression of functional CYP3A4 gene result in transient poor (or extensive) clonazepam metabolism.
Information on patients’ CYP3A status and NAT2 genotype can refine the personalized clonazepam therapy, facilitating the appropriate dosage, and can predict the risk of high blood levels of 7-amino-clonazepam requiring more prudent withdrawal strategy for psychiatric patients. The goals of the present work were to investigate the patients’ CYP3A status predicting potential poor or extensive clonazepam metabolism and to analyze the influence of CYP3A4 expression on clonazepam blood concentrations and patients’ dose requirements. We attempted to provide evidence that CYP3A5 and CYP3A4 genotypes are not the only determinant factors in CYP3A metabolizer status, but the expression rate of CYP3A4 gene can highly influence a patient’s CYP3A-metabolizing capacity.
Methods
Patients and Study Design
Inpatients (n=98) diagnosed with schizophrenia, schizoaffective, or bipolar disorders at the Department of Psychiatry and Psychotherapy, Semmelweis University (Budapest, Hungary) were enrolled. The patients on stable clonazepam therapy for at least 1 week were included in the study. Written informed consent was obtained from all participants. The study was approved by the Hungarian Committee of Science and Ethics. It was performed under the regulation of Act CLIV of 1997 on Health and the decree 23/2002 of the Minister of Health of Hungary and in accordance with the declaration of Helsinki.
The patients’ demographic data as well as the details of medication were recorded (Table 1). All of the patients belonged to the Caucasian white population. The patients’ psychotropic therapy generally included antipsychotics (quetiapine, olanzapine, aripiprazole, clozapine, risperidone, or haloperidol), mood stabilizers (valproic acid, lamotrigine, carbamazepine, lithium), and, if necessary, antidepressants (fluoxetine, paroxetine, bupropion, or venlafaxine) or sedatives (zopiclone or zolpidem). The clonazepam therapy was applied according to the conventional clinical protocol, initiated at low dosage (0.5mg/d), and subsequently titrated until optimal clinical response was achieved (0.5–6.5mg/d), generally within 5 days. In urgent cases when agitation, aggression, or mania had to be managed, higher initial doses were administered. Clonazepam dosage was recorded for 1 week before blood sampling for testing patients’ CYP3A status and NAT2 genotype and for drug assay.
Patients’ Demographic Characteristics
| Patients’ Demographic Data | ||
|---|---|---|
| Number | 98 | |
| Gender (male, female) | m: 39 f: 59 | |
| Age (y)a | 43 (19; 70) | |
| Bodyweight (kg)a | 73.7 (61.25; 87) | |
| Primary disease | Schizophrenia | 47 |
| Schizoaffective disorder | 33 | |
| Bipolar disorder | 18 | |
| Clonazepam dosea | (mg/d) | 2 (0.5; 6.5) |
| (mg/bodyweight) | 0.02667 (0.0023; 0.12) | |
| Co-medication | Aripiprazole | 10 |
| Clozapine | 12 | |
| Haloperidol | 21 | |
| Olanzapine | 40 | |
| Quetiapine | 28 | |
| Risperidone | 34 | |
| Carbamazepine | 4 | |
| Lamotrigine | 5 | |
| Lithium | 16 | |
| Valproic acid | 22 | |
| Bupropion | 5 | |
| Fluoxetine | 2 | |
| Paroxetine | 5 | |
| Venlafaxine | 2 | |
| Zolpidem | 6 | |
| Zopiclone | 1 |
aMedian (min; max).
Assaying CYP3A Status and NAT2 Genotype
Patients’ CYP3A status was characterized by CYP3A5 genotyping and assaying CYP3A4 expression in leukocytes. Genomic DNA and leukocytes were isolated from the peripheral blood samples according to the methods described by Temesvári et al. (2012). CYP3A5 genotyping was carried out by hydrolysis single nucleotide polymorphism analysis for CYP3A5*3 using TaqMan probes (BioSearch Technologies, Novato, CA). Genetic polymorphisms of CYP3A4 are assumed to influence CYP3A4 expression (Garcia-Martin et al., 2002; Amirimani et al., 2003; Okubo et al., 2013); thus, CYP3A4 genotype for CYP3A4*1B and CYP3A4*22 alleles was also assayed by hydrolysis single nucleotide polymorphism analysis using TaqMan probes (BioSearch Technologies).
For CYP3A4 expression, total RNA was extracted from leukocytes, RNA (3 μg) was reverse transcribed into single-stranded cDNA using the Maxima First Strand cDNA Synthesis Kit (Thermo Scientific, Waltham, MA), and then real-time PCR with human cDNA was performed using KAPA Fast Probes Mastermix (KAPA Biosystems, Cape Town, South Africa) and UPL probe for CYP3A4 (Roche Diagnostics GmbH, Mannheim, Germany). The quantity of CYP3A4 mRNA relative to that of the housekeeping gene glyceraldehyde 3-phosphate dehydrogenase was determined. Three categories of CYP3A4 expression were applied to describe low, normal, and high expressers. The cut-off values for the CYP3A4 mRNA levels in leukocytes have been previously established on the basis of the cut-off values for the hepatic CYP3A4 activities (nifedipine oxidation or midazolam 1’- and 4-hydroxylation) (Temesvári et al., 2012). Low expressers displayed a ratio of CYP3A4/glyceraldehyde 3-phosphate dehydrogenase <10–6, normal expressers a ratio between 10–6 and 10–4, whereas high expressers a ratio >10–4. The patients were sorted by the CYP3A5 genotype and by CYP3A4 expression. Those subjects who carry at least one CYP3A5*1 allele were considered to be CYP3A5 expressers, while those with CYP3A5*3/*3 genotype were CYP3A5 nonexpressers. By the CYP3A4 mRNA levels, they were assigned to low, normal, and high CYP3A4 expresser categories.
NAT2 acetylation phenotype was inferred from the 4-SNP panel of 191G>A (rs1801279), 341C>T (rs1801280), 590G>A (rs1799930), and 857G>A (1799931), distinguishing the slow acetylator NAT2*5, NAT2*6, NAT2*7, and NAT2*14 alleles from the rapid acetylator alleles (Doll and Hein, 2001; Hein and Doll, 2012). Patients with 2 slow acetylator alleles were assigned to the slow acetylator phenotype category, whereas all the others were considered to display rapid/intermediate acetylator phenotype.
Blood Concentrations of Clonazepam and 7-Amino-Clonazepam
The blood samples were taken 12 hours after the evening dose of clonazepam. The steady-state concentrations of clonazepam and 7-amino-clonazepam were determined by liquid chromatography coupled with tandem mass spectrometry. Chromatographic separation was performed using an Inertsil ODS-4 (75×2.1mm, 3 μm) column (GL Sciences Inc., Tokyo, Japan) and mobile phases of acetonitrile and 0.1% formic acid in gradient running mode. The samples were analyzed using positive electrospray ionization and multiple reaction monitoring mode for quantitation of the parent compound and its metabolite. The following transitions were used: 316/270 (m/z), 316/214 (m/z) for clonazepam and 286/222 (m/z), 286/121 (m/z) for 7-amino-clonazepam. The assay range was 1 to 100ng/mL for both clonazepam and 7-amino-clonazepam. The intra- and inter-day variability for the quantification was <10%. Normalized blood levels of clonazepam were calculated by dividing the concentration values by the corresponding 24-h dose on a mg/kg bodyweight basis and expressed as (ng/mL)×(mg dose/kg bodyweight)-1.
Data Analysis
Statistical significance of demographic data, CYP3A4 expression, NAT2, and CYP3A5 genotypes as covariates of clonazepam and 7-amino-clonazepam concentrations was analyzed by ANOVA using linear model of covariate effects with constant terms. Several mathematical models (nonlinear Artificial Neuronal Network and linear with various input combinations) were tested to identify the key factor(s) in steady-state clonazepam concentrations; however, the best models for the optimal prediction with the smallest standard deviation of model prediction and the smallest number of model parameters were all linear. The dose, bodyweight, and CYP3A4 expression were identified as significant parameters for clonazepam plasma concentration (P<.0005), whereas clonazepam plasma concentration, CYP3A4 expression and NAT2 genotype were identified as significant parameters for 7-amino-clonazepam (P<.005). However, for 7-amino-clonazepam, only the combination of normal CYP3A4 expressers and slow NAT2 metabolizers formed a group with slower pharmacokinetics and therefore higher 7-amino-clonazepam plasma concentrations.
The statistical model for the clonazepam plasma concentration based on ANOVA analysis and for the effects of dose and bodyweight on the concentration is therefore defined as:
where cclo is clonazepam predose plasma concentration expressed as ng/mL, dose is clonazepam dose in mg, and bw is bodyweight in kg. Model parameters k0 and k1 were estimated for low and normal or high CYP3A4 expressers individually. The statistical model for the 7-amino-clonazepam plasma concentration based on ANOVA analysis is defined as:
where c7-amino-clo is 7-amino-clonazepam plasma concentration (ng/mL) and cclo is clonazepam plasma concentration (ng/mL). Model parameters k0 and k1 were estimated individually for 2 groups. The first group comprised all low CYP3A4 expressers regardless of the NAT2 phenotype and normal/high CYP3A4 expressers in combination with rapid NAT2 metabolizers. In the second group, the patients were normal/high CYP3A4 expressers and slow NAT2 acetylators. Linear regression was used to estimate the model parameters k1 and k0. Residual error of both models was used to estimate the model precision. To estimate optimal dose, the model for clonazepam plasma concentration was resolved for the dose:
The lower and upper limits for the optimal dose were estimated from the lower and upper limits of the optimal clonazepam plasma concentration range of 20 to 70ng/mL. Matlab R2009b was used to perform the analysis and calculate the optimal dosing.
For statistical analysis, the data of normalized clonazepam plasma concentrations, the 7-amino-clonazepam:clonazepam ratio, and the dose requirements for the optimal therapeutic level in the patients assigned to various CYP3A4 expression were expressed as the mean±SD. Between-group differences were calculated by the use of Kruskal-Wallis ANOVA followed by Mann-Whitney comparison test. P<.05 was considered statistically significant.
Results
Patients’ Drug-Metabolizing Capacity and Clonazepam Exposure
Most of the patients involved in the study were identified as CYP3A5 nonexpressers (CYP3A5*3/*3) and were thus expected to lack of functional CYP3A5 enzyme (Table 2). Eight patients carrying CYP3A5*1/*3 heterozygous genotypes were considered to be CYP3A5 expressers. The frequency of CYP3A5*3 allele in the patients (91.8%) was similar to that in Caucasian (white) populations (88–97%) (Kurose et al., 2012; Zanger and Schwab, 2013). For the categorization of the patients regarding CYP3A4 expression, more reliable results were obtained from CYP3A4 mRNA measurements than from CYP3A4 genotyping. One-fifth of the patients carried expression-altering mutations in CYP3A4 gene (CYP3A4*1B or CYP3A4*22); 3 of the 98 patients carried CYP3A4*1/*1B genotype, and 17 carried CYP3A4*1/*22 (homozygous mutant CYP3A4 genotypes were not identified in the patients) (Table 2). However, we could not demonstrate any association between CYP3A4 genotype and CYP3A4 expression. The ratio of low and normal CYP3A4 expressers among the patients with CYP3A4*1/*1B or CYP3A4*1/*22 genotypes were similar to those carrying CYP3A4*1/*1. CYP3A4 expression assays revealed that about three-fourths of the patients expressed CYP3A4 at normal level, >20% were low CYP3A4 expressers, and only 1 patient displayed high CYP3A4 expression (Table 2). The patients’ demographic parameters may explain the variability of CYP3A4 expression; however, no association was found between the gender or age and CYP3A4 mRNA levels. Since psychiatric patients are often under multi-drug therapy, co-medication is a potential factor that can modify CYP3A4 function. The majority of the psychotropic agents administered to the patients involved in the present study are primarily metabolized by CYP2D6, CYP2B6, or CYP1A2 (aripiprazole, clozapine, haloperidol, olanzapine, quetiapine, risperidone, lamotrigine, bupropion, fluoxetine, paroxetine, venlafaxine) or by non-CYP enzymes (valproic acid). The CYP3A4 inducer carbamazepine included in the therapeutic regimen of 4 patients can potentially increase CYP3A4 expression (Lai et al., 1978; Spina et al., 1996); however, these patients still expressed CYP3A4 at low or normal level. The CYP3A4 substrates zolpidem and zopiclone were not applied regularly, but in case of need.
Patients’ CYP3A Status and NAT2 Acetylator Phenotype
| n | % | ||
|---|---|---|---|
| CYP3A Status | |||
| CYP3A5 genotype | CYP3A5 expresser (CYP3A5*1/*3) | 8 | 8.2 |
| CYP3A5 nonexpresser (CYP3A5*3/*3) | 90 | 91.8 | |
| CYP3A4 genotype | CYP3A4*1/*1 | 78 | 79.6 |
| CYP3A4*1/*1B | 3 | 3.1 | |
| CYP3A4*1/*22 | 17 | 17.3 | |
| CYP3A4 expression | Low | 22 | 22.4 |
| Normal | 75 | 76.5 | |
| High | 1 | 1.02 | |
| NAT2 Phenotype | |||
| Slow acetylator | 52 | 53.1 | |
| Rapid/intermediate acetylator | 46 | 46.9 |
NAT2 acetylator phenotype discrimination by 4-SNP panel recommended for accurate assignment of NAT2 alleles (Hein and Doll, 2012) identified 341T>C and 590G>A as the most frequent SNPs (34.7% and 35.7, respectively), whereas the frequency of 857G>A was merely 2.04% and 191G>A did not occur at all. Of 98 patients, 52 were assigned to the slow acetylator phenotype category and 46 were considered to be NAT2 rapid or intermediate acetylator (Table 2).
The present study evaluated the association between the patients’ drug-metabolizing capacity (CYP3A4 expression, CYP3A5 genotype, NAT2 acetylator phenotype) and their clonazepam therapy (dose or dose/bodyweight, clonazepam plasma levels), which can contribute to the improvement of patients’ personalized medication. The patients’ CYP3A5 genotype and NAT2 acetylator phenotype seemed to have no effect on clonazepam plasma concentrations, whereas CYP3A4 expression significantly influenced the steady-state levels of clonazepam. The models required clonazepam dose divided by the patients’ bodyweight for the optimal prediction. For the patients expressing CYP3A4 at low and normal levels, 2 separate models were constructed with the same equation but with different values of parameters (k0 and k1, Figure 2a). The models were able to predict clonazepam plasma concentrations with SDs of 6.2 and 6.7ng/mL for low and normal expressers, respectively.
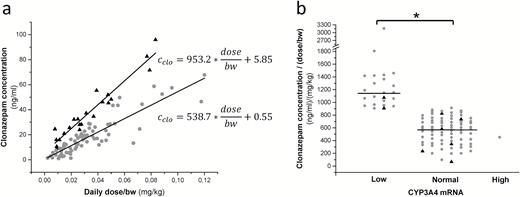
Influence of the patients’ CYP3A4 expression on clonazepam plasma concentrations. (a) Linear models for low (triangles) and normal (points) CYP3A4 expresser patients, and (b) clonazepam concentrations normalized by dose and bodyweight in the patients expressing CYP3A4 at low, normal, and high levels. Black triangles indicate patients carrying CYP3A5*1. *P<.0001.
The statistical analysis displayed significant association between the patients’ CYP3A4 expression and the stable plasma concentrations of clonazepam normalized by the dose and the patient’s bodyweight. The normalized concentrations of clonazepam were significantly higher in the patients displaying low CYP3A4 mRNA levels (1263.5±482.9ng/mL per mg/kg bodyweight) than normal CYP3A4 expressers (558.5±202.4ng/mL per mg/kg bodyweight) (P<.0001) (Figure 2b). The normalized clonazepam concentration in the patient expressing CYP3A4 at high level (452.6ng/mL per mg/kg bodyweight) was comparable with those in the normal expresser patients.
Optimization of Clonazepam Dose
According to the clinical practice, clonazepam plasma concentrations ranging between 20 and 70ng/mL are considered to be therapeutically optimal in the management of anxiety and tension in schizophrenic patients or impulsivity and grandiosity symptoms in patients with bipolar disorders (Hiemke et al., 2011). The 2 models for prediction of clonazepam plasma concentration in patients expressing CYP3A4 at low or normal levels had comparable prediction quality (Figure 2a) and were found to be applicable for prediction of optimal dosing. The dose requirement for therapeutic plasma concentration was predicted for each patient setting the minimal dose adjustment to 0.5mg, because the lowest content of clonazepam products available is 0.5mg (Figure 3a). The models proposed significantly higher daily dose of clonazepam for the patients expressing CYP3A4 at normal level than for those with low CYP3A4 mRNA level (the dose range of 4.47–7.84mg vs 2.23–4.22mg, P<.0001), whereas the dosage applied in the clinical practice was considered to be the same for low and normal CYP3A4 expresser patients (2.28±1.56mg vs 2.47±1.58mg, P=.5237). The clonazepam daily dose applied for the patients was found to be out of the dose range predicted from the models in about 70% of the patients, that is, most of the patients were misdosed. Underdosing occurred more frequently, primarily in the patients expressing CYP3A4 at normal level (Figure 3a). Moreover, the routine dosing regimen appears to be appropriate for the patients with low CYP3A4 mRNA levels rather than for normal expressers. Of 22 low expresser patients, only 9 were misdosed (3 overdosed and 6 underdosed), whereas the clonazepam therapy of 13 patients (about 60%) in the low CYP3A4 expresser group resulted in therapeutic plasma concentrations of clonazepam. The mathematical model displayed clonazepam dosing to be optimal for only 15 patients (20%) in the normal CYP3A4 expresser group (n=76), although the plasma concentrations were in the therapeutic range in 25 normal expresser patients. Therefore, we took a different approach for the calculation of clonazepam dose requirement, and we inferred from the dosing applied for those patients who displayed plasma concentrations in the range of 20 to 70ng/mL (Figure 3b). The patients expressing CYP3A4 mRNA at low levels required significantly lower dose of clonazepam for the optimal plasma level than normal CYP3A4 expressers. The dose requirement was approximately 50% lower for the low CYP3A4 expresser patients (0.029±0.011mg/kg bodyweight) than for the patients in the normal CYP3A4 expresser group (0.058±0.024mg/kg bodyweight) (P<.0001) (Figure 3b).
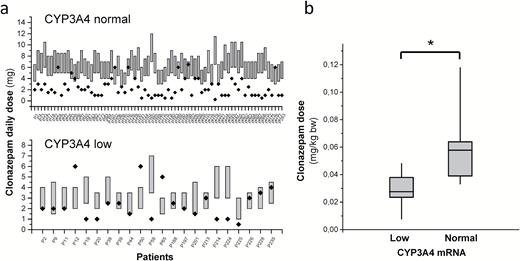
Influence of the patients’ CYP3A4 expression on clonazepam dose requirements. (a) Dose requirements for therapeutic concentration of clonazepam calculated from the models (bars) and applied clonazepam doses (points) in normal and low CYP3A4 expresser patients, and (b) dose requirements calculated from applied doses in the patients displaying therapeutic concentrations of clonazepam. * P<.0001.
7-Amino-Clonazepam Concentration in Patients with Various Drug-Metabolizing Capacity
CYP3A4 catalyzes the formation of 7-amino-clonazepam, and NAT2 is involved in the N-acetylation of 7-amino-clonazepam. Thus, the role of the patients’ CYP3A4 expression and NAT2 acetylator phenotype in the plasma concentrations of 7-amino-clonazepam was evaluated. The patients were divided into 4 groups according to the CYP3A4 expression (low and normal/high) and NAT2 phenotype (slow and rapid/intermediate). Significantly higher (about 2-fold higher) plasma concentration ratio of 7-amino-clonazepam and clonazepam was observed in the patients displaying normal CYP3A4 expression and slow N-acetylation than in all the others (Figure 4a). However, modeling of the association between the patients’ CYP3A4 expression or N-acetylator phenotype and plasma concentrations of 7-amino metabolite identified 2 cohorts. The first group consisted of the patients who expressed CYP3A4 mRNA at normal/high level and displayed slow NAT2 acetylator phenotype. The remaining 3 combinations (low CYP3A4 expressers with any acetylator phenotype, normal/high CYP3A4 expressers with rapid/intermediate acetylator phenotype) were grouped, since the separate models for these combinations did not result in significantly different parameters. The same model was applied for the 2 groups; however, the model parameter values were different (Figure 4b). The models were able to predict the plasma concentrations of 7-amino-clonazepam with the SDs of 4.5 and 4.9ng/mL for the normal CYP3A4 expressers with slow N-acetylation phenotype and the rest of the patients, respectively.
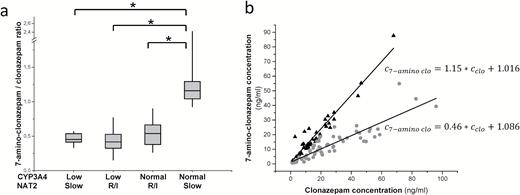
Influence of the patients’ CYP3A4 expression and N-acetyl transferase 2 (NAT2) acetylator phenotype on the concentration ratio of 7-amino-clonazepam and clonazepam. (a) 7-Amino-clonazepam/clonazepam concentrations in patients with various CYP3A4 expression and NAT2 acetylator phenotype, and (b) linear models for normal CYP3A4 expresser slow NAT2 acetylator patients (triangles) and for the others (points). R/I rapid and intermediate NAT2 acetylators, *P<.0001.
Discussion
Clonazepam is extensively metabolized, and <2% of the administered dose is eliminated as unchanged parent compound. Although the plasma concentration in patients seems to be strongly influenced by their clonazepam-metabolizing capacity and the therapeutic drug monitoring for clonazepam is considered to be useful (Hiemke et al., 2011), it is not a routine clinical practice in psychiatry. The primary role of CYP3A4 enzyme in clonazepam biotransformation has been verified (Seree et al., 1993), but the dosing strategy applied in clinical practice does not take the patient’s hepatic CYP3A4 activity into consideration. According to our results, low CYP3A4 expression was accompanied with significantly higher plasma concentrations of clonazepam. Age-related decline in CYP-mediated drug metabolism is well known (Tanaka, 1998); thus, a higher ratio of low CYP3A4 expressers is expected in geriatric population than in younger adults. Misdosing of low expresser patients results in an overexposure to clonazepam, which can eventually lead to an increased risk of side effects. Side effects, such as drowsiness, ataxia, and dizziness, have been reported to develop in the majority of cases for plasma concentrations >60ng/mL, and toxic effects increase in severity for levels >100ng/ml (Morselli and Franco-Morselli, 1980). Since clonazepam can cause gait and balance disturbances, increased risk of falling is expected in the patients displaying low CYP3A4 expression, for example, in the elderly population. Several authors have indicated that benzodiazepine therapy is a potential risk factor for injurious falls in elders (Ray et al., 2000; Souchet et al., 2004; Pariente et al., 2008). Ray et al. (2000) demonstrated an association between the use of benzodiazepines with long elimination half-lives (e.g., clonazepam) and increased risk of falls, whereas Herings et al. (1995) reported significantly higher incidence of falls in patients exposed to high doses of benzodiazepines. Sylvestre et al. (2012) suggested benzodiazepine-specific analysis, because the mechanisms influencing the risk of falls differ across benzodiazepines. For clonazepam, the duration of past treatment was found to be a more important risk factor over the dose. Estrin et al. (2009) suggested a fall prevention program at psychiatric hospitals to identify patients at high risk of falling. Our present work provided clear evidence for that the inter-individual variability in clonazepam metabolism can be estimated by the analysis of patients’ CYP3A4 expression. The oral clearance of clonazepam was observed to be significantly higher in the patients expressing CYP3A4 at a normal or high level than in low CYP3A4 expressers; thus, one-half of the doses needed for low expressers as for normal/high CYP3A4 expressers to maintain the target therapeutic concentrations of clonazepam. CYP3A4-phenotyping can contribute to the identification of high-risk patients and advances the rationalization of clonazepam therapy.
The plasma concentration of the main metabolite, 7-amino-clonazepam, is often comparable with the concentration of clonazepam, and a considerable amount is also present in the brain. 7-Amino-clonazepam is considered to be pharmacologically inactive; however, Munakata and Tsuchiya (2008) have demonstrated that it is a weak partial agonist for GABA-A receptor, and it can competitively modify the effect of clonazepam. 7-Amino metabolite of clonazepam at a high concentration might significantly compete to occupy benzodiazepine-binding sites and cause a more rapid decrease of clonazepam binding when the concentration decreases after discontinuation of clonazepam therapy. Therefore, clinical consequences may be anticipated for the patients with high levels of 7-amino-clonazepam during clonazepam withdrawal. According to our findings, normal/high CYP3A4 expression and slow NAT2 acetylator phenotype appear to predict high plasma concentrations of 7-amino-clonazepam. While the rate of primary metabolism of clonazepam is influenced by CYP3A4 activity, the plasma concentration of 7-amino-clonazepam depends on CYP3A4 and NAT2 acetylator phenotype, and the slow acetylation rate can obviously explain the accumulation of the primary metabolite. Since most of the patients (77.5% in this study) expressed CYP3A4 at normal/high level and approximately one-half of the patients were slow acetylators, high plasma concentrations of 7-amino-clonazepam were anticipated in 35% to 40% of patients (38/98 in this study). Furthermore, patients with high 7-amino-clonazepam levels have been found to display withdrawal symptoms (Sjö et al., 1975). A careful and protracted withdrawal regimen can be suggested to apply for normal CYP3A4 expresser patients with slow NAT2 acetylator phenotype to avoid withdrawal symptoms or to minimize the severity of symptoms. Nardi et al. (2010) recommended a 0.25-mg/wk rate of dosage reduction after intermediate-term use of clonazepam; however, the potential benefits of personalizing discontinuation are worthy of investigation.
In conclusion, the patients’ CYP3A4 expression generally influenced by nongenetic factors was found to be the major determinant of clonazepam plasma concentration normalized by the dose and bodyweight; thus, prospective assaying of patients’ CYP3A4 expression can identify poor metabolizers with higher risk of side effects, including dizziness and injurious falls. CYP3A4 expression guided refinement of clonazepam therapy can contribute to the avoidance of misdosing-induced side effects in patients. The plasma concentrations of 7-amino-clonazepam metabolite were found to be associated with the patients’ CYP3A4 expression and NAT2 acetylator phenotype. The knowledge of patients’ CYP3A4 expression and NAT2 acetylator phenotype may improve the clonazepam withdrawal regimen. Tailored medication controlled by patients’ CYP3A4 expression and NAT2 phenotype can facilitate the improvement of the individual clonazepam therapy, leading to the dosage optimization for a more effective therapy and minimizing the risk of side effects and withdrawal symptoms. Further prospective studies evaluating the clinical outcome are warranted to determine the efficacy, safety, and risk/benefit of CYP3A4 and NAT2 guided clonazepam therapy over conventional clinical practice.
Statement of Interest
None.
Acknowledgments
The authors are indebted to Mária Szabó for her skillful assistance in this study. This work was supported by the grants from the Hungarian Research Fund (OTKA K104459 and K104738).
References
Author notes
Correspondence: Katalin Monostory, PhD, Research Centre for Natural Sciences, Hungarian Academy of Sciences, Magyar Tudósok 2, H-1117 Budapest, Hungary ([email protected]).
