


Abstract
The process of the impinging of a droplet upon a heated flat solid surface was computationally studied to identify the key process occurring in a liquid droplet. A computational fluid dynamics model, based on the volume of fluid (VOF) approach, was used to simulate the impact of droplet dynamics on the heated flat solid surface. Surface tension and wall adhesion phenomena were taken into account in this model. The model was proved effective by comparing the simulation results with the experimental data in the literature. It could be concluded that the VOF-based model was able to simulate the dynamics of the impinging of a droplet upon a heated solid surface. The key characteristics of droplet evaporation and the interaction between the droplet and the solid surface could be captured.
1 INTRODUCTION
As a droplet impinges on an isothermal flat solid surface, it spreads on the surface under the influence of the momentum of the liquid and the gravitational force. This is the spreading stage. As the droplet spreads, surface tension and viscous forces retard the advancing motion of the interface. As a result of these forces, the liquid–gas interface ceases to exist while the droplet assumes its maximum spread diameter. Then the surface tension pulls the interface back inward and the droplet starts its motion during the recoil process, which is called the recoiling phase. When the temperature of the surface is higher than that of the droplet, the droplet will evaporate, while it spreads and recoils, and the dynamic process turns more complex.
The flow of liquids over heated solid surfaces occurs in a variety of engineering and technological applications, e.g. in falling-film evaporators, structured reactors and monoliths, packed beds, surface coating, printing and many more. In these processes, the impacting, spreading and evaporation of liquid droplets on solid surfaces play a crucial role. Consequently, the solid/liquid/gas interfacial phenomena need to be studied, and some researchers have carried out experimental studies. For example, Crafton and Black [1] experimentally observed the evaporation rates of small liquid droplets and measured heat transfer rates when individual droplets evaporated on a horizontal heated surface. From the measured quantities, the contact angle and evaporation rates were calculated and used to predict the heat transfer rate on the surface. The results show that the trends in the wetted diameter, height and contact angle for water droplets are fundamentally different from the geometric changes for heptane droplets. Bhardwaj et al. [2] investigated the coupling of fluid dynamics, heat transfer and mass transfer during the impact and evaporation of droplets on a heated solid substrate. A laser-based thermoreflectance method was used to measure the temperature at the solid–liquid interface. The results showed that the interfacial temperature first increases exponentially and then decreases linearly. Shen et al. [3] examined the hydrodynamics and temperature characteristics of distilled de-ionized water droplets impinging on smooth and nano-structured surfaces using high-speed and infrared imaging. Results for a smooth and nano-structured surface for a range of surface temperatures were compared. Droplet impact velocity, transient spreading diameter and dynamic contact angle were measured. The near surface average droplet fluid temperatures were evaluated for conditions of evaporative cooling and boiling. Chatzikyriakou et al. [4] introduced an experimental method to measure the heat transfer between a hot surface and a non-wetting droplet. The authors proved that the methods could well be used to make direct measurements of the very small amounts of heat extracted during the very brief interactions of a water droplet bouncing, without wetting, from a hot surface. Hung et al. [5] studied the initial wetting velocity for a water droplet impinging on glass and parafilm surfaces using a high-speed video camera system. The experiments were conducted by varying the impact velocity and droplet volume on glass and parafilm surfaces. The whole profiles of the impinging droplets were analyzed to determine the droplet-wetting diameter and the movement of the three-phase contact circle, which resulted in the dynamic wetting velocity. In recent years, computational fluid dynamics (CFD)-based models were used to simulate the complex hydrodynamics during the process of the impact of a liquid droplet on a solid surface. With such CFD models, the shape of the droplet formed on the surface could be predicted. Strotos et al. [6] used a modified version of the VOF methodology to simulate the evaporation of droplets impinging and depositing on heated solid walls to account for heat transfer and surface vaporization processes. The numerical methodology was coupled with an evaporation model predicting locally the variable droplet surface liquid vaporization process. Nikolopoulos et al. [7] investigated numerically the evaporation process of n-heptane and water liquid droplets impinging on a hot substrate. Three different temperatures were investigated, covering flow regimes below and above the Leidenfrost temperature. The Navier–Stokes equations expressing the flow distribution of the liquid and gas phases, coupled with the volume of fluid (VOF) method for tracking the liquid–gas interface, were solved numerically using the finite volume methodology. The results indicated the outcome of the impingement and the droplet shape during the impingement process. Also the droplet evaporation rate and the temperature and vapor concentration fields were provided by the computational model. Strotos et al. [8] numerically predicted the evaporation process of a droplet consisting of one or two components at various concentrations using the Navier–Stokes equation numerical methodology coupled with an evaporation model and the VOF methodology, utilizing an unstructured dynamically adapting computational grid. Investigation of the flow field is presented along with the temperature and concentration fields. Also, parametric studies are presented revealing the nature of multi-component droplet evaporation with the details of the flow, the temperature and concentration fields. However, in these references, the interaction between the droplet and the heated surface was not interpreted clearly.
In the present work, the process of the impact of a liquid droplet on a heated flat solid surface was simulated when considering the interfacial forces of solid–liquid and liquid–gas. The overall goal is to show the droplet shape and to analyze the factors that affect the deformation and evaporation process. The experimental data in the literature were compared with the simulation results, and good agreement was obtained.
2 COMPUTATIONAL MODEL
The VOF method, developed by Hirt and Nichols [9], is one of the most widely used methods in simulating free surfaces. This is a fixed-mesh method, in which the interface between immiscible fluids is modeled as the discontinuity in characteristic function (such as volume fraction). Yan et al. [10] simulated the dynamic deformation of a droplet after impact on an isothermal flat solid surface. In this paper, the VOF method was applied to simulate a droplet impact on a heated flat solid surface. Gas and liquid phases were assumed as incompressible, Newtonian fluids with constant values of density, viscosity and surface tension. The flow was assumed to be laminar. A single velocity characterizes the fluid motion prior to impact; that is to say, before the impact, the internal circulation of the fluid within the droplet is neglected. The influence of the surrounding gas phase on the liquid phase during the impact is negligible (which implies that viscous stresses at the surface were assumed to be zero).
2.1 Model equations
-
: the cell is empty (of the kth fluid);
-
: the cell is full (of the kth fluid);
-
: the cell contains the interface between the kth fluid and one or more other fluid.
The surface normal n was evaluated in interface-containing cells and required knowledge of the amount of fluid volume present in the cell. A geometric reconstruction scheme (based on piecewise linear interface calculation) was used to calculate the interface position in the cell.
2.2 Solution domain and computational grid
The computational grid was generated using GAMBIT 2.0. Simulations were carried out in a 6 × 7 mm axis-symmetric 2D domain. Because the free surface between gas and liquid significantly changes with the shape and location during the simulation, a uniform grid was used. During the simulations, the flow field near the outer surfaces was monitored to ensure that no significant flow occurs there, which indirectly indicates that the size of the domain would not affect the simulation results. Simulations were initially carried out using different grids. These results will be discussed later in Section 3.
2.3 Boundary conditions and numerical solution
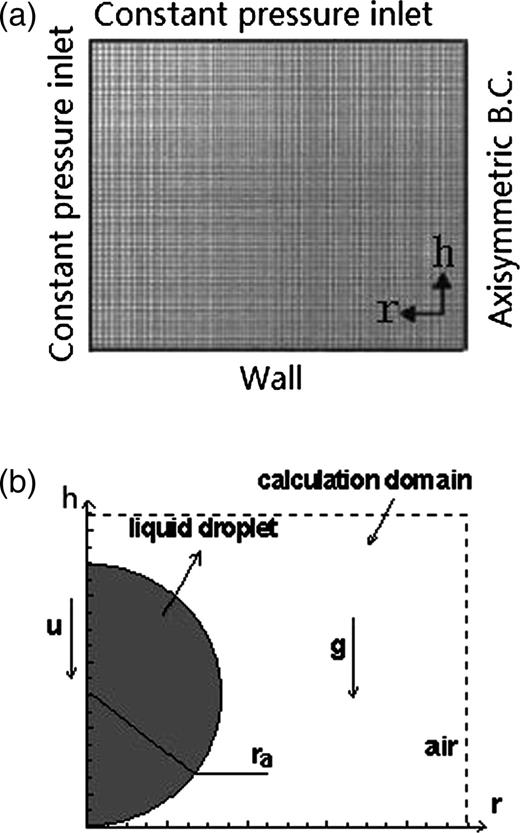
(a) Solution domain and boundary conditions. (b) Typical initial condition and calculation domain.
As shown in Figure 1b, a sphere that was marked in the calculation domain was the initial position of the liquid droplet. The liquid-phase volume fraction was patched as unity (α2 = 1) in this marked sphere. The droplet impact velocity was measured from images acquired by the CCD camera in Gunjal et al. [12] and was assigned to the liquid phase while initiating the simulation. This condition was assumed to be the initial condition at time t = 0. A typical flow field inside and around the droplet was shown in Figure 1b (assumed as t = 0).
With the boundary and initial conditions, the mass and momentum equations were solved using a second-order implicit method for space and a first-order implicit method for time discretization. Pressure interpolation was performed using a body-force-weighted scheme. This scheme is useful when the body force is comparable with the pressure force. The pressure implicit with splitting of operator (PISO) algorithm was used for the pressure–velocity coupling in the momentum equation. A time step was 4 μs; 30 internal iterations per time step were performed, which were found to be adequate for decreasing the normalized residuals to below 1 × 10⁻³. Simulated results were stored for every 2 ms interval.
3 RESULTS AND DISCUSSION
Behavior of a liquid droplet after impact on a solid surface is determined by interactions of inertial, viscous and surface forces. The droplet impact velocity, viscosity and the nature of the solid surface (such as CA) are the key parameters. It should be noted that the dynamic contact angle (DCA) plays an important role in the problem of impinging of a droplet, as referred to in Liu [13]. It decides the shape of the droplet during spreading. In the present work, we fixed the DCA as the SCA. The liquid properties are given in Table 1.
Liquid properties
| Liquid | Density (ρ) (kg/m3) | Viscosity (μ) (mPa s) | Surface tension (σ) (N/m) |
|---|---|---|---|
| Water | 996 | 1.0 | 0.073 |
| Glycerin | 1220 | 116.0 | 0.063 |
| Liquid | Density (ρ) (kg/m3) | Viscosity (μ) (mPa s) | Surface tension (σ) (N/m) |
|---|---|---|---|
| Water | 996 | 1.0 | 0.073 |
| Glycerin | 1220 | 116.0 | 0.063 |
3.1 Verification of the model
Figure 2 shows the comparison of the experimental data in Ted et al. (1997) [14] and simulation results of the impact sequence of a 2.7 mm water droplet on a paraffin wax surface. The impact velocity was 1.58 m/s with an associated droplet with the Reynolds number of 4257, and the Weber number of 92. The SCA was 96°. At t = 0 ms, just before impact, the droplet was clearly spherical in shape. It deformed and spread rapidly after impact in the radial direction, out from the point of impact beneath the droplet, due to the rapid pressure increase at the point of impact. A raised rim was formed at the periphery at t = 0.8 ms due to surface tension that limited the spread and decelerated the radial flow close to the periphery. After t = 4 ms, the rate of spread slowed down. At t = 8 ms, the droplet reached its maximum spread and was momentarily at rest because of the depletion of kinetic energy. The initial impact energy of the droplet was dissipated in overcoming viscous flow and in producing new surface area. After the droplet reached the maximum spread, it recoiled as a result of the large surface energy of the droplet–solid system. At t = 24 ms, the tip of the cone detached from the wax surface. Finally, the contact area shrank to zero as the whole droplet rebounded from the surface at t = 28 ms. Under the influence of gravity, the droplet fell back to the wax surface, and further droplet spread and recoil sequences occurred with decreasing amplitude and frequency until the excess energy of the droplet was dissipated. Equilibrium was finally achieved at t≈80 ms. It could be found that good agreement could be obtained between the experimental results and the simulation results. The model proved to be correct.
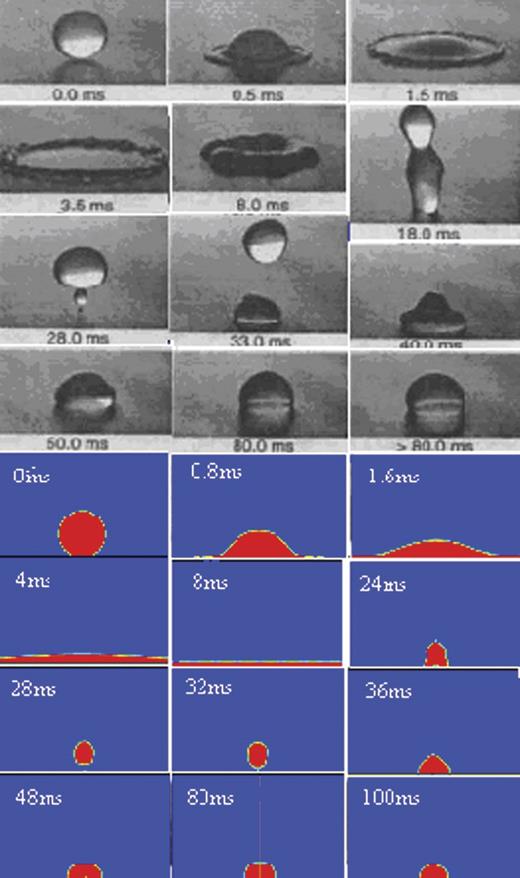
Comparison of the experimental and simulation results of the drop dynamics for 2.7-mm drop (upper: experimental results; below: simulation results).
3.2 Effect of droplet temperature on droplet volume
Simulations for a 2.5 mm drop diameter with an impact velocity of 0.3 m/s were carried out with the initial temperatures of the droplet of 20, 50 and 100°C, respectively, when the heating temperature is 100°C. The ratio of the droplet volume to its initial volume with dimensionless time was shown in Figure 3. It can be seen that at three droplet temperatures, the volume ratio decreased with time, which revealed that the droplet evaporated while it deformed after impinging. However, the volume ratio changes tendencies at three droplet temperatures and showed different characteristics. At the two lower droplet temperatures, the volume ratio declined slightly with time in the initial stage of the deformation process after impacting, when the evaporation had not started to dominate the droplet deformation. This is because first, the droplet was heated by conduction by the hotter solid surface and once the temperature of the droplet–solid interface reached saturation, evaporation began and the volume ratio decreased, but the evaporation was slow. With further heat transfer, more and more liquid in the droplet reached saturation, and so the evaporation occurred rapidly fast. From a dimensionless time of ∼7, the lines at two lower droplet initial temperatures began to fall and that indicated that there was distinct evaporation. While for the 100°C initial droplet temperature, in the beginning, the volume ratio decreased more distinctly than that at the other two initial temperatures. This is because this initial droplet temperature had attained the saturation value, and in the spread stage, it began to evaporate violently. So the volume ratio decreased more distinctly.
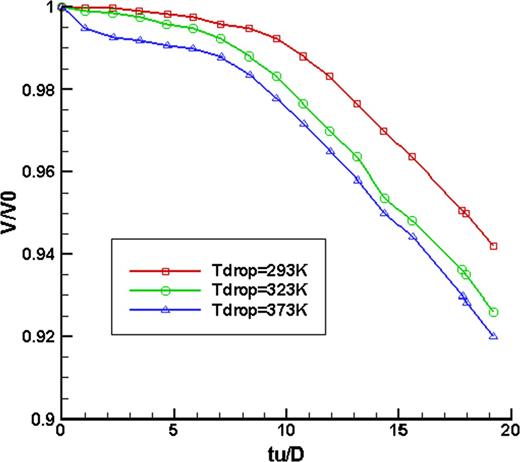
Comparison of volume fraction of droplet in different initial temperatures with dimension time after impacted on hot wall.
3.3 Effect of surface temperature on droplet volume
Figure 4 shows the ratio of droplet volume to its initial volume variation with dimensionless time for a diameter of 2.5 mm with a velocity of 0.3 m/s impinging on a heating surface of 80, 90 and 100°C, respectively; it could be found that only when the heating temperature was 100°C, the volume ratio decreased with time; that is, if the droplet could not reach its saturated state, no evaporation occurred in the droplet. And there was only deformation because of impinging.
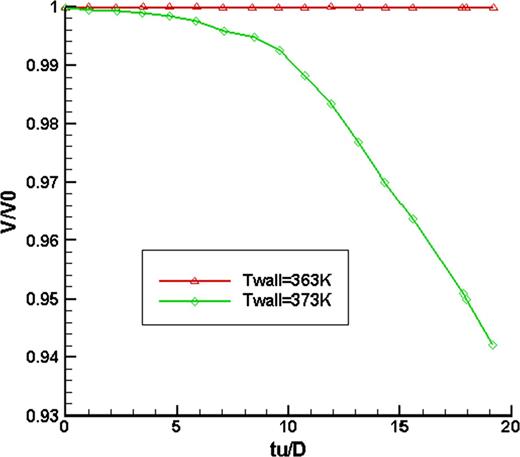
Comparison of droplet volume fraction after impacted on the hot wall with different temperatures.
3.4 Effect of impinging speed on droplet volume
Simulations were carried out to test the effect of impinging speed on the droplet volume for a 2.5 mm diameter droplet at 20°C impacting on a 100°C heating surface at 0, 0.3 and 1.0 m/s, respectively. The ratio of the droplet volume to its initial volume variation with dimensionless time is shown in Figure 5. In the initial deformation stage after the impinging of the droplet on the hot surface, its volume ratio did not change. With further conduction to the droplet, its volume decreased gradually. When t>6 ms, the droplet at an impinging speed of 1.0 m/s first started to evaporate. But the evaporation speed decreased after 14 ms and the volume ratio began to be bigger than those for the droplets at 0.3 and 0.1 m/s impinging speeds. When the impinging speed was fast, the time during which the droplet spread on the surface and reached its maximum spread state was short, and it was quick to evaporate. Thus, at 1.0 m/s, the volume ratio began to decrease earlier than at the other two impinging speeds. However, the droplet would rebound at high impinging speed, and when it receded back to the center, the contact area between the droplet and the heating surface would reduce, and so the evaporation slowed down. Correspondingly, the volume ratio was bigger than for the other two impinging speeds.
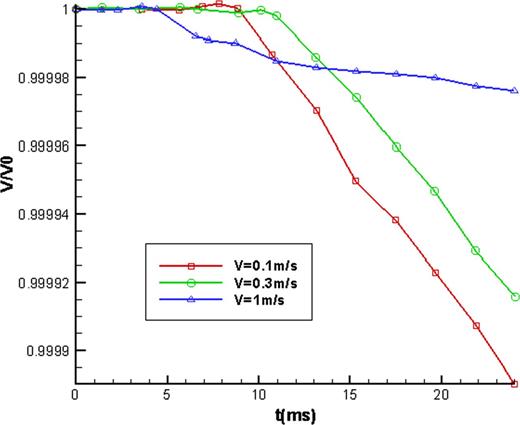
Comparison of droplet volume fraction with dimension time in different impact velocities.
4 CONCLUSIONS
The VOF simulations presented here were able to capture the key processes of the droplet spreading, recoiling and rebounding after the impinging of a droplet on an isothermal flat solid surface, and could also elucidate the evaporation process after a droplet impacting on a heating surface.
Droplet temperature and surface temperature had important effects on the evaporation process. When the droplet temperature has attained the saturation point after had impinged on the heating surface, it evaporated faster. There was no obvious volume decrease when the heating temperature was lower than 100°C.
The impinging speed had important effects on the evaporation process. Compared with the lower impinging speeds, when the impinging speed was high, the evaporation started earlier, but the eventual evaporation speed was lower.
ACKNOWLEDGEMENTS
The authors acknowledge the financial support from National Natural Science Foundation of China (no. 50906005), Fundamental Research Funds for the Central Universities (DUT10JN02) and China Postdoctoral Science Foundation (no. 20100481221) for this research.
