


Abstract
Solar energy and wind energy are two main renewable energy sources. Concentration of solar energy onto a smaller area may reduce the cost of PV modules and achieve high efficiency. On the other hand, wind augmentation allows lower trigger wind speed besides the reduced wind turbine size. For both solar concentration and wind augmentation, their tracking and support system may be the most costly factor. It will therefore be attractive to extend the function of a solar parabolic concentrator to encompass wind augmentation, thereby maximizing the operation time and cost-effectiveness of the costly tracking system. This study presents a novel combined solar concentration/wind augmentation (CSCWA) system. The CSCWA system has the advantage of operating in the daytime and night time whenever it is sunny or windy. The feasibility of using a dish parabolic concentrator for wind augmentation is investigated in CFD simulation and wind tunnel model testing. The increase in monthly power output of the CSCWA system against the independent non-augmented wind turbine and concentrating PV systems is also discussed to identify the suitable climatic conditions.
1 INTRODUCTION
Renewable energy is a fundamental approach to achieve the objective of greatly reducing carbon dioxide emissions. Solar energy and wind energy are the two main renewable energy sources. Concentration of solar energy is a way to concentrate the incoming solar radiation onto a much smaller area, so it could achieve higher intensity of irradiation, higher efficiency and reduced cost. For example, a flat-type solar collector may hardly produce 60oC heat while a concentrating solar collector may readily achieve several hundreds degrees Celsius at a higher thermal efficiency [1]. A crystalline silicon photovoltaic (c-Si PV) cell usually has a conversion efficiency of 10–15%; however under the concentrated solar radiation, its efficiency can reach up to 20% [2].. A multi-junction PV cell under the solar concentration ratio of around 100 can have a conversion efficiency of over 30% [3]. For the medium concentration ratio of up to 100, it is estimated that the cost of a concentrating PV system is only 30–50% of a common fixed planar PV system [4]. A concentrating PV system is also very suitable for combined electricity and thermal applications. The PV cell efficiency may be reduced with the increased operating temperature [5], but this is well compensated by the high overall electricity and thermal efficiency. An overall efficiency of 80% has been reported [6]. Reflection and refraction are two basic methods to concentrate the sunlight. The parabolic trough and dish are two typical reflective solar concentrators while the Fresnel lens is a common refractive solar concentrator. There are numerous studies on different types of solar concentrators [7]. In comparison, reflective trough or dish parabolic concentrators are simple and durable, and may readily give a higher concentration ratio.
On the other hand, wind augmentation has also received great interest. Because the power in the wind is proportional to the cubic power of the wind speed, and therefore any small increase in wind speed will yield a large increase in available wind power. Over the years, researchers have attempted to exploit this relationship by increasing the wind speed across a wind turbine rotor area, either via the use of concentrators (whereby the air is ‘funnelled’ towards the turbine rotor) or diffusers (whereby the air is ‘sucked’ into the cylinder by creating an area of low pressure leeward the rotor) (Figure 1).
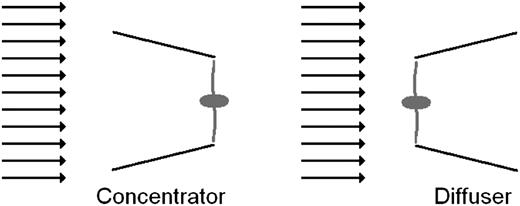
Schematic view of wind augmentation via either a concentrator or diffuser.
Studies that have added a wind acceleration structure to the wind turbine date from the early 1980s [8]to the recent past [9, 10]. Matsushima's [11] work on small wind turbines with diffusers found that the wind speed in the diffuser section was greatly influenced by the length and expansion angle of the diffuser. The maximum wind speed increased 1.7 times with the selection of an appropriate diffuser shape. This yielded a performance increase of 2.4 compared with that of the same turbine without a diffuser. Matsushima's diffuser consisted of a basic frustum-shaped cowling with a flange on the downwind end and a propeller type wind turbine at the upwind end. Similar work performed on flanged diffusers by Abe et al. [12] yielded similar results. Ohya et al. [13, 14] designed a system that contains a large diffuser and flange combination creating a large separation in the flow. It works by generating a low-pressure region which assists the turbine in extracting more wind energy compared with a system with just a diffuser on its own. From experimental research conducted on this system, it was shown that a diffuser and flanged wind turbine generates more power compared with a bare wind turbine, with a power coefficient four times higher [13].
For regions with a high solar and wind energy resource, it will be very attractive to use the same parabolic concentrator to concentrate sunlight in the sunny daytime and augment the wind at night time or during the daytime when it is windy and cloudy. Figure 2 illustrates the two configurations of the proposed combined solar concentration/wind augmentation (CSCWA) system. In comparison with the common parabolic concentrators that have a focal point in front, the parabolic concentrator of the proposed CSCWA system has its focal point at the centre of its tail duct or the wall of the tail duct. This configuration gives a large convenience to install a concentrating PV (CPV) module from the back of the parabolic concentrator. It may be a disadvantage that the parabolic concentrator of the combined system has a slightly larger depth than the common parabolic concentrators, but this is well compensated by the added function of wind augmentation. A strip CPV module may be attached to the sidewall of the tail duct or a disk CPV module may be installed at the centre of the tail duct while a small wind turbine may be positioned axially near the outlet of the tail duct. The size of the disk CPV module is smaller than the wind turbine hub, so it would have little impact on the wind flow. The CPV module and wind turbine may run independently. A control and tracking system adjusts the concentrator towards the sun or wind in terms of the maximum electricity output. This design extends the function of common solar concentrators to encompass wind concentration, therefore maximizing the service time and cost-effectiveness of the tracking system compared with the single-purpose solar tracking system. The proposed CSCWA system has the advantage of operating in the daytime and night time whenever it is sunny or windy. The feasibility and suitability of the proposed system will be studied.
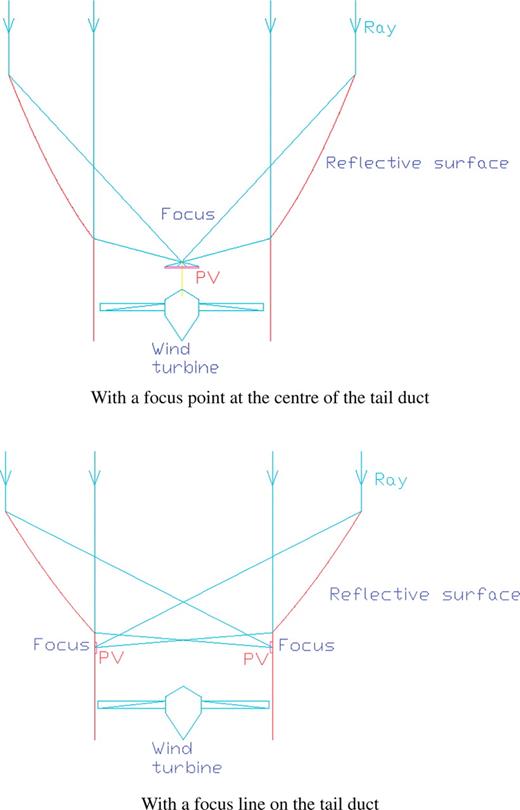
Schematic view of the CSCWA system.
2 CFD SIMULATION
A CFD simulation was carried out to study the feasibility of using a dish parabolic solar concentrator for wind augmentation. Various dish parabolic concentrators of different sizes as in Table 1 were simulated for the free stream wind speed of 5 m/s in the far-field. The dish parabolic concentrators had a base aperture of 0.5 m with or without a tail duct. The average wind velocity at the outlet of the tail duct was obtained from simulation and compared with the free stream wind speed to determine wind velocity and energy augmentation ratios. The simulation was first carried out to compare the concentrator mode and the diffuser mode for wind augmentation. The results in Figure 3 clearly show that the diffuser mode has a much better wind augmentation effect than the concentrator mode. For the free stream wind speed of 5 m/s, the diffuser mode had an average augmented wind speed of 6.94 m/s at the tail duct whereas the concentrator mode only had 5.23 m/s. It was then decided that CFD simulation was focused on the diffuser mode. The detailed results for the diffuser mode are given in Table 1. In Case D0 to Case D3, the deeper dish parabolic concentrator had its focus close to the base aperture, and in Case S0 to Case S3, the shallower dish had its focus close to the front aperture. Comparison between Case D0 and Case D3 shows the effect of the tail duct geometries on the augmentation ratio. Case D0 without a tail duct only had a velocity augmentation ratio of 1.15 whereas Case D1 with a 0.3 m long tail duct had a velocity augmentation ratio of 1.39. A small change in the tail duct length (Case D2) or entrance (Case D3) had a slight effect on the augmentation ratio. Comparison between Case D1 and Case S1 (or D0 and S0) shows the effect of the height of dish parabolic concentrator on the augmentation ratio. It is apparent that a deeper concentrator can give higher augmentation ratio than a shallower concentrator. Cases S2 and S3 were similar to Case S1 but with a larger diameter and height. It can be seen that they had higher augmentation ratio than Case S1. The wind energy concentration ratio was larger than 2.0 for the shallower dish parabolic concentrators with a tail duct in Case S1 to Case S3. A deeper height of the dish parabolic concentrator may give a wind energy concentration ratio larger than 2.5 in Case D1 to Case D3. The velocity augmentation ratio obtained by a deeper dish parabolic concentrator is comparable with the results by Abe et al. [12], who used a flanged diffuser with a wind turbine blade diameter of 400 mm and a flange diameter of about 1000 mm. However, their results show that the velocity augmentation ratio changed from about 1.3 to 1.7 when the turbine rotation speed increased. This phenomenon may also apply to a dish parabolic concentrator used as a wind augmentation diffuser, so a larger velocity augmentation ratio could be achieved when a wind turbine rotates inside the tail duct.
Wind augmentation ratios for various parabolic dishes (free stream wind speed = 5m/s).
| Deep dish | Diffuser mode | |||
|---|---|---|---|---|
| Case D0 | Case D1 | Case D2 | Case D3 | |
 |  |  |  Smooth entrance Smooth entrance | |
| Front aperture | D = 1.0 m | |||
| Base aperture | d = 0.5 m | |||
| Dish height | H = 0.47 m | |||
| Tail duct length | L = 0.0 m | L = 0.3 m | L = 0.2 m | L = 0.3 m |
| Average duct velocity | 5.74 | 6.94 | 6.83 | 7.06 |
| Ratio of velocity | 1.15 | 1.39 | 1.37 | 1.41 |
| Ratio of power density | 1.51 | 2.67 | 2.55 | 2.82 |
| Shallow dish | Case S0 | Case S1 | Case S2 | Case S3 |
 |  |  |  | |
| Front aperture | D = 1.0 m | D = 1.0 m | D = 1.2 m | D = 1.4 m |
| Base aperture | d= 0.5 m | |||
| Dish height | H = 0.19 m | H = 0.19 m | H = 0.30 m | H = 0.43 m |
| Tail duct length | L = 0.0 m | L = 0.3 m | L = 0.3 m | L = 0.3 m |
| Average duct velocity | 5.35 | 6.40 | 6.47 | 6.64 |
| Ratio of velocity | 1.07 | 1.28 | 1.29 | 1.33 |
| Ratio of power density | 1.23 | 2.10 | 2.17 | 2.34 |
| Deep dish | Diffuser mode | |||
|---|---|---|---|---|
| Case D0 | Case D1 | Case D2 | Case D3 | |
| | | Smooth entrance | |
| Front aperture | D = 1.0 m | |||
| Base aperture | d = 0.5 m | |||
| Dish height | H = 0.47 m | |||
| Tail duct length | L = 0.0 m | L = 0.3 m | L = 0.2 m | L = 0.3 m |
| Average duct velocity | 5.74 | 6.94 | 6.83 | 7.06 |
| Ratio of velocity | 1.15 | 1.39 | 1.37 | 1.41 |
| Ratio of power density | 1.51 | 2.67 | 2.55 | 2.82 |
| Shallow dish | Case S0 | Case S1 | Case S2 | Case S3 |
| | | | |
| Front aperture | D = 1.0 m | D = 1.0 m | D = 1.2 m | D = 1.4 m |
| Base aperture | d= 0.5 m | |||
| Dish height | H = 0.19 m | H = 0.19 m | H = 0.30 m | H = 0.43 m |
| Tail duct length | L = 0.0 m | L = 0.3 m | L = 0.3 m | L = 0.3 m |
| Average duct velocity | 5.35 | 6.40 | 6.47 | 6.64 |
| Ratio of velocity | 1.07 | 1.28 | 1.29 | 1.33 |
| Ratio of power density | 1.23 | 2.10 | 2.17 | 2.34 |
Wind augmentation ratios for various parabolic dishes (free stream wind speed = 5m/s).
| Deep dish | Diffuser mode | |||
|---|---|---|---|---|
| Case D0 | Case D1 | Case D2 | Case D3 | |
| | | Smooth entrance | |
| Front aperture | D = 1.0 m | |||
| Base aperture | d = 0.5 m | |||
| Dish height | H = 0.47 m | |||
| Tail duct length | L = 0.0 m | L = 0.3 m | L = 0.2 m | L = 0.3 m |
| Average duct velocity | 5.74 | 6.94 | 6.83 | 7.06 |
| Ratio of velocity | 1.15 | 1.39 | 1.37 | 1.41 |
| Ratio of power density | 1.51 | 2.67 | 2.55 | 2.82 |
| Shallow dish | Case S0 | Case S1 | Case S2 | Case S3 |
| | | | |
| Front aperture | D = 1.0 m | D = 1.0 m | D = 1.2 m | D = 1.4 m |
| Base aperture | d= 0.5 m | |||
| Dish height | H = 0.19 m | H = 0.19 m | H = 0.30 m | H = 0.43 m |
| Tail duct length | L = 0.0 m | L = 0.3 m | L = 0.3 m | L = 0.3 m |
| Average duct velocity | 5.35 | 6.40 | 6.47 | 6.64 |
| Ratio of velocity | 1.07 | 1.28 | 1.29 | 1.33 |
| Ratio of power density | 1.23 | 2.10 | 2.17 | 2.34 |
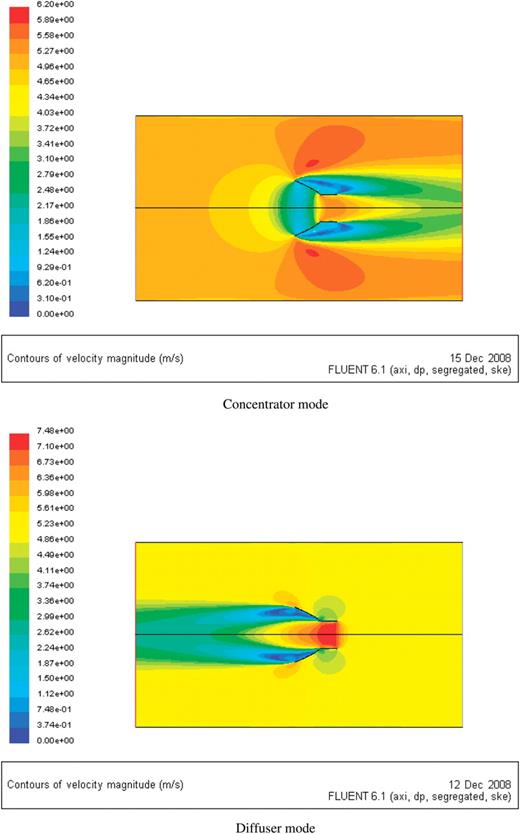
CFD-simulated contours of wind velocity.
3 MODEL TESTING
A laboratory test was also carried out to verify the feasibility of using a dish parabolic solar concentrator for wind augmentation. A 1:5 scaled model of the Case D1 dish parabolic concentrator shown in Table 1 was moulded out of plastic. The model was tested in a blower-type wind tunnel with its axis 0° and 10° to the wind direction, respectively (Figure 4). A TSI Model 1650 hot-wire anemometer was used to measure all wind speeds during this experiment. The free stream wind speed was measured at the centre of wind tunnel, close to the inflow settling chamber. The wind velocity in the model dish parabolic concentrator was measured at the centre of the tail duct for various free stream wind speeds which was measured at the same position prior to installation of the model. As the model was quite small compared with the wind tunnel outlet, the free stream wind speed distribution could be assumed to be uniform in the area of installing the model. The measured velocities for both the concentrator mode and diffuser mode are recorded in Table 2. The diffuser mode was better than the concentrator mode and had an average wind speed augmentation ratio or percentage increase of 53% at 0° direction. By altering the wind direction to 10° off the axis, the average percentage increase dropped to 30%. The concentrator mode was less sensitive to the change in wind direction. The average wind speed percentage increase was 34% and 33% for the 0° and 10° wind direction, respectively. The measured data are close to the CFD simulation data for Case D1 in Table 1, but slightly larger. This is because the measured velocity at the centre of duct is almost the maximum velocity while the velocity in Table 1 is the average over the cross-section.
Wind speeds at the centre of the tail duct of the model parabolic dish and their percentage increase over the free stream wind speed.
| Free stream wind speed (m/s) | 0.90 | 1.28 | 1.76 | 2.25 | 2.75 | 3.29 | 3.84 | 4.40 | |
| Diffuser mode | |||||||||
| Wind at 0o to the axis (m/s) | 1.38 | 1.95 | 2.66 | 3.39 | 4.15 | 5.06 | 6.00 | 7.05 | |
| Percentage increase | 53 | 52 | 51 | 51 | 51 | 54 | 56 | 60 | 53 |
| Wind at 10o to the axis (m/s) | 1.20 | 1.69 | 2.28 | 2.84 | 3.58 | 4.20 | 5.02 | 5.73 | |
| Percentage increase | 33 | 32 | 29 | 26 | 30 | 28 | 31 | 30 | 30 |
| Concentrator mode | |||||||||
| Wind at 0o to the axis (m/s) | 1.22 | 1.73 | 2.35 | 3.02 | 3.63 | 4.41 | 5.12 | 6.04 | |
| Percentage increase | 35 | 35 | 33 | 34 | 32 | 34 | 33 | 37 | 34 |
| Wind at 10o to the axis (m/s) | 1.20 | 1.71 | 2.32 | 2.94 | 3.61 | 4.38 | 5.09 | 6.00 | |
| Percentage increase | 33 | 33 | 32 | 31 | 31 | 33 | 32 | 36 | 33 |
| Average percentage increase |  | ||||||||
| Free stream wind speed (m/s) | 0.90 | 1.28 | 1.76 | 2.25 | 2.75 | 3.29 | 3.84 | 4.40 | |
| Diffuser mode | |||||||||
| Wind at 0o to the axis (m/s) | 1.38 | 1.95 | 2.66 | 3.39 | 4.15 | 5.06 | 6.00 | 7.05 | |
| Percentage increase | 53 | 52 | 51 | 51 | 51 | 54 | 56 | 60 | 53 |
| Wind at 10o to the axis (m/s) | 1.20 | 1.69 | 2.28 | 2.84 | 3.58 | 4.20 | 5.02 | 5.73 | |
| Percentage increase | 33 | 32 | 29 | 26 | 30 | 28 | 31 | 30 | 30 |
| Concentrator mode | |||||||||
| Wind at 0o to the axis (m/s) | 1.22 | 1.73 | 2.35 | 3.02 | 3.63 | 4.41 | 5.12 | 6.04 | |
| Percentage increase | 35 | 35 | 33 | 34 | 32 | 34 | 33 | 37 | 34 |
| Wind at 10o to the axis (m/s) | 1.20 | 1.71 | 2.32 | 2.94 | 3.61 | 4.38 | 5.09 | 6.00 | |
| Percentage increase | 33 | 33 | 32 | 31 | 31 | 33 | 32 | 36 | 33 |
| Average percentage increase | | ||||||||
Wind speeds at the centre of the tail duct of the model parabolic dish and their percentage increase over the free stream wind speed.
| Free stream wind speed (m/s) | 0.90 | 1.28 | 1.76 | 2.25 | 2.75 | 3.29 | 3.84 | 4.40 | |
| Diffuser mode | |||||||||
| Wind at 0o to the axis (m/s) | 1.38 | 1.95 | 2.66 | 3.39 | 4.15 | 5.06 | 6.00 | 7.05 | |
| Percentage increase | 53 | 52 | 51 | 51 | 51 | 54 | 56 | 60 | 53 |
| Wind at 10o to the axis (m/s) | 1.20 | 1.69 | 2.28 | 2.84 | 3.58 | 4.20 | 5.02 | 5.73 | |
| Percentage increase | 33 | 32 | 29 | 26 | 30 | 28 | 31 | 30 | 30 |
| Concentrator mode | |||||||||
| Wind at 0o to the axis (m/s) | 1.22 | 1.73 | 2.35 | 3.02 | 3.63 | 4.41 | 5.12 | 6.04 | |
| Percentage increase | 35 | 35 | 33 | 34 | 32 | 34 | 33 | 37 | 34 |
| Wind at 10o to the axis (m/s) | 1.20 | 1.71 | 2.32 | 2.94 | 3.61 | 4.38 | 5.09 | 6.00 | |
| Percentage increase | 33 | 33 | 32 | 31 | 31 | 33 | 32 | 36 | 33 |
| Average percentage increase | | ||||||||
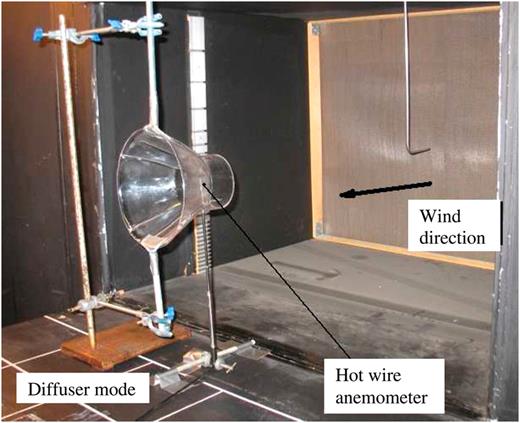
Wind tunnel setup for the model concentrator in the diffuser mode.
4 ESTIMATION OF POWER OUTPUT
The study also dealt with the estimation of power output and comparison with the common independent non-augmented wind turbine and CPV systems to determine the suitable climatic conditions for the proposed CSCWA system. The estimation was made for Case D1 in Table 1. The dish parabolic concentrator of Case D1 had the diameter of its front aperture two times that of its base opening, giving the effective solar collection area three times the wind turbine area. The effective solar collection area of the CSCWA system is 25% less than its front aperture area due to the base opening. It was assumed that the optical efficiency is 0.85, the electricity conversion efficiency of both CPV and wind turbine is 0.20, the trigger wind speed is 2.5 m/s and the wind energy augmentation ratio is 2.5. The weather data from EnergyPlus were used to calculate the hourly, monthly and annual electricity outputs for the CSCWA system in Case D1 and the corresponding independent non-augmented wind turbine and CPV systems that have the same diameters as those in the CSCWA system. It was also assumed that if the hourly power output of the CPV in the CSCWA system is larger than that of the augmented wind turbine, the latter will not be counted and vice versa. Figure 5 shows the ratio of monthly power output of the proposed CSCWA system against the two corresponding independent non-augmented wind turbine and CPV systems for five selected cities in the UK and China. It is apparent that the monthly power output of the proposed CSCWA system is larger than the sum of the outputs of the independent non-augmented wind turbine and CPV systems for the windy cities such as Edinburgh, Shanghai and Tianjin. Figure 6 shows that the power output of the augmented wind turbine is a significant portion of the total output of the CSCWA system for these windy cities. This may seem that the CSCWA system has little advantage over the single augmented wind turbine for the windy locations. However, Figure 7 shows that the advantage of the CSCWA system over the single augmented wind turbine is still considerable, particularly in summer. For London, the CSCWA system may give an advantage only in winter when it is fairly windy. As the effective solar collection area of the CSCWA system was assumed to be 25% less than the concentrator in the independent CPV system, the CSCWA system shows a slightly lower output when the wind energy is very limited such as in Beijing. It is evident that the advantage of the proposed CSCWA system is quite dependent on the balance between the available solar power and wind power, and could be well explained by Figure 8. It can be seen that in order to obtain a power output ratio of 1.5, the corresponding independent non-augmented wind turbine power output and the CPV output should be about equal.
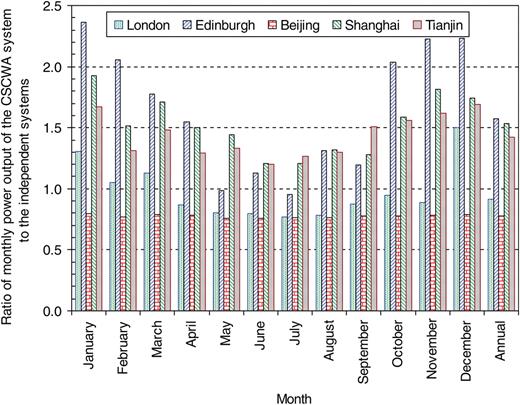
Ratio of monthly power output of the proposed CSCWA system against two independent non-augmented wind turbine and CPV systems.
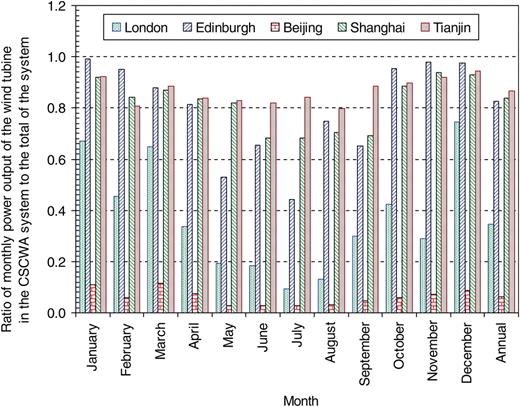
Ratio of monthly power output of the augmented wind turbine in the proposed CSCWA system against the total output of the system.
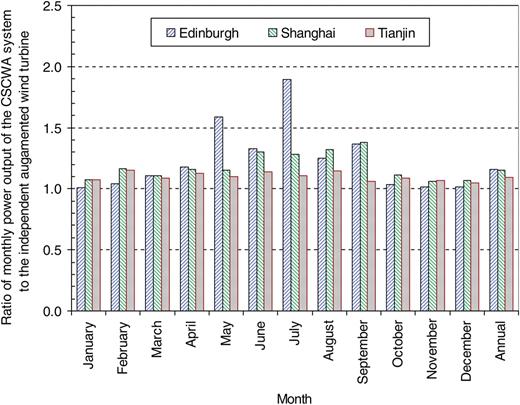
Ratio of monthly power output of the proposed CSCWA system against the independent augmented wind turbine only.
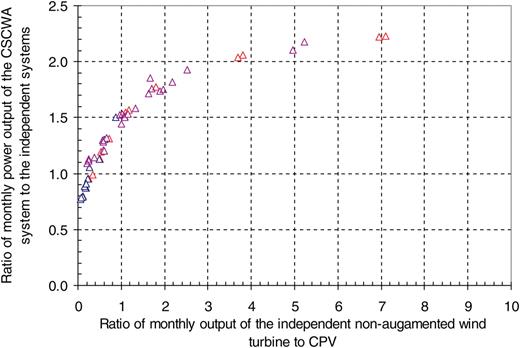
Ratio of monthly power output of the proposed CSCWA system to two independent non-augmented wind turbine and CPV systems versus the ratio of wind turbine to CPV monthly output.
5 CONCLUSIONS AND DISCUSSIONS
A novel CSCWA system has been presented. The CSCWA system extends the function of common solar concentrators to encompass wind augmentation, therefore maximizing the operation time and cost-effectiveness of the costly tracking system compared with the single-purpose solar tracking. The CSCWA system has the advantage of operating in the daytime and night time whenever it is sunny or windy. CFD simulations and wind tunnel model testing have been carried out to study the feasibility of using a dish parabolic concentrator for wind augmentation. The results have shown that a wind speed augmentation ratio of about 1.36 could be achieved for a dish parabolic concentrator with an appropriate height and a tail duct. The corresponding wind energy augmentation ratio was about 2.5, which is comparable to the results reported in the literature. The suitability of the CSCWA system for various climatic conditions has also been estimated in terms of increased power output. The results have indicated that if the monthly power outputs of a non-augmented wind turbine and a CPV are about equal, combination of them in the CSCWA system will give about 50% increase in the total monthly power output. This indicates that the proposed CSCWA system would be advantageous for the climatic condition with a considerable availability of both solar and wind energy resources. For this type of climatic condition, the frequency of raining weather is usually moderate and this will provide a good periodical cleaning of the parabolic surface of the system to maintain its good reflectivity. According to the configuration of the above Case D1, a prototype CSCWA system with a front aperture diameter of 1.0 m and a base opening diameter of 0.5 m is being constructed and tested to investigate operation of the tracking system, cooling design for CPV and real power output. The diameter of the CPV module would be about 0.1 m, giving a solar concentration ratio of 75, so water cooling of the CPV will be required and the accuracy of solar tracking will be kept around 1°. The deeper parabolic dish may act as a wind director. It is therefore intended to use passive tracking for the wind turbine after the step motors in the tracking system are disengaged. The dish will have a rotation freedom of ±180°. This will not cause the twisting problem for soft connection tubes and cables. The construction and testing results will be reported in a separate paper in due course.
ACKNOWLEDGEMENTS
Thanks to ICUK (Innovation China–UK) for a partnership grant.
