


Abstract
Several passive cooling design techniques are known for reducing solar heat gain through building envelope in summer season. These include the use of phase change materials (PCM), which has received an increased attention over the last years, and the strategy of increasing the above-sheathing ventilation (ASV) in ventilated roofs. However, few studies combine both technologies to maximise the building resilience in hot season. The effect of including a PCM layer into a ventilated roof is numerically analysed here in two different configurations: firstly, laid on the roof deck (PCM1 case) and, secondly, suspended in the middle of the ASV channel (PCM2 case). A computational fluid dynamics model was implemented to simulate airflow and heat transfer around and through the building envelope, under 3 days of extreme hot conditions in summer with high temperatures and low wind speed. Results showed slight differences in terms of mean temperatures at the different roof layers, although temperature fluctuations at deck in the PCM1 case were smaller than half of those estimated for the benchmark case. However, PCM2 configuration achieved a daily reduction of about 10 Wh/m2 (18%) in building energy load with respect to the benchmark case, whilst PCM1 got only 4% due to the lower ventilation at night time. Therefore, a suspended PCM layer in the ASV channel would be a better measure in terms of energy performance than laid on the deck surface, although this last option significantly decreases thermal stress of the insulation layer.
1. INTRODUCTION
According to the International Energy Agency (IEA), the building sector is responsible for nearly 40% of final global energy consumption worldwide, with major components in heating, cooling, ventilation, etc. [1]. Although IEA has identified some opportunities for global building energy demand to decline from now to 2040, due to a more efficient scenario, it has also warned about the fast growing of cooling in buildings. In fact, it has predicted that energy demand for space cooling will more than triple by 2050, an increase especially concentrated in the hottest parts of the world [2].
In this context, different passive cooling techniques have received an increased attention over the last decades. A suitable selection of these techniques, which can be classified into heat protection, heat modulation and heat dissipation techniques [3], depends on many factors, such as climatic conditions, building space constraints and performance of the passive technique [4]. In heat protection techniques, the building is protected from direct solar gains by using shading devices, active vegetation, etc. Regarding modulation techniques, the heat gain is modulated by the thermal inertia of the building structure. The integration of phase change materials (PCMs) in building envelope falls into this category. PCMs have high latent heat capacity and are able to absorb and release solar and infrared radiation through convection and radiation. They allow decreasing internal air temperature fluctuations [5] and reducing total discomfort hours and cooling energy loads [6]. It must be highlighted that that PCMs’ performance depends on the quantity of the material and the temperatures during the day and night [7]. In heat dissipation techniques, excess heat of the building is released to a suitable environmental heat sink at a lower temperature. Within this group, roof ventilation, which uses environmental air as a heat sink, can also play an important role in lowering energy requirement for space cooling by increasing natural and forced air convection and reducing the heat transfer due to solar radiation.
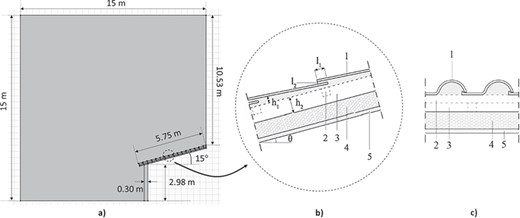
(a) Sketch of the 2D model domain. (b) Simplified 2D model of the tile and ASV channel (benchmark case). l1, length of tile overlap; l2, thickness of gap between overlapping tiles; h1, thickness of the air layer under the tile; h2 thickness of the ventilation layer; θ, tilt angle. (c) Cross section of the Portuguese tile shape. 1, tiles; 2, battens and resulting air layer; 3, counter-battens and resulting air layer; 4, insulation layer; 5, wooden board.
Geometric characteristics of the ventilated roof.
| Name | Description | Value (unit) |
|---|---|---|
| l | Tile thickness | 0.01 (m) |
| l1 | Length of tile overlap | 0.05 (m) |
| l2 | Distance between overlapping tiles | 0.006 (m) |
| h1 | Thickness of air layer | 0.015–0.03 (m) |
| h2 | Thickness of ventilation layer | 0.08 (m) |
| θ | Tilt angle | 15 (°) |
Properties of building materials.
| Material | Thickness (m) | Density (kg/m3) | Thermal conductivity (W/m·K) | Specific heat (J/kg·K) | Latent heat (J/kg) | Melting temperature (°C) |
|---|---|---|---|---|---|---|
| Wall | 0.30 | 850 | 0.20 | 840 | — | — |
| Rockwool insulation layer | 0.08 | 130 | 0.037 | 1030 | — | — |
| Wooden board | 0.02 | 450 | 0.15 | 2100 | — | — |
| Tiles | 0.01 | 2000 | 1.00 | 800 | — | — |
| PCM (Na2CO3·10H2O) | 0.02 | 1485 (solid) | 0.554 (solid) | 1783 | 246.5 | 32 (span 2°C) |
| 1442 (liquid) | ||||||
| Backfill material | — | 1200 | 0.8 | 1000 | — | — |
Especially in hot climates, the roof plays an important role in comparison with other building elements due to its extension and exposure to the sun [8]. PCMs have been integrated in roofs in a variety of options with the aim of increasing thermal energy storage capacity of the building. In [9], a 3D heat transfer parametric study of a full-scale PCM roof is developed, in which different influencing factors on thermal performance (solar radiation, transition temperature, roof slope, etc.) were investigated. They observed a strong temperature delay in the room with respect to the common case and that roof slope, PCM layer thickness and absorption coefficient of external surfaces were the most relevant factors. In [10], a mathematical model is presented which was experimentally validated in order to predict the thermal behaviour of a roof made of brick and concrete with a middle PCM layer. Authors concluded that a double PCM layer could limit temperature swings and be suitable for all seasons. An experimental study is presented in [11] about a complex roof with PCM inserted into an enclosed air space between the corrugated iron roof and plasterboard. The air layer between the iron roof and the PCM was not ventilated. Authors proved that the PCM was able to store thermal energy in the daytime and released it at night. An experimental roof configuration that consisted of a combination of photovoltaic (PV) laminates, air cavities, fibreglass insulation with reflected foil facing and PCM heat sink is shown in [12]. Air cavities and air gap above the insulation layer provided above-sheathing ventilation (ASV), which helped to reduce cooling loads during summer. Over 50% of saving in cooling energy demand was achieved.
Air temperature and solar irradiance for 1 day of the simulation period.

Different studies based on experimental and numerical approaches have also investigated the performance of ASV systems. Thus, laboratory tests were carried out to assess airflow and temperature distribution in ASV as functions of solar radiation and size and shape of the air channel [13]. A significant performance improvement over a standard ventilated roof was measured in full-scale models [14]. Numerical tools were used by other authors in order to estimate air distribution and heat transfer in ventilated roofs [8]. A numerical algorithm to predict heat, air and moisture transport in the building envelope and quantify the thermal benefits is developed in [15], around 14%, of using a tiled roof over a traditional shingle roof. A reduction between 30 and 50% of heat flux into the attic was reported by other numerical studies when roof ventilation was considered in [16–18]. In [16], a new algorithm to predict free laminar convection heat transfer in ventilated roofs and also apply a 2D steady state computational fluid dynamics (CFD) modelling is created, from which they made a correlation to estimate naturally induced airflow within the ventilated space. In [17], a 1D heat transfer steady-state mathematical model is developed as based on thermal resistance circuits. In [18], a 2D steady-state CFD model is used to study the performance of the ventilated roof for different configurations, and it was concluded that the best results were obtained when placing the insulation layer under the air layer. These numerical studies neglected the tile air permeability between the overlapping tiles and modelled ASV as an air duct. Air permeability was experimentally analysed in [19], where it is concluded that, in the roofs studied, air permeability and the introduction of building elements which obstruct the flow could counter any differences in performance correlated with the cross section of the ventilation duct. The enhancement of ASV by tile air permeability was experimentally and numerically studied in the European project LIFE HEROTILE (LIFE14CCA/IT/000939), in which a significant increase in ASV using new tile designs was achieved [20–22].
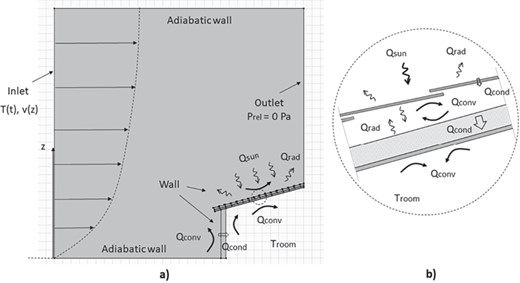
(a) Description of boundary conditions in the whole domain. (b) Details of boundary conditions on the roof. t, time; T, temperature; z, height; v, wind speed; Prel, relative pressure; Qsun, solar irradiance; Qrad, radiation heat flux; Qconv, convective heat flux; Qcond, conductive heat flux; Troom, fixed room air temperature.
Recent studies generally focus on the combination of different passive cooling technologies in order to maximise the building cooling potential and energy-saving capabilities [23]. However, very few studies can be found in scientific literature on the combination of ASV and PCMs. Furthermore, to the best of the authors’ knowledge, there are no studies on the use of ASV systems with increased air permeability together with PCM layers over the roof deck. Thus, the aim of the present work is to analyse the performance of this combination of passive techniques during hot periods in a Mediterranean site (Ferrara, Italy). Different configurations of ventilated roofs were simulated numerically by using CFD. First, a description of the methodology and case studies is given. Secondly, the numerical model is presented. Finally, the results obtained are analysed and discussed and conclusions drawn.
2. METHODOLOGY
The simulation of airflow and heat transfer in ventilated roofs is a complex problem that involves turbulence with a variety of length scales. Larger scales, which are related to wind and wind–building interaction, are connected to the small scales of the flow within the ASV and the tiny interstices among the overlapping tiles [8]. In order to solve this problem, CFD numerical simulations of the heat transfer mechanisms and airflow over a real building and through its ventilated pitched tiled roof has been considered here. The commercial finite-element code COMSOL Multiphysics V5.3 was used. A reference or benchmark case study in which only the ASV was taken into account was used for comparison with other configurations that also included a PCM layer over the roof deck. The descriptions of the CFD model and study cases are given next.
2.1. CFD model
2.1.1. Domain
As the main interest is focussed on the natural ventilation channel and heat transfer exchange in the roof of the building, a 2D domain was considered as a section of a one-floor building of infinite width, neglecting 3D effects of wind–building interaction. A sketch of the domain is shown in Figure 1a). The building, for which only one half has been considered, is covered by a pitched roof with a slope of 15° and is included in a 15 m × 15 m external air environment. Details of the roof are given in Figure 1b and c (benchmark case). The roof covering is made of Portuguese roof tiles laid on a batten and counter-batten system. In the present study, the batten and counter-batten system is not included in the model and tile shape is simplified such that the resulting ASV and tile models are as shown in Figure 1b [8]. Air will flow into the ventilation channel at the eaves and through the gaps among the tiles, and mainly leaving out at the ridge.
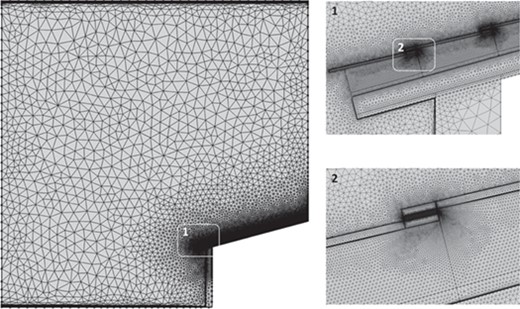
Details of the mesh used to represent the whole domain and ASV channel (benchmark case).
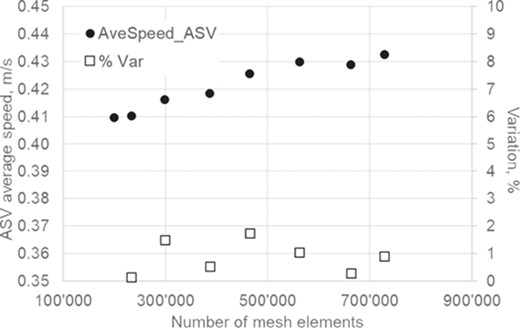
Mesh independence study. Average air speed at the cross section in the middle of the ASV channel was used for comparison (benchmark case).
Geometric values of the roof elements and properties of the building materials are described in Tables 1 and 2, respectively.
In Table 2, properties of the PCM (Na2CO3·10H2O, an hydrated salt) used in the present study are reported, as given in [24]. Hydrated salts are often preferred in building applications due to their high latent heat combined to a low price. A mixture of a backfill material (20% of total volume) and the PCM is considered in the PCM layer that will be integrated in other ASV configurations. To represent time dependence of mixture density, conductivity and specific heat during the phase change, some specific relationships expressed in terms of normalised Dirac’s pulse and different step functions were implemented, as reported in [25].
2.1.2. Boundary conditions
The numerical study of the energy performance of the ASV system was developed for a period of three summer days with extreme hot conditions, that is, high air temperatures and high solar irradiance (W/m2) (Figure 2). Minimum and maximum daily air temperatures were 24.0 and 38.3°C, respectively. A time-dependent air temperature (T(t)) was set as a boundary condition at the inlet of the fluid domain. Furthermore, solar irradiance, which reached a maximum value of 800 W/m2, was set as an input time-dependent heat flux over the roof of the building. Roof surface had a hemispherical reflectance of 0.3.
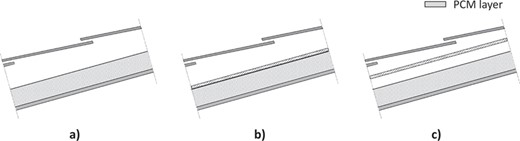
Cross sections of the ventilated roofs for the three case studies: (a) benchmark case (BM); (b) PCM layer laid on the roof deck (PCM1); (c) PCM layer hanging in the middle of the ASV channel (PCM2).
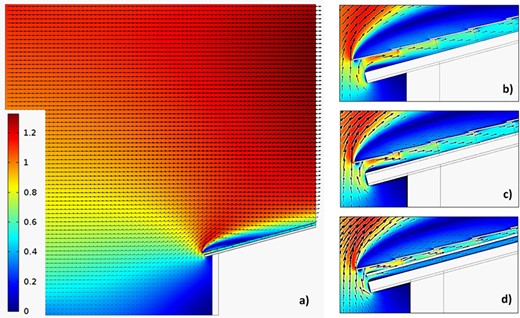
Surface and vector velocity plots. (a) Full domain (BM). Details of the same plot for the different case studies: (b) BM, (c) PCM1 and (d) PCM2.
v(z) = wind speed at height z (m/s)
z = height (m)
v0 = wind speed at a reference height (z0) (m/s)
z0 = reference height (z0) (m)
α = empirical non-dimensional exponent
The exponent α, which depends on the surface roughness, was set to 0.3, a typical value for urban areas [26]. Thus, low wind speed conditions, for which the efficiency of the ASV systems is smaller, will be analysed. Also, these conditions would be more similar to the real ones in which the air in the streets does not flow in a direction perpendicular to the building façade.
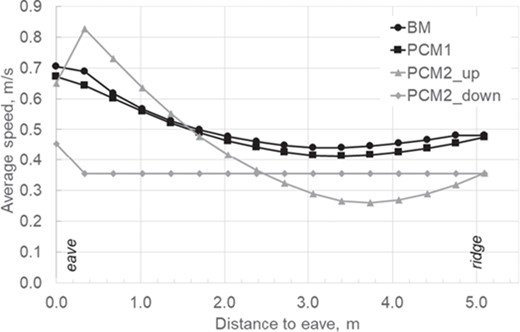
Average speed at different cross sections along the ASV channel.
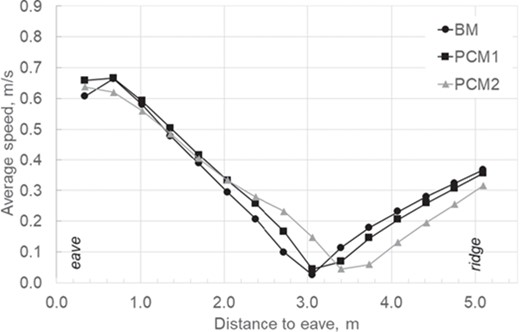
Average speed at the outlet cross sections of the inter-tile gaps.
Constraints at other boundaries of the domain are described in Figure 3. Details of the different heat transfer mechanisms and conditions considered in the ventilated roof are shown in Figure 3b. A constant room air temperature of 26°C and a heat transfer coefficient of 8 W/(m2K) were set on the ceiling and inside surface of the building wall. Grey body and surface-to-surface radiation models were used to calculate radiation heat transfer between surfaces in the ASV channel.
2.1.3. Mesh independence
An unstructured triangular mesh has been used with inflation layers (prismatic layers of increasing thickness) in the proximity to the wall–air interfaces in order to capture gradients within the mechanical and thermal boundary layers (Figure 4). Several runs of the initial CFD model were performed on different size meshes, and their results were compared to analyse the grid independence of the solution. The average air speed at the cross section in the middle of the ASV channel was used for comparison. Although there were no great differences (around 1.5% of relative variation) (Figure 5), meshes of near half a million elements were built for all the case studies developed.
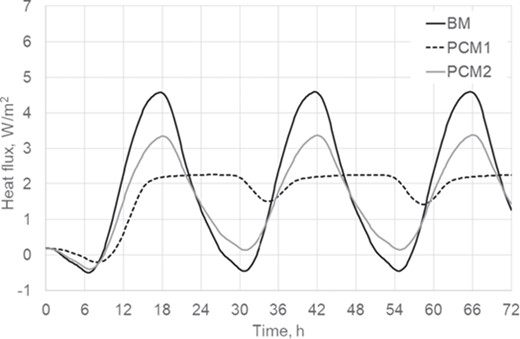
Time dependence of heat flux (W/m2) through the ceiling.
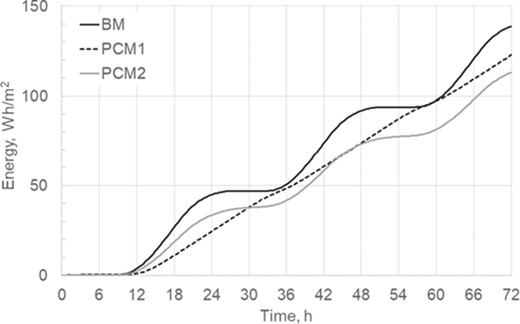
Time dependence of energy (Wh/m2) entering the room through the ceiling. Numerical integration of curves in Figure 10 for positive values of heat flux.
2.1.4. Turbulence model and solving strategy
The k–ε model with standard wall functions was used to simulate turbulence within the fluid domain. The problem was solved in two stages. First, a steady-state solution of the airflow was sought in the thermal conditions formerly described. Then, from the steady-state airflow solution, the heat transfer transient problem was solved. This strategy can be justified considering that temperature differences along the roof are not very high and, consequently, airflow through the ASV channel is mainly dependent on external wind conditions. A relative tolerance of 10−3 was set for residuals.
Temperature at different sections (1, 8 and 16) of the outer surface of the insulation layer.
| S1 | S8 | S16 | |||||||
|---|---|---|---|---|---|---|---|---|---|
| (°C) | BM | PCM1 | PCM2 | BM | PCM1 | PCM2 | BM | PCM1 | PCM2 |
| TMEAN | 30.5 | 30.2 | 30.4 | 30.6 | 30.1 | 30.0 | 31.2 | 30.6 | 29.9 |
| TMIN | 24.3 | 25.0 | 24.4 | 24.3 | 25.4 | 24.6 | 24.4 | 25.5 | 24.9 |
| TMAX | 37.1 | 31.6 | 36.9 | 37.5 | 31.4 | 35.0 | 39.1 | 31.5 | 33.5 |
| TMAX – TMIN | 12.8 | 6.6 | 12.6 | 13.2 | 6.0 | 10.4 | 14.7 | 6.0 | 8.6 |
2.2. Case studies
Three case studies were considered: a benchmark case (from now on ‘BM’) described in Section 2.1 and two configurations (PCM1 and PCM2) in which the ASV system was coupled with a PCM layer over the roof deck. In the last two cases, a 2-cm-thick PCM layer was considered. In PCM1 configuration, the layer was laid on the roof deck whilst in PCM2 the layer was suspended in the middle of the ASV channel (Figure 6).
Meshes with 497249, 487982 and 358988 elements were built for the BM, PCM1 and PCM2 case studies, respectively.
3. RESULTS AND DISCUSSION
Although authors have mainly focussed their attention on heat transfer through the different roof configurations, a study on velocity field has also been carried out in order to check the right performance of the numerical simulations. Thus, Figure 7 shows the airflow in the whole domain and through the ASV channel for the three case studies. In terms of velocity field, BM and PCM1 show a very similar behaviour, with a decay of air speed in the middle part of the channel and a slight increase towards the ridge. This dependence has been experimentally observed in [8]. The highest values of air speed at the beginning can be explained by the action of the eave edge that channels air coming from below.
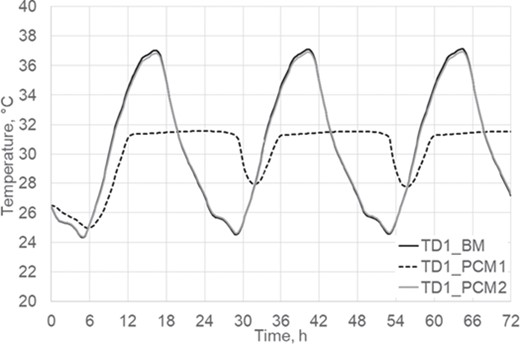
Temperatures at the first part (D1, close to the eave) on the deck (insulation layer) surface.
Temperatures at the middle part (D18) on the deck surface.
Temperatures at the last part (D16, close to the ridge) on the deck surface.
Regarding PCM2, airflow is split into two streams by the suspended PCM layer. It is interesting to note that, whilst the upper flow behaves similarly to the former two cases, the flow below the PCM layer shows an almost uniform velocity distribution. This is also shown in Figure 8 and can be explained again by the action of the eave edge and the irregularities caused by inter-tile gaps. The uniformity of velocity under the PCM layer is caused by the even distribution of surfaces. Figure 9 provides the values of the average velocity at the different outlet cross sections of the inter-tile gaps. A very similar trend is seen for the three cases with a steep decrease to nearly null velocity near the middle of the roof, which is related to the stagnation area in the wake of the outer flow and to an indoor–outdoor pressure balance.
Temperature has been estimated in many different locations of the building roof: on the ceiling (inner surface of the wooden board), at the interface between the wooden board and the insulation layer, over the insulation layer, on the PCM surfaces, etc. Thus, the average temperature of the ceiling and at the interface between the wooden board and the insulation layer are almost identical for the three cases, around 26.2 and 26.7°C, respectively. Also, the average temperature at the outer surface of the insulation layer is very similar, with a value that ranges from 30.0°C (PCM2) to 30.6°C (BM). At this interface, temperature variations seem to be smaller for the PCM1 configuration.
Regarding the heat transfer through the roof, mean values of heat flux for BM, PCM1 and PCM2 cases are 1.9, 1.7 and 1.5 W/m2, respectively. Thus, a 20% reduction is achieved with PCM2 configuration. Although a clear dampening is observed in the time dependence of heat flux, it seems that PCM1 performance is not very good, probably because PCM is not able to release upwards the required amount of heat at night (Figure 10). In fact, the energy transferred to the room after a period of 24 h is almost the same (a difference of around 4%) for BM and PCM1 configurations (Figure 11). In the same period, a reduction in building energy load of about 10 Wh/m2 (18%) is achieved by PMC2 configuration with respect to the benchmark case. This better performance of the PCM2 configuration may be explained by the ventilation of the two surfaces of the PCM layer, which enhances heat release.
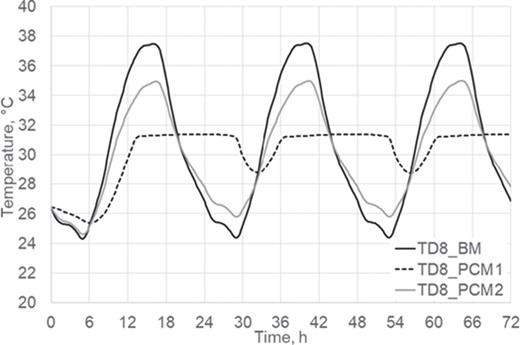
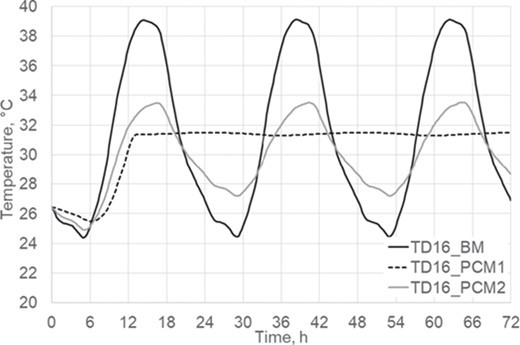
An interesting location, from the construction and refurbishment perspective, is the outer surface of the insulation layer because it degrades under extreme temperature conditions. Thus, surface temperature at different sections of the deck has been compared among the three case studies. The ASV channel was divided into 16 sections (related to the 16 tiles of the half of the roof). Thus, temperatures at Sections 1 (at the eave), 8 and 16 (at the ridge) on the deck surface have been analysed (Table 3). The smallest temperature fluctuations (half of those estimated for the BM case) and the lowest maximum temperature values were obtained with PCM1 configuration, that is, with the PCM layer right over the insulation layer.
As it can be seen from Figures 12–14, temperature on the whole deck surface is almost constant for PCM1 configuration (32°C, the melting point of the PCM). Furthermore, the dampening effect of the PCM layer in PCM2 configuration increases far from the eaves.
4. CONCLUSIONS
In this work, the authors have studied the performance of a combination of two passive cooling techniques: ASV systems and the use of PCM on a pitched tiled roof of a building. They used CFD with finite elements (COMSOL, v5.3) to develop numerical simulations under extreme hot conditions in a Mediterranean site (Ferrara, Italy). Three case studies were considered: a benchmark case (BM) with only the natural ventilation system on the building roof; a second study (PCM1) in which a PCM layer was laid over the roof deck; and a third one (PCM2) with the same PCM layer suspended in the middle of the ASV channel. Weather conditions were characterised by high temperatures and solar irradiance, with peak values of 38°C and 800 W/m2, respectively. A typical urban potential wind profile with a reference value of 1 m/s (at 10 m) at the inlet of the domain was taken into account. These low values of air speed would also resemble real urban situations in which street wind is not usually perpendicular to the building façade. k–ε with wall functions was used to model turbulence. A mesh independence study, in which the average air speed at the cross section in the middle of the ASV channel was used for comparison, was also developed.
It can be concluded that the PCM1 case slightly reduces building energy load (about 4%) with respect to the BM case in a 24-h period of time. In contrast, PCM2 configuration gets a reduction of about 18% (10 Wh/m2) in the same period. A study on surface temperature on the insulation layer (deck) revealed that the PCM1 case got an almost constant value, thus avoiding high fluctuations and delaying material degradation.
Although some of the results presented here have been observed experimentally, e.g. the velocity distribution within the ASV channel, future developments will involve the experimental confirmation of the issues and conclusions drawn by the energy performance numerical simulations.
REFERENCES
High Energy savings in building cooling by ROof TILEs shape optimization toward a better above sheathing ventilation (Life Herotile project). http://www.lifeherotile.eu/it/
