


Abstract
This research investigates the techno-economic assessment of a hybrid grid system of solar and wind power for a residual urban area in Khvaf town located in the eastern part of Iran. The temperature profiles of a 10-year period are gathered based on the existing solar and wind condition data. Simulation, economical and technical evaluations of this hybrid system are studied with the aid of HOMER software. To reach a proper independent structure from the total net present cost and energy cost viewpoints, thousands of cases were studied. Change of the factor investing on PV panels together with the amount of the sun radiance as well as change of the investment factor of wind turbines with the consideration of wind velocity and sun radiance on the system layout are studied and discussed. The initial investment is 440 thousand dollars and the contribution portion of the renewable energies is 84% for the case containing four wind turbines and a power grid system (optimal system). This optimal system returns the investment over a 4-year period which is very economically attractive. The optimal system for the case with a low mean wind speed of 3 m/s is preferred to involve 13-kW photovoltaic (PV) panels, one-wind turbine and a 10-kW converter with a power grid network. Results shown that when the cost of the PV panel is 0.6 times higher than the current cost, a system consisting 4-wind turbines connected to the grid network is still the optimal system. In addition, a sensitivity analysis is made on the load demand of the hybrid system and the renewable energy resource. As a result, the most influential variables on the performance of the system are identified in this research. Based on the economic and technical evaluation, establishing a hybrid grid system for a residential urban area is perfectly reasonable with the investment return during the fourth year of a 25-year project lifetime. Also, among the systems studied, a system with four wind turbines and a power grid system is chosen as an optimal system due to the fact that the region has favorable potential for wind energy.
1 INTRODUCTION
Before the invention of alternating current and manufacturing of large-scale steam driven turbines, the required electrical power for various applications including heating, lighting, driving force, etc. was generated at the vicinity of the consumption area. In the recent years, demand for energy is increased due to the rise of the population growth, the proliferation of industrial factories and considerable improvement in the human lifestyle [1–3]. As the industrial technology progressed rapidly, the growing demand for electric energy has caused construction of large-scale thermal power plants at further distances with regard to the energy consumption areas. These power generation units together with the high-voltage transmission lines and distribution of low- and high-voltage lines were supplying the needed energy for consumers across the country. The main advantages of this type of power generation network were the economical features of large-scale power generation and power transmission with high-voltage line and facile accessible fossil fuel usage [4]. In this structure, the electric power was transmitted through high-voltage transmission network to the medium-voltage and then to the low-voltage distribution network for distribution of energy among the consumers. Currently, developing large-scale thermal power plants causes a rising demand for fossil fuel which results in the depletion of the gas and oil reservoirs. However, these sources are limited and will be diminished soon, then there is a need for alternative energy sources [5, 6]. Also, undesirable effects on natural environment for the future generations including the effects of environmental pollution and the emission of greenhouse gases can lead to the creation of acid rain and increases the temperature of the atmosphere and vast changes in the climate conditions of the earth. Employing renewable energy sources seem to be a promising and rational solution that can help mankind to face these side effects and preserve the environment. Also, utilizing renewable energy resources such as wind, solar and geothermal due to the indigenous availability [7] help countries to reduce their dependency on fossil fuels [8].
Renewable energy takes the leading role in the future of clean energy industries and by now in some regions of the world, a large percentage of the electricity is supplied by the aid of renewable energies [9]. The renewable energy sources are mostly build to produce required power near consumers’ locations which is justified compared to large-scale power production away from the energy consumption locations, from an economical viewpoint [10]. As regards the modern society, the renewable energy source must have the ability to continuously supply the energy in a constant and stable level. To provide sustainable energy, dependency on a single energy carrier should be reduced and also energy production portfolio should be diversified [11]. The renewable energy resources in some period of times are not available or weak. Therefore, in order to have a continuous supply of energy, energy storage system is essential. According to the previous findings regarding the advantages and disadvantages of using hydrogen electrolyzer tank and batteries for the purpose of energy storage alternative, batteries are still the most suitable option as the energy storage system [12, 13]. Batteries are still a common type of storage apparatus used in renewable systems [14]. However, the lifetime of the batteries is short compared to the other system components and have to be replaced many times during the system lifetime contributing significantly to the total cost of the renewable system. Utilizing more than one renewable energy source increases the reliability and reduces the system storage size and consequently reduces the cost of system in the long-term [15]. Electricity production from wind and solar energies as distributed-energy resources (DER) is a much more proper approach compared to the development of thermal power plants and the other renewable energy sources from an economical point of view. Distributed power generators with small-size and production of power with a low-voltage and low current can be connected to the low-voltage power distribution network to secure safe, reliable and stable function of the electrical energy for consumers and for the whole power grid network [16]. In recent years, reduction in the design and operating costs of such systems are achieved via the remarkable advancement of manufacturing technology of wind turbines and photovoltaic (PV) panels [17, 18]. Economic, clean and reliable power production systems can be reached with the right combination of energy resources to reduce the total costs of the system. In the last decades, numerous studies are conducted to identify the technical and economic aspects of renewable energy sources as an alternative method to meet the demand for future energy production pathways. The next paragraphs will briefly discuss the recent advancement in this area of research. The application of a hybrid system was successfully implemented in one of the campuses of a Turkish university. Different hybrid systems were investigated under consideration of the cost of energy (COE), renewable fraction, total net present cost (NPC) and hydrogen production. All the analysis was performed by the HOMER software. The obtained results clarified that although the grid-connected PV hybrid system owed the lowest COE and NPC, the grid-connected PV/fuel cell hybrid system with COE 0.294 $/kWh had a somewhat higher cost than the optimum one [19]. Arnau González et al. [20] optimized the size of hybrid grid-connected PV-wind power systems based on real environmental data for a specific location. Their developed method was able to determine the size of the system with the minimum cycle cost. They also attempted to figure out more affecting and sensitive parameters in their analysis. Based on the obtained results, a combined grid of PV-wind power was found to be economically profitable in a considered rural area in Spain in such a way that after 18 years out of 25-years lifetime of the system, the system starts to make a profit. The effect of key parameters including the location, area and the shape of a considered site for establishing renewable energy harvesting was investigated by Alan Emanuel Duailibe Ribeiro et al. [21]. In their study, an integrated analysis was generated and adopted for two case studies at two different locations in Brazil. A significant dependence was found between the amount of generated power and key parameters of the system. The potential of implementation of wind and solar systems for energy production from brownfield sites were investigated by Adelaja et al. [22]. In the conducted research, Michigan and the USA selected as the case study and the required energy was supplied by the implementation of PV panels and horizontal axis wind turbines. The estimated harvest potential was obtained as 4320 (MW) of plate capacity for wind and 1535 (MW) for solar which is equal to 43% of Michigan’s residential electricity consumption. Ramli et al. [23] performed an analysis to determine the energy production via hybrid wind–solar energy systems by considering unmet electric load and excess electricity in the west coast of Saudi Arabia. The techno-economic analysis was carried out with respect to the energy harvesting and ultimate cost of the wind turbine and PV in the energy system via the MATLAB and HOMER softwares. The reported results indicated that for the same size of PV array and wind turbine, more energy was produced from PV array than the wind turbine generator with the levelized COE equal to $0.0637/kWh and $0.149/kWh, respectively. Belabes et al. [24] accomplished a technical and economic analysis concerning energy generation from wind for different locations in Algeria. With the help of WAAP (Wind Atlas Analysis and Application Program) and the adoption of annual wind speed of the considered locations and utilizing three commercial turbines, including AN Bonus 300 kW/33, AN Bonus 1.0 MW/54 and Vestas V80/2 MW, an evaluation was made to investigate the technical analysis for electricity production with consideration of capacity factors, annual power and energy outputs. Moreover, the present value cost (PVC) method was adopted for the economic analysis. Iran has a very diverse climate (11 climates out of the world’s 13) [25] including arid, semi-arid to subtropical along the Caspian coast and the northern forests, but the main part of Iran has an arid climate with high irradiated solar energy and strong winds in some parts which make this country a good candidate for renewable energy harvesting and electricity production [26, 27]. Qolipour et al. [28] studied the feasibility of the construction of hybrid wind and solar systems for the purpose of energy harvesting and hydrogen production in the South West of Iran. Technical and economic analysis accomplished with the aid of the HOMER commercial software. The reported results showed 3 153 762 kWh electricity productions with 31 680 kg of hydrogen per year. Jacobson and Delucchi [29] studied using of all renewable energy with solar, wind and water in all purposes. They concluded that fossil fuel energy is replaced with renewable energy by 2050. Yuehong Su et al. [30] presented a novel combined wind augmentation/solar concentration system. They concluded if output power of wind turbine and solar pond be equal, combination of them will give 50% increase in the total output power. Naseri et al. [31] analysed exergy destruction for a water and hydrogen production process driven by a solar power cycle. They obtained that with adding a stirling engine to the cycle, exergy destruction is reduced from 16.7% to 8.8%. Mir-Akbar Hessami [32] designed a hybrid solar and wind energy system to supply energy requirements for an isolated residential building. The above literature review suggests the utilization of renewable energy as the solution for energy problems, pollution, global warming and the future way towards clean energy industries in Iran. However, understanding this importance is incomplete without a proper techno-economic analysis to find out the best geographical location to apply such a technology as well as the most appropriate grid system specifically for that area. The main aim of the present study is to investigate the potential of establishing solar–wind hybrid power systems for electricity generation from the available solar and wind resources in a residual urban area in Khaf town located in the eastern part of Iran using Hybrid Optimization Model for Electric Renewable (HOMER) software.
2 DESCRIPTION OF THE MODEL SYSTEM AND THE CONSIDERED REGION
Hybrid power generation systems can effectively enhance the power consumption factor and the reliability of securing energy [29]. The complementary effect of renewable energy output and the power grid network together can reduce the need for energy storage sources which would make up the main costs. This system is about to be implemented in the Khvaf city located in the Eastern part of Iran with warm and dry weather conditions. This city has favorable solar and wind power potentials, therefore the values of these potentials with respective energy conversion components are considered as the input variables of the software.
2.1 Configuration of the model system
The system model includes wind turbines, PV panels, electricity grid, controller and the other auxiliary equipment and grid cables. Wind turbines over 10 kW mostly produce alternative current (AC) and directly connecting to AC bus [30] which are considered to be an advantage. On the other hand, PV units need converters to convert the DC to AC. The AC power output from the wind turbine directly supplies the base load and in case of higher electric load, the excess energy is fed into the grid network. If the wind turbine outlet is not able to provide the required electrical load, the stored energy in the grid network will make up this shortage. The main component of the power distribution system is the transformer that connects the AC/DC bus. The system architecture and energy flow for the wind–solar-grid system model is illustrated in Figure 1.
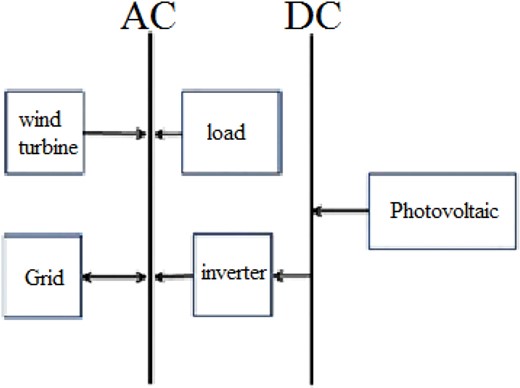
The energy flow diagram of the hybrid solar–wind grid system.
The system can be controlled easily as there is only one dispatchable source of electricity which is the power of the grid system. The net electric load is the difference between the actual electric load and the electric load of the output of the renewable energy. When this term is negative, it means that the power produced by the renewable energy sources is enough to secure the needed load and therefore the excess of the generated energy could be transferred to the power grid network. In addition, when the net electric load is positive, the only backup power source, the grid network, would provide the required electricity. The procedure of the operation of this kind of system is depicted in Figure 2.
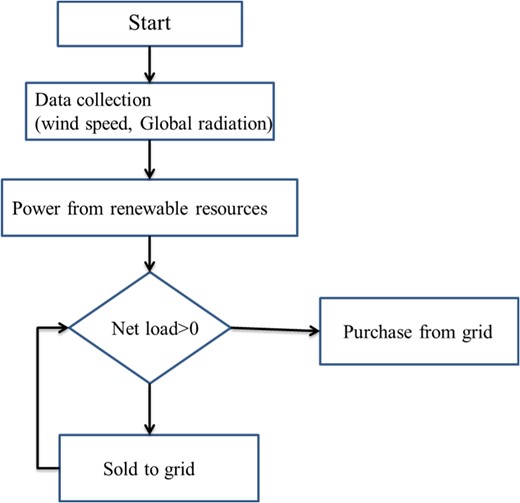
The procedure of operation of the Wind and Solar’s system models connected to the grid network.
2.2 Modeling of the system
The HOMER software is used to model Hybrid Renewable Energy Systems. This software is capable of designing, simulating and analyzing all sectors, from village power and island utilities to grid-connected campuses and military bases. Based on the considered equipment, the software examines all possible combinations of the equipment and may simulate hundreds or even thousands of systems and then sorts the systems according to the optimization variable of choice. It is recognized as a conventional worldwide software for investigating either grid-tied or off-grid environments. In addition, the optimal condition for integrating solar and wind energy sources into hybrid grid systems, economical facilities to mitigate the financial risk and an understanding of the hybrid renewable systems operating condition can be calculated. HOMER contains a mix of conventional generators, combined heat and power, wind turbines, solar PV, batteries, fuel cells, hydropower, biomass and other inputs.
2.2.1 The electric load profile of a residential complex
In this study, the daily electric load for a residential complex is estimated to be 530 kW per day. Accordingly, the electric load for different days and months is generated synthetically by adding a random value to create a reasonable load profile for a year by the HOMER. The load profile for a year at different months is illustrated in Figure 3.
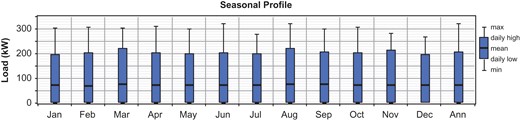
The consumed electric load profile of residential complex.
2.2.2 Renewable energy resources
The climate data related to this region for a period of 10 years including the amount of solar radiation, wind speed and the ambient temperature is obtained from the Iran Meteorological Organization. Figure 4 shows the average of solar energy resources monthly and Clearness Index for the present study. The clearness index is an input parameter in HOMER which is defined as the ratio of the solar radiation hitting Earth’s surface to the solar radiation striking the top of the atmosphere. This parameter is less than unity due to various affecting parameters including moisture, dust, clouds or even temperature differences in the lower atmosphere [31].
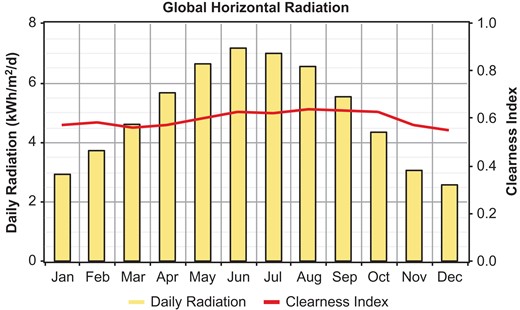
The monthly average area density of solar energy and clearness index for the case study.
The Graham algorithm is adopted in HOMER in order to calculate the real solar radiation values for each hour of a year. The minimum and maximum values of the data are for December and January, respectively.
Figure 5 displays the mean wind speed in different months of a year. The highest values of the mean wind speed are in the summer where the energy usage is higher than other seasons in Iran. Also, the average value of the wind speed in a year approximated to be 4.95 m/s which illustrates favorable conditions for the placement and operation of wind turbines in this region.
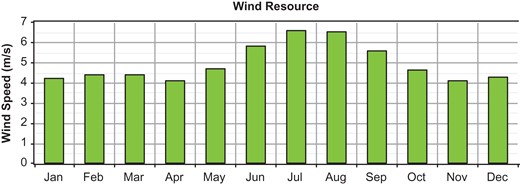
The average wind speed of the region.
In addition, the complementary nature of the two energy resources creates stable energy supply. Figures 4 and 5 show that the wind and solar energies together can provide a larger amount of energy compared to one energy resource and enhance reliability. This advantage causes a reduction in the need for the other energy storage sources such as batteries which raise the total cost of the system.
3 THE INFORMATION OF THE SYSTEM COMPONENTS
3.1 Photovoltaic panels
A solar cell is defined as a semiconductor apparatus which is designed for the purpose of turning solar irradiation to electricity. An array of PV panels produced DC power inherently and with the help of inverters, the produced DC electricity was converted to AC. The appropriate solar panel in the present study considered to be PV panels of Suntech Co. (Model STP210-18/Ud) based on the evaluation of different PV panels via HOMER. The technical specification of the chosen PV panels is summarized in Table 1.
The technical information of photovoltaic panels [32].
| Photovoltaic panel | |
|---|---|
| Suntech | Producer |
| STP210-18/Ud | Model |
| 210 W | Maximum power at standard condition |
| 26.4 DC Volt | Opt. operating voltage |
| 7.95 Amp. | Opt. operating current |
| 1482 × 992 × 35 mm | Dimension |
| 54 | Number of cells in 156 × 156 mm2 |
| $4000 | Capital cost |
| $4000 | Replacement cost |
| Zero | Maintenance cost |
| 80% | Derating factor |
| 34.57 | Tilt Angle |
| 25 years | Lifetime |
| 15 kW | Area PV capacity |
3.2 Wind turbine
The most important part of the wind energy apparatus design is the selection of an appropriate wind turbine. In this study, a wind turbine of the model (Furunder FL100) is installed (Figure 6). The specifications of the wind turbine along with the cost obtained from the 143 vendors are shown in Table 2.
The technical information of wind turbine [35].
| Wind turbine | |
|---|---|
| FL100 | Model |
| 100 kW | Nominal power |
| 137 kW | Peak power |
| 48 DC Volt | Output voltage |
| 3 m/s | Cut-in speed |
| 25 m/s | Cut-out speed |
| 35 m | Rotor height |
| $110 000 | Capital cost |
| $90 000 | Replacement cost |
| $3000 | Maintenance cost |
| 15 years | Lifetime |
| 4 unit | Area maximum wind turbine capacity |
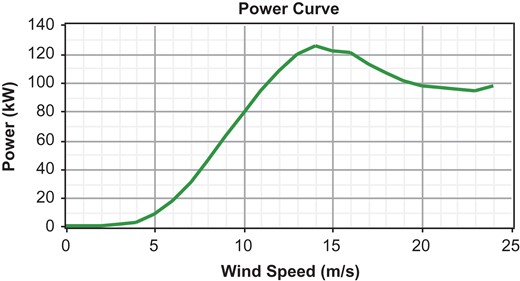
The wind turbine power curve.
3.3 The electrical power network
In the present research, the residential complex is considered to have a 500-kW branch network from the national power network with the frequency and voltage as 50 Hz and 220 V, respectively. The electricity company announced low, medium and peak load hours tariffs for the residential complex in 2015 as shown in Table 3. The climate condition data are collected from the IR of Iran organization for electric power affairs [36].
The price of the power consumption at different intervals and periods [36].
| Demand cost | Sold to grid ($ per kWh) | Cost of energy ($ per kWh) | Tariff |
|---|---|---|---|
| 0.016 | 0.021 | 0 | Off peak |
| 0.016 | 0.021 | 0.001 | Shoulder |
| 0.016 | 0.021 | 0.002 | Peak load |
| Demand cost | Sold to grid ($ per kWh) | Cost of energy ($ per kWh) | Tariff |
|---|---|---|---|
| 0.016 | 0.021 | 0 | Off peak |
| 0.016 | 0.021 | 0.001 | Shoulder |
| 0.016 | 0.021 | 0.002 | Peak load |
4 RESULTS AND DISCUSSIONS
4.1 The physical configuration of the system
The physical configuration of the system is designed based on the meteorological and power consumption data of Iran. Numerous systems were considered and analyzed to achieve an optimal structure, the configuration is shown in Figure 1. The simulation results of the HOMER software show that the optimized system includes wind turbines (4 units of 100 kW) and electricity network. The optimal system performance is discussed in the following sections and a sensitivity analysis of key parameter to detect changes in the results is conducted.
4.2 Operational performance of the system components
A summary of the operational performance of the wind turbine and some economic results of the wind turbine and power grid network are given in Table 4. As seen, the wind turbine capacity factor is fairly low due to a large amount of energy losses. The levelized cost of the wind turbine is estimated to be 0.0775 $/kWh.
Wind turbine performance specifications of the system.
| Data | Parameters |
|---|---|
| 400 kW | Nominal capacity |
| 85 kW | Avg. output |
| 21.2% | Capacity factor |
| 8009 h/year | Operating hours |
| 741 732 kWh/year | Total generation |
| 0.0775 $/kWh | Cost of energy |
| Data | Parameters |
|---|---|
| 400 kW | Nominal capacity |
| 85 kW | Avg. output |
| 21.2% | Capacity factor |
| 8009 h/year | Operating hours |
| 741 732 kWh/year | Total generation |
| 0.0775 $/kWh | Cost of energy |
The average monthly share of the electricity production from the wind turbine and as well as buying electricity from the power grid network are illustrated in Figure 7. It is observed that a great proportion of the generated energy is provided by the wind turbine due to the favorable wind potential of the region.
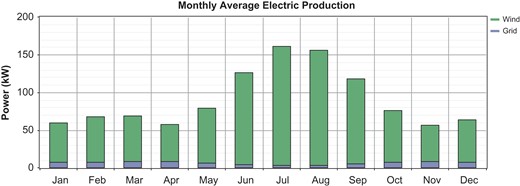
The share of the produced electrical energy from the wind turbine and grid network.
The wind turbine output during the summer months from July to September is very high which can meet the demand for electricity generation for cooling facilities. In addition, as the national power grid in Iran often reaches its highest peak in the summer, it is considered as a peak shaving off the grid.
The reason for high wind speed in the summer is that Khvaf is located in a desert and the temperature difference between the night and the day causes this phenomenon. This can be seen in Figure 8 which shows the wind turbine power output color profile. The climate condition data are collected from the IR of Iran meteorological organization [37].
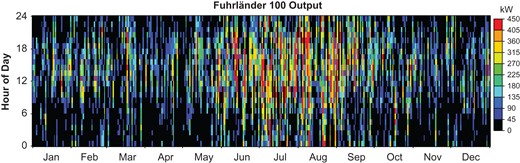
Color profiles of the annual energy output from wind turbine.
4.3 Economic analysis
After investigating the technical feasibility for establishing the hybrid power, it is necessary to pursue an economic analysis. It was shown that technically the system is capable of producing electricity but the price of each kilowatt-hour must be determined to analyze the hybrid power plant outcome.
The US dollar is considered as the currency in this research. The initial investment cost of the system (Including purchasing and cabling) and total NPC are 440 and −895.3 thousand dollars, respectively. The final cost of electricity is equal to −0.088 $/kWh. Figure 9 depicts the annual cash flow of the system components with the type of cost.
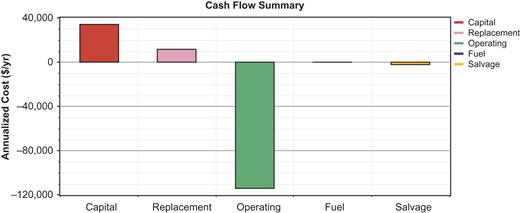
The annual cash flow of the system components with the type of cost.
The negative sign values mean the profits from the sale of electricity to the power grid. The initial investment cost, replacement cost and salvage value are all related to the wind turbine. The annual and cumulative cash flows are indicated by positive and negative signs for profit and cost, respectively, which are brought in Table 5. This analysis shows that the project investment return occurs in the fourth year of the 25-years project lifetime that is economically attractive.
Annual and cumulative cash flows for the system.
| Annual cash flow ($) | Cumulative cash flow ($) | Year | Annual cash flow ($) | Cumulative cash flow ($) | Year |
|---|---|---|---|---|---|
| 114 022 | 1 042 283 | 13 | −440000 | −440000 | 0 |
| 114 022 | 1 156 305 | 14 | 114 022 | −325978 | 1 |
| −245978 | 910 327 | 15 | 114 022 | −211956 | 2 |
| 114 022 | 1 024 349 | 16 | 114 022 | −97935 | 3 |
| 114 022 | 1 138 371 | 17 | 114 022 | 16 087 | 4 |
| 114 022 | 1 252 392 | 18 | 114 022 | 130 109 | 5 |
| 114 022 | 1 366 414 | 19 | 114 022 | 244 131 | 6 |
| 114 022 | 1 480 436 | 20 | 114 022 | 358 153 | 7 |
| 114 022 | 1 594 458 | 21 | 114 022 | 472 174 | 8 |
| 114 022 | 1 708 479 | 22 | 114 022 | 586 196 | 9 |
| 114 022 | 1 822 501 | 23 | 114 022 | 700 218 | 10 |
| 114 022 | 1 936 523 | 24 | 114 022 | 814 240 | 11 |
| 234 022 | 2 170 545 | 25 | 114 022 | 928 262 | 12 |
4.4 Flow of energy or analysis of energy balance
Figure 10 summarizes the whole system’s flow of energy. The wind turbine generates electricity as much as 741 732 kWh per year which constitutes 93% of the total electricity produced and then only 7% of the required electricity would be purchased from the grid network when the speed of wind is low. The amount of 603 178 kWh produced electricity per year is sold to the power grid which is the excess of production overload consumption.
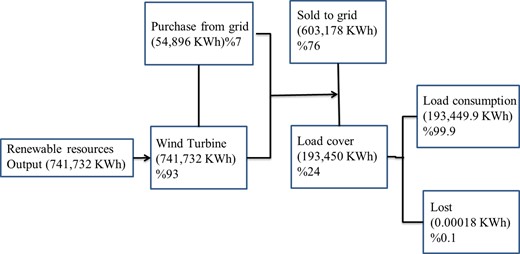
The energy flow of the system.
4.5 The results of hourly simulation
An example of simulation results for four consecutive days with maximum and minimum wind speed in July and late January, respectively, was conducted in this section. In Figure 11, the output energy of the wind turbine excesses the amount of energy demand, and thus, the electricity will be sold to the power grid network. However, in Figure 12, the output of turbine for providing the required energy is not sufficient and, therefore, electricity would be purchased from the grid network.
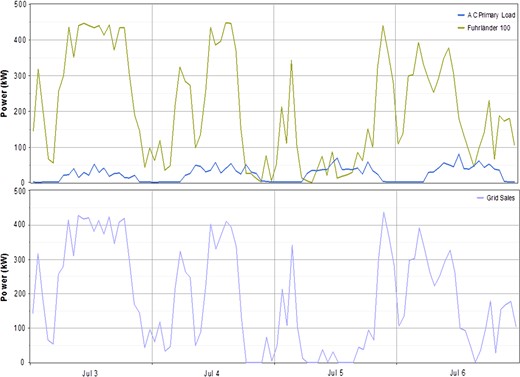
Selling electricity to the power grid in summer.
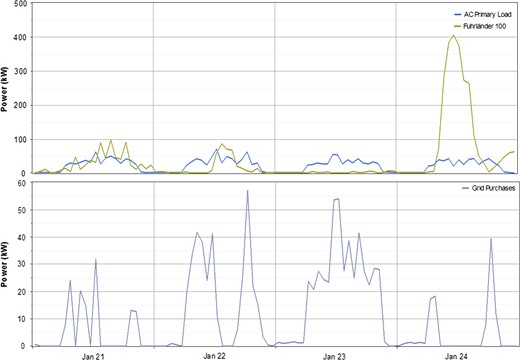
Purchase electricity from the grid in the winter.
4.6 Sensitivity analysis of the results
Key parameters in this study are the cost of wind turbines and solar panels, along with wind speed and solar radiation. To find the most optimal system/model, the model is simulated by frequently changing the parameters that have no control on the output.
4.7 The effect of changing the investment factor of photovoltaic panels along with the effect of radiation on the system layout
In this case, it is considered that the cost of the wind turbine is constant and the speed of the wind is 4.95 m/s, the average values of wind speed in a year. The results in Figure 13 show that when the cost of the PV panel is 0.6 times higher than the current cost, a system consisting four wind turbines connected to the grid network is still the optimal system.
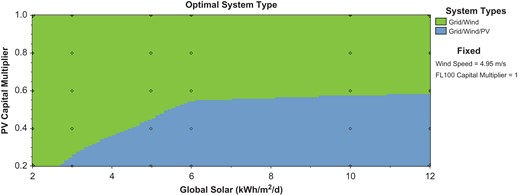
The impact of the change of the amount of radiation and cost of photovoltaic panels on the optimal arrangement of the system.
4.8 The effect of changing wind speed with the amount of solar radiation on the system layout
The results in Figure 14 show that the optimal system for a wind speed lower than 3 m/s is the PV-grid systems that secure the lowest cost of electricity (COE) as the wind turbine (WT) cannot operate because of the low cut-in speed. With the increase of solar radiation, the optimal system is still the one without PV panels and this indicates that the current cost of PV panels is high and should be reduced.
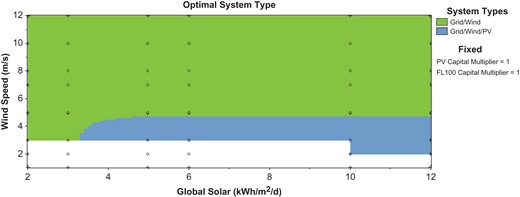
Effect of changes in the amount of solar radiation and wind speed on the optimal system layout.
4.9 The effect of changing the investment factor of wind turbine and the wind speed on the system layout
In Figure 15, the optimal system for the case with a low mean wind speed of 3 m/s is preferred to involve 13-kW PV panels, one-wind turbine and a 10-kW converter with a power grid network. At this condition, when the cost of the wind turbine is 0.3 times the current cost, the optimal system includes two units of wind turbines with a power grid.
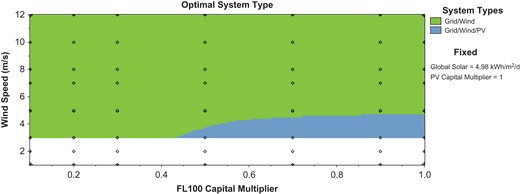
The effect of the change of wind speed and the cost of wind turbine on the optimal system layout.
4.10 The effect of the change of the investment factor of photovoltaic panel and wind turbine on the system layout
In Figure 16, as the cost of the investment of PV panels is 0.45 times lower than the current cost, using PV panels is economical and employing them in the system layout is justified. Because the wind potential of the region is favorable for the use of wind turbines even with a considerable reduction cost of the PV panels, employing a wind turbine in the system configuration is recommended.
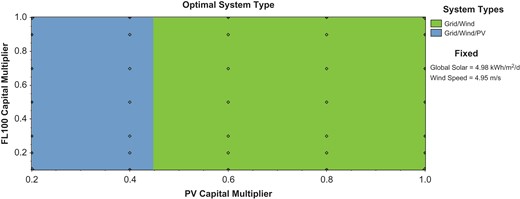
Effect of changes in the cost of the photovoltaic panels and wind turbine on the optimal system layout.
5 CONCLUSIONS
Despite the vast potential in renewable energy sources in Iran, this kind of clean energy source has not been significantly studied and implemented. In the present study, the feasibility, economic and technical evaluation of a hybrid grid system of solar and wind power for a residual urban area were carried out in the Khvaf town located in the eastern part of Iran via the HOMER software. More than 600 hybrid systems were simulated with a variety of layouts but only 182 of these systems have the capability to supply electric charge. Based on the wind potential of the area, it is convenient to increase the number of wind turbines with respect to filled the space which results in more profit. The initial investment is 440 thousand dollars and the contribution portion of the renewable energies is 84% for the case containing four wind turbines and a power grid system (optimal system). This optimal system returns the investment over a 4-year period which is very economically attractive. The finished cost of electricity is −0.88 $/kWh, and the current net cost is −895.3 thousand dollars. The maximum amount of electricity sold to the power grid network occurs in July and August as in these months, wind turbines having high capacities of power production due to high average wind speed which would neutralize the effect of the cooling load in summer.
HIGHLIGHTS
Techno-economic assessment of a hybrid grid system of solar and wind power are done.
Based on results, optimal system for a wind speed lower than 3 m/s is the PV-grid systems.
Total NPC and energy cost for various cases were investigated by adopting Homer software.
Sensitivity analysis is conducted to reveal the effect of key parameters on results.
The amount of 603 178 kWh produced electricity per year is sold to the power grid.
NOMENCLATURE
| NPC | Net present cost |
| COE | Cost of electricity/energy |
| DER | Distributed-energy resources |
| DC | Direct current |
| AC | Alternating current |
| PV | Photovoltaic panel |
| fPV | Derating factor due to dust and temperature effect, etc. |
| IT | Total incident radiation on the panels’ surface area (kWh/m2) |
| IS | Solar radiation intensity (kWh/m2) |
| YPV | The nominal capacitance of panels (kW) |
| WT | Wind turbine |
FUNDING
This research was supported by the National Natural Science Foundation of China (Grant no. 51778511), Hubei Provincial Natural Science Foundation of China (Grant no. 2018CFA029), Key Project of ESI Discipline Development of Wuhan University of Technology (Grant no. 2017001) and the Scientific Research Foundation of Wuhan University of Technology (Grant no. 40120237).
