


Abstract
In this paper, the influence of split-vanes attached to the end of grid spacers on local flow and heat transfer was investigated at a pressure of 25 MPa, a mass rate of 1000 kg/m2s and a heat flux of 800 kW/m2K for the sub-channels of an supercritical water reactor core. The numerical results show that there are obviously different distributions of wall temperature in three regions. The circumferential heterogeneities of the heat transfer are evidently enhanced at the downstream of the grid spacers with split-vanes. Additionally, there is a phenomenon of weakened heat transfer at the downstream of the grid spacers in the large specific heat region.
1 INTRODUCTION
The core of a supercritical water reactor (SCWR) contains fuel assemblies, also known as fuel rod bundles. Grid spacers installed at regular intervals in each fuel assembly are used to keep the fuel rods in place and prevent excessive vibration. However, the flow and heat transfer of the sub-channels in an SCWR core is also affected by the grid spacers. Grid spacers are therefore designed not only to enhance turbulent mixing within the surrounding sub-channels, but also to increase the heat transfer between the fuel element and the coolant. Split-vanes attached to the end of grid spacers are a common practice. The vortex generated by the split-vanes can promote the mixing between the fluid near the rod surface and cooler fluid in the center of sub-channel [1]. The effect of grid spacers on heat transfer has attracted considerable scholarly attention [2, 3]. Chang and Tavoularis conducted three-dimensional unsteady simulations of grid spacers with split-vanes. Rehme and Hassan used experimental methods to study the role of grid spacers in the heat transfer process during the gas cooling process in rod bundle sub-channels [4]. Their experimental results show that grid spacers are effective at enhancing the heat transfer of the sub-channels. Rehme also studied the structure of turbulent flow through the fuel rods, finding that this differed from the turbulence in the tube [5]. Yoder et al. illustrated the effect of grid spacers on fuel rod heat transfer in a steady-state film boiling experiment [6]. McClusky et al. experimented with the circumferential development of the vortex flow in rod bundle sub-channels [7]. The vortex generated by the split-vanes attached to the end of the grid spacers. Wu and Trupp studied the distribution of abnormal turbulent density in fuel rods [8]. The results show that the measured secondary flow model cannot explain the distribution of abnormal turbulence density. Shen et al. used a Doppler velocimeter to measure the average velocity and instantaneous velocity (Re = 14 200) in the flow between the 16 rods [9]. The results show that the mixing rate changed with the deflection angle of the split-vane on the grid spacers. Yang studied experimentally the influence of the grid spacers with split-vanes on the turbulence structure [10]. He also obtained the turbulent recession of grid spacers from the measured data. Lee and Jang studied the secondary flow in a rod bundle using the non-linear k–ε turbulence model [11]. The results show that the non-linear k–ε turbulence model cannot be employed to simulate the turbulence process in sub-channels. Smith et al. simulated the inner flow field of fuel assemblies that have grid spacers with split-vanes using the RNG k–ε model [12]. The simulation results are in good agreement with the experimental data.
In order to study further the effects of split-vanes, computational fluid dynamics (CFD) are adopted for numerical simulation, and the simulation results are then verified by comparison with the experimental data. Cheng et al. originally studied the thermal hydraulic characteristic of supercritical water in the reactor core using the fluid simulation software CFX-5.6 in 2007 [2]. The effect of grid geometry, the turbulence model and the sub-channel structure were analyzed and the concept of heat transfer deterioration was proposed. Circumferential heterogeneities were also observed in the heat transfer in the sub-channels. Conner et al. presented additional hydraulic benchmark data obtained for PWR rod bundles with the purpose of benchmarking CFD models of the rod bundles [13]. Zhu et al. investigated the effect of grid spacers on the local heat transfer performance of the supercritical water flow within the inner sub-channel of a tight hexagon rod bundle [14]. Due to the reduction of the flow area, the local heat transfer of the grid spacer strap is greatly enhanced. The cause of enlarged circumferential heterogeneities of temperature and heat transfer weakening near the narrow gap occurring at the downstream of the grid spacer is the increased flow blocking.
Many researchers have studied the physical properties of supercritical water and the role of grid spacers. However, due to the dramatic changes in the physical properties of supercritical water near the critical temperature in the large specific heat area and the complicated flow in the sub-channels, previous studies have rarely examined sub-channels with grid spacers in the large specific heat region. This paper uses a structured grid discrete computing domain to simulate and analyze the flow and heat transfer in the two types of sub-channels (with or without grids) in the large specific heat region of an SCWR, and provides a reference for SCWR design.
2 NUMERICAL APPROACH
2.1 Boundary conditions
This paper analyzes the fluid domain but not the cladding conductivity, and the grid spacers ensure thermal isolation.
Supercritical water properties use the existing type in CFX 14.5: steam 5 l, as defined by the International Association for the Properties of Water and Steam. The entrance is set to the quality entrance; the outlet is set to pressure outlet; and export pressure is determined. The heat flux of the heating surface is uniform, and the surface is smooth and not slippery. The plane of symmetry is set to cyclic symmetry.
The convergence criteria for the numerical calculation are set to 10−6, and a monitoring point is set up near the outlet to detect the fluid temperature.
The simulation of pitch ratio and constant system pressure are the main focus of this paper. The conditions of the simulation are listed in Table 1.
Dimensions of rod bundle and physical conditions.
| Fuel rod arrangement | Hexagonal |
|---|---|
| Fuel rod diameter | 8 mm |
| Thickness of grid spacer | 0.3 mm |
| Ratio of pitch to diameter, P/D | 1.125 |
| Inlet mass flux | 1000 kg/m2s |
| Outlet pressure | 25 MPa |
| Average heat flux | 800 kW/m2 |
| Fuel rod arrangement | Hexagonal |
|---|---|
| Fuel rod diameter | 8 mm |
| Thickness of grid spacer | 0.3 mm |
| Ratio of pitch to diameter, P/D | 1.125 |
| Inlet mass flux | 1000 kg/m2s |
| Outlet pressure | 25 MPa |
| Average heat flux | 800 kW/m2 |
2.2 Mesh generation
The quality of the mesh directly affects the accuracy of the numerical simulation results. For complex geometries, the division of the mesh is of particular importance. In order to simulate the fluid flow of the SCWR core and address the question of heat transfer, it is reasonable to calculate the domain accurately and divide the mesh. When the grid is sparse, the calculation time is short, but the precision is not high. On the other hand, when the grid is dense, the calculation time is longer but the result is closer to the real situation. Therefore, it is important to take the computer conditions, the calculation of time and accuracy into consideration. It is also important to select the appropriate mesh structure. Due to the fact that the physical properties of the near wall change dramatically, the mesh structure of the near wall should be reasonable. In this paper, the structured grid of the fluid domain is divided using ICEM. The grid of the boundary layer and the area changed by the flow field need densification treatment to ensure the quality of the mesh. This measure can increase the speed and accuracy of the calculation.
In this paper, the CFD code ANSYS CFX is adopted to investigate the effect of split-vanes attached to the end of grid spacers on local flow and heat transfer within a tight hexagon rod bundle at supercritical pressure. The length of the seven-rod bundle is 900 mm, and the distance between grid spacers and inlet is 300 mm. The configuration employed in this paper is schematically shown in Figure 1. It consists of a tight hexagon rod bundle comprising seven fuel rods and one grid spacer. The shaded area generated by the symmetrical structure of the rod bundle shown in Figure 1 represents the inner sub-channel within a rod bundle. Additionally, the shaded area is selected as the numerical analysis region to save computing time. This paper investigates the influence of split-vanes attached to the end of grid spacers on local flow and heat transfer. Taking into consideration the symmetry of seven-rod bundle and the desire to save calculation time, the area shown in Figure 1(b) is regarded as a fluid domain to simulate.

Sketch of structure for seven-rod bundle. (a) Front view of grid spacer with split-vanes (b) Geometry of inner sub-channel for CFX analysis.
In order to expediently analyze the simulation results, the position of the cladding surface is defined in Figure 2. The special positions of the cladding surface are the shortest and longest distances between two neighboring fuel rods. The positions of 0° and 30°(or −30°) are labeled as the narrow gap and the sub-channel center, respectively.
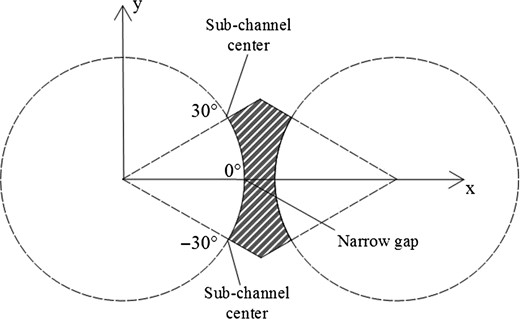
Circumferential angle of cladding.
The velocity fluctuation in the turbulent boundary layer will account for the majority of the average turbulence velocity. The mesh division of the fluid domain is performed in ANASYS ICEM. During the division of the mesh, the solid–liquid interface needs encryption. The typical division is shown in Figure 3. The mesh independency study has shown that the calculations are approximately mesh independent when the number of cells reaches 1.78 million.
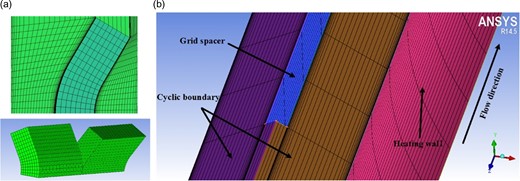
Grid division. (a) Mesh of grid spacer with split-vanes (b) Mesh around grid spacer.
2.3 Numerical method validation
The main difference between numerical analysis is the choice of turbulence model under supercritical pressure. Therefore, the verification of numerical methods is mainly to verify the turbulence model. The verification of supercritical water in the tube is based primarily on the Yamagata experiment [15].
The flow and heat transfer of supercritical water in horizontal and vertical ducts was studied experimentally. The temperature of the outer surface of the tube was measured. The tube with a diameter of 10 mm has 17 measuring points and the tube with a diameter of 7.5 mm has 18 measuring points. The independent variables in the experiment and their ranges are listed in Table 2.
Independent variables and their range.
| Pressure | 22.6 MPa, 24.5 MPa, 29 MPa |
| Fluid temperature | 230–540°C |
| Heat flux | 116–930 kW/m2 |
| Mass flow rate | 310–1830 kg/m2s |
| Flow direction | Vertical up and down |
| Pressure | 22.6 MPa, 24.5 MPa, 29 MPa |
| Fluid temperature | 230–540°C |
| Heat flux | 116–930 kW/m2 |
| Mass flow rate | 310–1830 kg/m2s |
| Flow direction | Vertical up and down |
The physical properties of supercritical water change dramatically near the pseudo-critical temperature, the heat transfer coefficient vary with the heat flux. In this paper, the vertical upward flow is the single flow direction. Figure 4 shows a comparison between the RNG k-ε, LRR, SST, RSO and SSG turbulence models. The comparison can be divided into two aspects: diameter and heat flux.
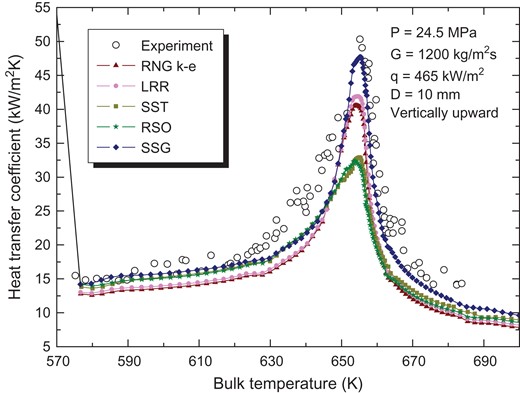
Comparison between simulated results of five turbulence models and experimental result in the 10 mm-diameter tube.
It can be seen from Figure 4 that the tendency of heat transfer coefficient of the five turbulent models is almost identical. When the temperature is lower (<630 K) and the temperature is higher (>655 K), the simulation results of the five turbulent models are small. In the range of 620–645 K (the large specific heat region), the results of the heat transfer coefficient of the five turbulent models are significantly different from those of the experimental results. The simulation results using the RSO and SSG models are very close before the large specific heat region; indeed, the two values almost coincide between 630 K and 645 K. Both results are slightly smaller than the experimental results. However, the gap between the two widens in the large specific heat region. The simulation results using the RNG k–ε and LRR models are also very similar, and compared with the experimental results, the simulation values of the heat transfer coefficient are too small. The peak value of the heat transfer coefficient predicted by the SSG model is smaller than the experimental value, but it is very close to the experimental value, with a deviation of only 6%. In the region of above 655 K, the heat transfer coefficient of the SSG model is larger than that of the other four models, which is close to the experimental value. Therefore, verification of the turbulence model shows that the SSG model can best predict the heat transfer of supercritical water in the 10 mm-diameter tube.
This paper verifies the suitability of the turbulence model for sub-channels with grid spacers by comparing relative radial turbulence. In Figure 5, we see that in the narrow gap region, regardless of whether the inlet flow rate is 3.0 m3/s or 0.5 m3/s, the prediction results of the LRR model and the SSG model are in good agreement with the experimental values. In particular, when the distance to the end of the grid is extended from 50 mm to 200 mm, the results of the SSG model are closest to the experimental values. It can be seen from the figure that when the mass flow rate is 0.5 m3/s, the result of the RSO model fluctuates the most. The values predicted by the five models are basically coincident and are basically consistent with the experimental results when the distance to the end of the grid is >50 mm.
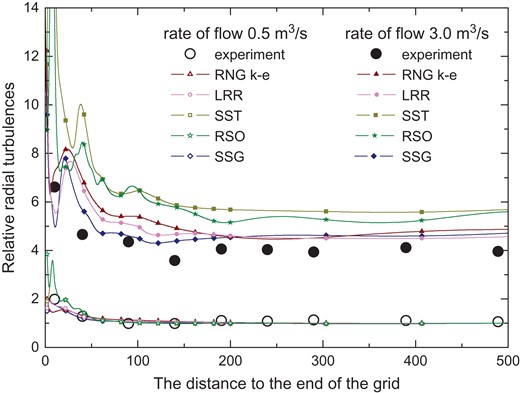
Comparison of relative radial turbulences in the narrow gap region.
However, Figure 6 shows that in the sub-channel center, when the inlet flow rate is 0.5 m3/s, the prediction results of the SSG model are in agreement with the experimental results when the distance to the end of the grid is extended from 20 mm to 50 mm. The LRR and SSG models are in good agreement with the experimental results for distances from 50 mm to 500 mm. When the inlet flow rate is 3.0 m3/s, the simulation results of the SST and RSO models have a large deviation from the experimental values for distances from 50 mm to 200 mm. However, the simulation results of the SSG model agree well with the experimental results when the distance to the end of the grid is extended from 40 mm to 200 mm.

Comparison of relative radial turbulences at the sub-channel center.
The effects of the turbulence model on the heat transfer performance for the upward water flow at supercritical pressure have a decisive impact on the precision of the simulation results of the CFD analysis. Cheng et al. and Gu et al. found that the SSG turbulence model equation can well fit the supercritical water heat transfer [2, 3]. The different characteristics of flow and heat transfer were analyzed according to the numerical simulated results and the experimental data.
The convective heat transfer of supercritical water can be regarded as steady state.
Zhu et al. [16] carried out a comparison study of five turbulence models (the RNG k–ε model, the shear stress transport model, the SSG model, the Launder Reece and Rodi quasi-isotropic model and the Omega Reynolds stress model) and compared against the experimental data of Yamagata et al. They concluded that the SSG Reynolds stress model is more suitable to the current numerical simulation.
In this paper, the SSG Reynolds stress model is used to simulate the flow in the sub-channel.
2.4 Mesh independent verification
In general, the density of the grid can contribute to the accuracy of the simulation results. However, the number of grids required will place a high demand on the computer and the calculation time is long. The influence of grid conditions on the simulation results can be avoided by verifying mesh independence, especially the number of grids and the grid near the wall. The dimensionless distance of the first layer of the mesh to the wall can be expressed by y+. Additionally, y+ relates to speed, viscosity and shear stress, and is used to determine whether the arrangement of the boundary layer is reasonable. Five grid systems of mesh independent verification are listed in Table 3. The sub-channel of grid spacers with split-vanes will get on mesh independent verification.
Various mesh independent verification systems.
| Case | 1 | 2 | 3 | 4 | 5 |
|---|---|---|---|---|---|
| Number of grids | 610 000 | 1 160 000 | 1 780 000 | 2 200 000 | 2 800 000 |
| y+ | 0.8 | 0.3 | 0.2 | 0.1 | 0.05 |
| Case | 1 | 2 | 3 | 4 | 5 |
|---|---|---|---|---|---|
| Number of grids | 610 000 | 1 160 000 | 1 780 000 | 2 200 000 | 2 800 000 |
| y+ | 0.8 | 0.3 | 0.2 | 0.1 | 0.05 |
The flow of supercritical water in the sub-channels studied in this paper is the steady flow of single-phase fluids. We verify only the wall temperature of the narrow gap under different grid systems. The results are shown in Figure 7.
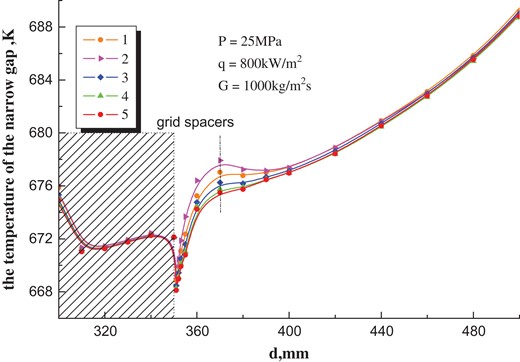
Distribution of the wall temperature in the narrow gap under the different mesh systems.
It can be seen that the results of the three grid systems represented by curves 3, 4 and 5 are in good agreement and within an acceptable range. The different maximum distribution of the wall temperature in the narrow gap occurs in the downstream of the grid spacers under different grid systems. The gap of curves 3, 4 and 5 is smaller in this range; the narrow gap at the entrance (370 mm) has the largest temperature difference in the five cases. The temperature difference is 0.9 K for curves 1 and 2, 0.9 K for curves 2 and 3, 0.4 K for curves 3 and 4 and only 0.2 K for curves 4 and 5. From the above results, when the y+ of the minimum near wall mesh is <0.57, it is close to the mesh independent. This paper will take the mesh systems of curve 3 to conduct the simulation analysis in consideration of calculation time and computer resource consumption.
3 NUMERICAL RESULTS AND DISCUSSION
3.1 Flow and temperature distribution in the sub-channels
This paper considers the temperature distribution based on the study by Zhu et al. [14]. There are three regions in the sub-channel. Three regions are: the low-enthalpy region, the large specific heat region and the high-enthalpy region. The naming method is linked to the enthalpy of the coolant. Moreover, the dimensionless distance Zr/Dh. Zr is defined as the distance between the end of the grid spacer and the designated spot; Dh is the hydraulic diameter of the sub-channel.
The distribution of the wall temperature in the sub-channel with and without grid spacers between the positions of Zr/Dh = 0 and Zr/Dh = 3.16 is shown in Figure 8. As can be seen in Figure 8, along the flow direction, the maximum cladding temperature starts to shift from Zr/Dh = 0. The temperature difference in the range shown in the figure also gradually increases from left to right, because the temperature of the mainstream fluid at the position of the right frame is closer to the pseudo-critical temperature and a greater specific heat is produced. Circumference heterogeneity of the wall temperature in the sub-channel with grid spacers is larger than in the sub-channel without grid spacers. The narrow gap between the sub-channel without grid spacers has the highest cladding temperature. However, it appears at the angular position of −10° in the sub-channel with split-vanes attached to the grid spacers. This position is opposite to the oblique direction of the blade and is not in the middle of the cladding surface. Compared to the sub-channel without grid spacers, the heat transfer performances in the sub-channel with grid spacers are better. The vortex generated by the split-vanes at the downstream of the grid spacers is the main reason for the heat transfer enhancement. The swirling flow not only enhances the local heat transfer of the sub-channel, but also promotes the heat and mass exchange of the adjacent sub-channels. The enhancement of the local heat transfer of the large specific heat region can be seen most clearly by comparing the three images of the sub-channel with grid spacers.
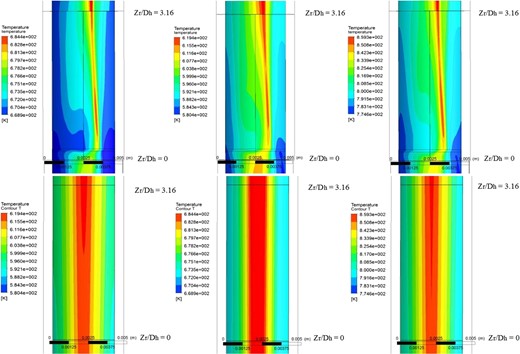
Wall temperature distribution in the downstream of the grid spacers.
3.2 Heat transfer coefficient
The distribution of the wall temperature and heat transfer coefficient compared with those of the sub-channel without grid spacers is illustrated in Figure 9. The change in the cladding temperature and the heat transfer coefficient is similar in all three regions. The existence of split-vanes attached to the end of the grid spacers reduces the flow area of supercritical water in the sub-channel, increases the flow rate and enhances heat transfer. The existence of split-vanes downstream of the grid increases the fluid disturbance in the sub-channels and enhances heat transfer. The internal heat transfer coefficient of the sub-channel center rises rapidly, and the change range of the heat transfer coefficient in the narrow gap area is relatively small.
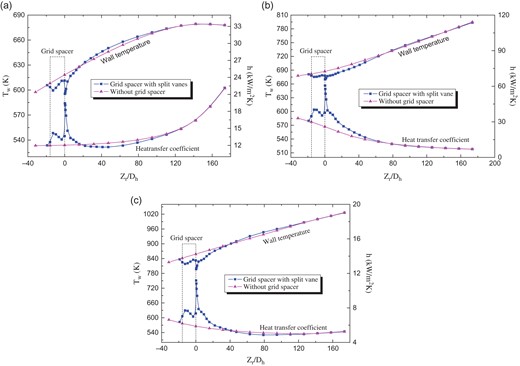
Distribution of the wall temperature and heat transfer coefficient along dimensionless distance in the three regions. (a) Low-enthalpy region. (b) Large specific heat region. (c) High-enthalpy region.
Because the fluid flow area in the sub-channel center is larger than the narrow gap area, the fluid mixing between the narrow gap area, the sub-channel center and the adjacent sub-channels is more sufficient. The cause of heat transfer weakening at the downstream of the grid spacers in sub-channel compared with the sub-channel without grid spacers is that the vortex generated by the split-vanes adversely affects the local heat transfer of the sub-channel. This phenomenon is primarily manifested in the large specific heat region. A similar phenomenon was identified by Holloway et al. in their experimental research on the pressurized water reactor [17]. Their study indicated that the causes for the decrease in the heat transfer are the deficits of axial velocity and the migration from swirling to flow structure. Weakened heat transfer is most obvious in the low-enthalpy region. It is also barely discernible in the large specific heat region. The cause may be associated with the buoyancy, flow acceleration effects and the specific heat variation on the turbulent boundary layer [18].
3.3 Vortex and secondary flow
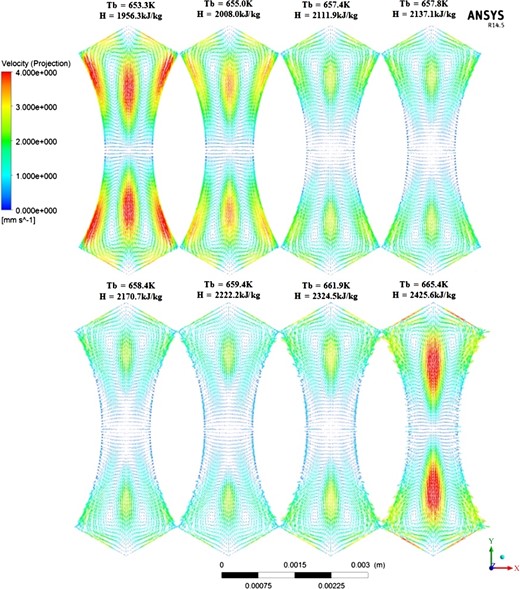
The vortex generated by the split-vanes in the sub-channel can be seen most clearly at the cross-section of Zr/Dh = 0.32 in Figure 10. The vortex is the same in all three enthalpy regions. The vortex appears in the dip direction of the vane under the stream guidance of the vane. The coolant also flows together in this direction. The reason why the heat transfer is insufficient and the wall temperature is higher than that of the other regions is that the flow mass decreases in the opposite dip direction of the vane. This phenomenon is in good agreement with the distribution of the wall temperature seen in Figure 8.
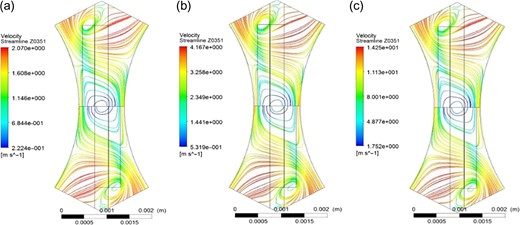
Streamline on cross section of Zr/Dh = 0.32 in three regions. (a) Low-enthalpy region (b) Large-specific heat region (c) High-enthalpy region.
The flow in sub-channels without grid spacers do not have spoiler, and the secondary flow is weaker. The distribution changes with the change of flow and physical properties of supercritical water.
As shown in Figure 11, the maximum velocity of the secondary flow in the section is 0.004 m/s in the sub-channels without grid spacers. This is of course far lower than the mainstream speed. Along the flow direction, the secondary flow is weakest in the large specific heat region. The change in the secondary flow in the flow direction is related to the density of the supercritical fluid. We found that the smaller the section temperature difference, the smaller the secondary flow is also weaker. When the temperature of the cross-section fluid is far from the critical temperature of supercritical water, the specific heat at constant water pressure is smaller, which increases the temperature difference between the fluid near the wall and the mainstream fluid. The temperature difference between the water produces a difference in density, which facilitates the mixing of the fluid near the wall with the mainstream fluid, which in turn makes the secondary flow stronger. In contrast, the specific heat at constant water pressure is larger but the temperature difference between the fluid near the wall and the mainstream fluid is smaller. The weakness of the secondary flow is not conducive to the mixing of the fluid at the two locations. The change in the secondary flow is obviously affected by the specific heat. When the specific heat of the supercritical water is lower, the temperature of the narrow gap is high, but the density is low. In contrast, the temperature of the sub-channel center is small, but the density is high, which facilitates the flow of the fluid in the narrow gap into the sub-channel center. When the specific heat is high, the temperature difference of the fluid between the narrow gap and the sub-channel center is small at the same cross section, and the flow is significantly weakened. The distribution of the secondary flow in the eight cross sections is similar: the wall temperature of the narrow gap is at its highest, but the secondary flow is at its weakest. The secondary flow is strongest at the wall near the central area and the middle between the narrow gap and the sub-channel center. As the flow progresses, the movement of the strong secondary flow near the wall of the sub-channel center weakens.
Distribution of second flow on different cross sections along the flow direction.
The secondary flow between the narrow gap and the sub-channel center is continuously enhanced. Near the wall area, the secondary flow of the larger place corresponds to the lower temperature, which indicates that the secondary flow can promote the heat transfer of the fluid in the sub-channels.
4 CONCLUSION
This paper has investigated the influence of grid spacers on local flow and heat transfer using the numerical method. The simulation results have been analyzed and discussed in detail. Some of the main conclusions achieved so far are summarized below:
The circumferential heterogeneities of the heat transfer performance in the sub-channels are affected and evidently enhanced at the downstream of the grid spacers with split-vanes. The highest wall temperature appears at the angular position of −10°, and there is no grid spacer in the sub-channel where the angle is 0°.
There is a phenomenon of heat transfer weakening at the downstream of the grid spacers in the large specific heat region.
The vortex generated by the split-vanes is similar in the three enthalpy regions.
ACKNOWLEDGMENTS
The authors acknowledge the financial support of the National Natural Science Foundation of China (No. 51876024) and the Open Foundation of the Key Laboratory of Nuclear Reactor Systems Design Technology. The authors thank the anonymous reviewers for their helpful comments and suggestions related to this paper.
