


Abstract
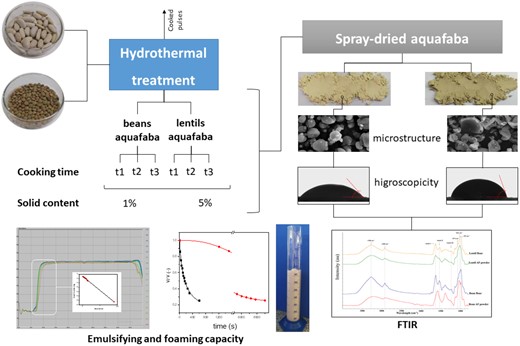
The effect of cooking time and the solid content was analysed in the techno-functional properties of lentils and common beans aquafaba, and their powders obtained through spray-drying. Foam drainage kinetic and emulsion destabilisation were successfully modelled showing that lentil aquafaba had better foaming capacity than beans, due to its higher protein content. Moreover, an increase in cooking time results in more liquid incorporated into the foam and a longer lag phase. Bean aquafaba had acceptable emulsifying capacity, attributable to higher soluble carbohydrates. Additionally, microstructure, Fourier Transform Infrared Spectrometry, rehydration capacity, and flowability of aquafaba powders were studied. Microscopy of dried lentil aquafaba showed damaged and collapsed particles, while bean powder consisted of spherical smooth particles. The dominant factor influencing aquafaba functional properties and powder characteristics was the legume type, attributed to their chemical compositions. These findings broaden the insights of alternative sources of aquafaba and enhance the industrial applicability of these residues through highly rehydratable and functional powders.
Introduction
The industrialization of legumes to obtain canned, frozen, or derived products generates large volumes of liquid by-products that, if not treated or reused, will impact the environment.
Additionally, the generated wastewater contains large amounts of pulses nutrients, lost from the food chain, that could be upcycled. The current consumption of plant-based foods has been increasing exponentially in the last years. Moreover, a further increase is expected, based on the consumer demand for vegetarian, vegan, and other alternatives, so it would be beneficial to take advantage of existing waste as raw material. The possibility of capitalising these effluents into a functional ingredient requires studies to evaluate their physicochemical properties.
The term aquafaba (AF) refers to the cooking water of legumes or the one present in their canned products. Recent studies showed that this liquid could produce stable foams, emulsions, and gels. According to Stantiall et al. (2018), aquafaba has great applicability and sensory results compared to eggs, in food products. For this reason, its application has been increasing in many groups with different dietary requirements (Silva et al., 2023). Most of the literature on this subject is focused on chickpea cooking water and generally using the residual product obtained from commercial cans (Stantiall et al., 2018; He et al., 2021a; Tufaro & Cappa, 2023). However, several other pulses by-products have the potential to be used and require to be explored not only the source but also the effect of the pulse processing condition on the characteristic of this residue. Lentils (Lens culinaris) are richer in soluble and insoluble fibres than peas and chickpeas (Brummer et al., 2015). Lentils also have a higher protein content than chickpeas (Jarpa-Parra, 2018). Moreover, several functional advantages have been reported (higher solubility, foaming stability, and water-holding capacity, among others) regarding whey protein and egg white proteins. On the other hand, common beans (Phaseolus vulgaris L.) are widely consumed worldwide, especially by low-income populations, attributed to their best nutrient-to-price ratio (Nagai et al., 2022). In general, common beans contain higher minerals content than chickpeas and lentils.
A conventional process to obtain aquafaba starts with the soaking step of the dry legume to allow water migration into the grain, reducing the cooking time and leaching most of the anti-nutritional compounds. Boiling is the simplest hydrothermal treatment of legumes, and the final characteristic of the cooking water will depend on the relationship between the type of legume and the intensity of the hydrothermal process.
Unfortunately, aquafaba has a high water content, reducing its marketing possibilities, so a dehydration process could be applied to minimise transport costs, improve its storage, and avoid microbial growth (He et al., 2021b). Considering that the aquafaba is a waste product, the applicable process should not be expensive. Spray-drying is one of the industry's most widely used dried particle formation processes.
The present work aimed to study the functional properties of aquafaba from common beans and lentils, analysing the effect of cooking time, and solid content. Furthermore, the impact of the drying process on the microstructure and physicochemical characteristics of the powders was assessed.
Materials and methods
Materials
Commercial common beans (Phaseolus vulgaris) (Don Elio, Argentina) and lentils (Lens Culinaris) (SyP, Argentina) were kindly provided by Planta de Alimentos para la Integración Social (PAIS – UNLP, Argentina). Legumes were properly stored at room temperature until their use. All the employed chemical reagents were analytical grade.
Aquafaba obtention
A traditional cooking process was carried out to obtain aquafaba. A previous soaking process for an optimum time was implemented: 8 h for beans and 1.5 h for lentils. The optimum soaking time was determined as the time when no further weight increase was registered in the soaked legume. For each legume, three cooking times were selected: the optimum time, a shorter, and a longer time within the acceptable range of texture for cooked products. Based on preliminary assays, cooking times (t1, t2, and t3) were established for beans: 30, 40, and 50 min and for lentils: 10, 15, and 20 min. A fixed ratio distilled water: legume (5:1) was used for the soaking and cooking processes. After cooking, the system was immediately cooled in an ice-water bath, and the AF was separated from the cooked pulses. Subsequently, the solid content in AF was adjusted to 1 g/100 g and 5 g/100 g according to the established experimental design. Finally, the samples were stored with 0.01 g/100 g sodium azide (Anedra, Argentina) at 4 °C until further use. A reference to the abbreviations is included in Table S1.
Experimental design
Two tetra-factorial designs were proposed according to the functional property. The factors were: the type of legume, cooking time, and solids content. For foaming properties, whipping time was included as a factor, and for emulsifying properties, the concentration of the dispersed phase was the additional factor.
Functional properties
Foams
Foams were prepared for each condition by whipping using a kitchen hand mixer (Black and Decker, Argentina) for 10 and 15 min, and the volume of drained liquid over time was recorded to study the kinetics of destabilisation of the foams. From this measurement, the average destabilisation time (t1/2) and the overrun (OR(%): percentage volume of air incorporated) were measured. Each treatment was replicated at least two times.
The kinetics of foam destabilisation were mathematically modelled using the equation proposed by Arzeni et al. (2012). Two additional parameters were incorporated in the equation (eq. 1) representing the proportion of the total liquid volume (VAF) that is initially incorporated into the foam (A), and the proportion of the total aquafaba that is finally drainable from the foam (B).
where V(t) is the AF volume in the foam at time t; n is a constant related to the sigmoid shape of the curves; and C is a constant related to the runoff time of half of the potentially drainable volume through Cn.
Emulsions
Sunflower oil (AGD, Argentina) in AF emulsions (O/W) were prepared for each condition using two dispersed phase concentrations: 30 g/100 g and 50 g/100 g. Emulsions were homogenised at 22 000 rpm for 2 min using a hand homogeniser D-160 (Dragonlab, China). A vertical optical analyser (QuickScan, Beckman Coulter; USA) was used to study the emulsions' stability by measuring the intensity of the backscattered light (BS). From the acquired profiles, mean values of the backscattered in the 5–15 mm zone, corresponding to the bottom of each tube, were obtained. The kinetics were modelled (eq. 2) to obtain the destabilisation rate constant (K) and the BS at t = 0 (BS0) (Raikos et al., 2017).
Proximate composition
The ash, soluble carbohydrates and proteins, and total protein contents (N × 6.25) of AF were determined according to the AOAC methods (AOAC, 1984). For soluble protein and carbohydrates, AF was centrifuged (3000 × g, 10 min) and the supernatants were filtered (0.45 μm). Albumin (Sigma Chemical Co., USA), was used to perform the calibration curve to soluble protein determination by Lowry and glucose (Biopack, Argentina), for the calibration curve to soluble carbohydrates by Antrona. The insoluble carbohydrates were calculated by difference.
Dried AF obtention
AF powders were obtained by spray-drying (B-290, Büchi Labortechnik AG, Switzerland). Pre-concentrated AF (>10 g/100 g) was fed into the main chamber (700 μm diameter spray nozzle; 70 cm height) through a peristaltic pump at 7 mL/min. The drying airflow rate was 473 L/h and the air pressure was 6–8 bars. Inlet and outlet air temperatures were 180 ± 2 °C and 96 ± 8 °C, respectively. The spray-dried powders were collected and stored in hermetically sealed flasks. Two individually prepared replicates were assayed for each condition.
Powder characterisation
Microstructure
A scanning electron microscope (SEM, FEI Quanta 200, USA) was used to examine powder samples. They were mounted on aluminium stubs using double-sided tape and vacuum coated with gold. At least five representative fields were obtained from each replicate.
Colour
The colour was measured at room temperature using a Chroma Meter CR-400 colorimeter (Minolta CR-400, Minolta Corp., USA) on an even layer of powder placed on a Petri dish and CIELAB parameters (L*, a*, and b*) were determined. The aperture size was 8 mm and a D65 illuminant was employed. All measurements were performed in triplicate.
Water activity
Water activity (aw) of each powder was analysed at 25 °C using AquaLab series 3 equipment (Decagon Devices Inc., USA), based on the dew point technique. All measurements were performed in duplicate.
Rehydration capacity of AF powders
The rehydration capacity of the powders was measured by incorporating 0.05 g of the dry material in 950 μL of distilled water at room temperature to obtain an AF of 5 g/100 g. The mixture was vortexed for 2 min (Goula et al., 2004). AF samples with the same solid content were used to compare the powder rehydration. All samples (original and rehydrates AF) were centrifuged, removed from the supernatant, and the remained pellets were freeze-dried to obtain the amount of insoluble solids.
Contact angle
Hydrophobicity was evaluated on an even layer of powder by measuring the contact angle using a goniometer (Model 500, ramé-hart instrument co., USA). A 5 mL drop of demineralised water was placed on the powder surface with an automatic piston syringe and photographed. The mean contact angle for the surface of each sample was calculated from 10 measurements.
Density, porosity, and flow properties
Determinations of densities, porosity, and flow properties were performed following the protocol of Premi & Sharma (2017). Bulk (δm), compacted (δc), and true (δp) densities were measured and porosity, Hausner ratio (HR), and Carr compressibility index (CI) were calculated from them.
Fourier transform infrared spectrometry
FTIR spectra of AF powders were measured on a Thermo Nicolet iS10 ATR-FTIR spectrometer (Thermo Scientific, MA, USA). For each sample, nine spectra in the range 4000–500 cm−1 were recorded by coadapting sixty-four scans with a spectral resolution of 4 cm−1. A stream of dry nitrogen was used to purge the equipment. Additionally, FTIR spectra of lentil and bean flours (grounded legumes and sieved through a 40 mesh) were obtained to compare with the aquafaba results.
Statistical analysis
Significant differences between parameters were determined by analysis of variance (ANOVA) followed by Tukey's test (P < 0.05). The statistical analysis was performed using Infostat (Infostat Group, Universidad Nacional de Córdoba, Argentina).
Results and discussion
Proximate composition
The composition of the obtained AF was analysed and the corresponding results are shown in Table 1. The average total protein content of lentil AF (17.11 g/100 g db) was significantly higher than bean AF (14.68 g/100 g db). However, thermal treatment affected differently both legumes. It seems to be a decreasing trend in total protein content of bean AF and the opposite behaviour was observed for lentils. In addition, the soluble proteins fraction was markedly higher in lentil AF than in beans.
Proximate composition of aquafaba obtained from beans and lentils cooked at different times
| Sample* | Bean | Lentil | ||||
|---|---|---|---|---|---|---|
| t1 | t2 | t3 | t1 | t2 | t3 | |
| Total proteins (g/100 g db) | 15.14AB | 15.28ABC | 13.61A | 16.26BC | 17.30BC | 17.77C |
| Soluble proteins (g/100 g db) | 1.98A.B | 2.44B | 1.60A | 3.56C | 4.22C | 3.87C |
| Soluble carbohydrates (g/100 g db) | 31.65B | 35.45BC | 39.05C | 32.40B | 35.15BC | 24.25A |
| Ash (g/100 g db) | 15.22C | 14.86BC | 14.42BC | 11.53AB | 10.43A | 10.88A |
| Insoluble carbohydrates** (g/100 g db) | 37.99 | 34.41 | 32.92 | 39.81 | 37.12 | 47.1 |
Different superscripts in the same row indicate significant differences (P < 0.05).
Determined by difference.
On the other hand, lentil AF had average soluble carbohydrates of 30.60 g/100 g db, which was significantly lower than in bean AF (35.38 g/100 g db). In this case, also a significant and opposite effect of cooking time was observed for each legume (P < 0.05).
Argel et al. (2020) previously characterised these legumes. They reported that the protein content in lentils was higher than in beans, which is in agreement with the aquafaba composition. Moreover, the ash content in beans was also significantly higher than in lentils, suggesting that minerals were proportionally extracted from both legumes, resulting in the differences observed between the AF (Table 1).
Functional properties
Foam stability showed that, in general, lentil AF produced more stable systems (higher t1/2 values). However, this is fundamentally due to the very high t1/2 values reported for lentil AF with 5 g/100 g solids (Table 2). The overrun showed the same behaviour, registering that lentil AF at 5 g/100 g doubled the volume of air incorporated in the foam compared to beans at the same concentration. These differences in foam stability for lentil AF is directly related to the higher protein content, previously reported in Table 1.
Foaming properties of aquafaba obtained from beans and lentils cooked at different times
| Legume | Cooking time | Solid content (g/100 g) | Whipping time (min) | Overrun (%)* | t1/2 (s)* |
|---|---|---|---|---|---|
| Bean | t1 | 1 | 10 | 234AB | 24.17A |
| 15 | 237AB | 31.88A | |||
| 5 | 10 | 307AB | 118.57A | ||
| 15 | 327AB | 233.57A | |||
| t2 | 1 | 10 | 230A | 25.83A | |
| 15 | 270AB | 48.57A | |||
| 5 | 10 | 310AB | 168.33A | ||
| 15 | 327AB | 376.67A | |||
| t3 | 1 | 10 | 257AB | 27.50A | |
| 15 | 270AB | 60.00A | |||
| 5 | 10 | 349AB | 288.75A | ||
| 15 | 354AB | 908.57A | |||
| Lentil | t1 | 1 | 10 | 310AB | 74.29A |
| 15 | 333AB | 105.71A | |||
| 5 | 10 | 871C | 4087.50B | ||
| 15 | 953CD | 4791.67BC | |||
| t2 | 1 | 10 | 347AB | 90.29A | |
| 15 | 360AB | 178.33A | |||
| 5 | 10 | 945CD | 3934.29B | ||
| 15 | 1087D | 4603.33BC | |||
| t3 | 1 | 10 | 370AB | 136.00A | |
| 15 | 377B | 160.95A | |||
| 5 | 10 | 955CD | 5291.67C | ||
| 15 | 954CD | 5750.00C |
Different superscripts in the same column indicate significant differences (P < 0.05).
Lentil AF reached remarkably high OR(%) with values between 900 and 1000%. Moreover, it has been reported that foams elaborated under similar conditions, with egg and whey protein isolates from 2 to 20 g/100 g solids, had overrun values up to 800% (Pernell et al., 2002). Additionally, other vegetable foaming agents showed overrun values of 350% to 660% as aquafaba from Pallar beans (Phaseolus Lunatus) with 5.3 g/100 g solids (Nguyen et al., 2020).
Regarding the whipping time, no significant changes (P > 0.05) in either stability or OR(%) were registered, showing that the protein to support new interfacial area formation was depleted and no more air could be included in the foam. Therefore, 10 min of whipping time for lentil and bean AF was enough to reduce the bubble size to the minimum possible. Pernell et al. (2002) reported that no further changes in OR(%) were observed after 8 min of whipping time. Similar results were informed by Mustafa et al. (2018), who reported that increasing the whipping time from 5 to 10 min did not generate significant effects on OR(%) for chickpea AF or egg foams.
The drainage versus time curves were successfully fitted using eq. 1 (Fig. 1). Regarding coefficient A, which refers to the total liquid volume initially incorporated into the foam, only the bean AF at t1 with 1 g/100 g presented an A value lower than 1 (A = 0.93). When the proportion of the total aquafaba finally drainable from the foam (B) was analysed, a significant interaction between legume and concentration was observed (P < 0.05). Whereas solid content in bean AF did not alter the drainable liquid, samples with 5 g/100 g of lentil AF showed a 20% of non-drainable liquid. C, related to the runoff time of half of the potentially drainable volume, followed the same trend as t1/2, that is, the significant differences in foam stability is caused by the lentil AF with 5 g/100 g. Figure 1a,c showed that diluted AF led to foams without a lag phase at the beginning of the drainage curves, which is related to n values lower than 1. Conversely, at higher solid content (Fig. 1b,d), mainly in lentil AF and bean AF t3, a sigmoidal shape of the curves was observed (n > 1), leading to a noticeable increase in foam stability.
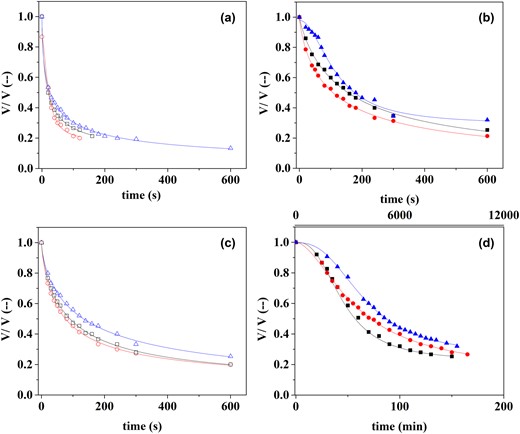
Proportion of the aquafaba volume into the foam as a function of draining time for different legumes, solid content and cooking time. (a) Bean 1 g/100 g (b) Bean 5 g/100 g (c) Lentil 1 g/100 g (d) Lentil 5 g/100 g.  t1;
t1;  t2;
t2;  t3. Continuous lines represent the fitting of the eq. 1 to the experimental results.
The process of emulsion destabilisation was governed by creaming, as it was evidenced by a clarification at the bottom of the tube. The rate of destabilisation, measured in terms of K during the first 20 min of analysis (eq. 2), was mainly controlled by the concentration of oil and solids in the continuous phase (Fig. 2).
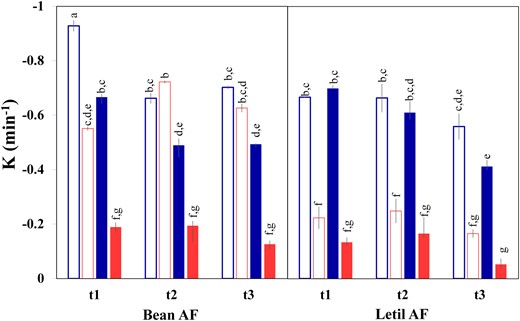
Destabilisation rate constant (K) of O/W emulsions obtained with aquafaba of different pulses, cooking times, total solid content (sc), and oil concentration (oc).  sc: 1 g/100 g, oc:30 g oil/100 g;
  sc: 1 g/100 g, oc:50 g/100 g;
  sc: 5 g/100 g, oc:30 g oil/100 g;
  sc: 5 g/100 g, oc:50 g oil/100 g.
Lentil AF emulsions were significantly more stable than beans, which was more evident at low concentrations. However, these differences were not as marked as in the case of foams, due to beans presenting a higher content of soluble sugars than lentils (Table 1), which caused an increase in the viscosity of the continuous phase at the same solids concentration. In addition, the stability of the emulsions increased with cooking time, higher oil concentration, and higher solid content in the AF. K values for a content of 50 g/100 g of dispersed phase (K50), halved the speed of droplet migration to the top of the tube (K30 = −0.63 min−1 vs. K50 = −0.28 min−1). Solids concentration showed the same trend as observed in foams, then, emulsions with 5 g/100 g were significantly more stable than those with 1 g/100 g (K5 = −0.35 min−1 vs. K1 = −0.56 min−1). Raikos et al. (2020) attributed the emulsifying capacity of aquafaba to the content of proteins and carbohydrates, considering that these components contribute to the formation of an interfacial film of significant thickness, that impacts on the stabilisation of the emulsions.
Powder characterisation
Micrographs of spray-dried AF can be observed in Fig. 3. Cooking time did not show marked differences in the particles morphology. However, powders were different depending on the legume type. Bean AF exhibited mainly spherical particles with smooth surfaces and a size range from 6 to 15 μm. On the other hand, lentil AF particles were more damaged, with irregular fragments, and a great proportion of hollowed and collapsed structures (Fig. 3a,c). The few undamaged particles presented a larger average size than bean AF, ranging from 13 μm to 25 μm. Another difference observed was that bean powders showed a larger proportion of agglomerated particles.
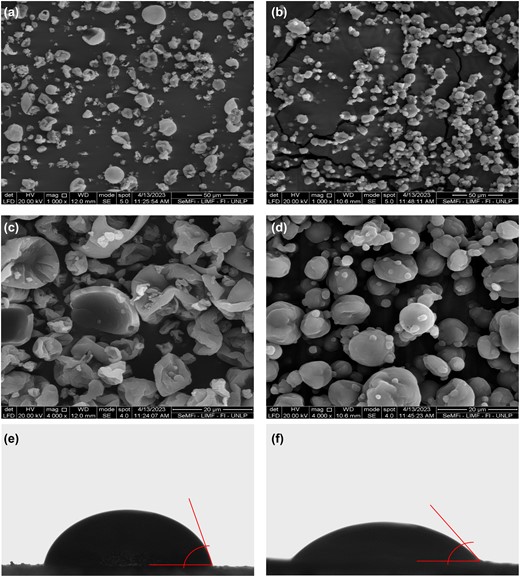
Micrographs of spray-dried aquafaba of lentils (a, c) and beans (b, d) at different magnifications and images for contact angle measurement of (e) aquafaba powder of lentils and (f) aquafaba powder of beans.
It was found that AF powders of beans had higher luminosity that decreased with cooking time (Table 3). Additionally, the parameter a* was significantly higher in the case of lentils, attributable to the reddish colouration of this legume, and significantly decreased with cooking time. Colour parameters of AF bean powders laid within the range of spray-dried egg white proteins previously reported (Ma et al., 2013). Thus, the replacement of egg white with bean AF in the formulation of a food product would not affect the overall appearance.
Colour, rehydration capacity and contact angle of aquafaba powder obtained from beans and lentils cooked at different times
| Legume | Cooking time | Colour* | Insoluble solid (g/100 g AF)*,** | Contact angle (°)* | |||
|---|---|---|---|---|---|---|---|
| L* | a* | b* | AF | Rehydrate AF | |||
| Bean | t1 | 89.01E | 0.22A | 14.28D | 0.43Aa | 0.37Aa | 60.15A |
| t2 | 87.42D | 0.96C | 15.26E | 0.46ABa | 0.36Aa | 59.97A | |
| t3 | 87.43D | 0.75B | 15.71F | 0.64Ba | 0.37Ab | ND | |
| Lentil | t1 | 66.52A | 5.36F | 13.35C | 1.22Ca | 0.70Bb | 82.59B |
| t2 | 73.51B | 2.73E | 12.38A | 1.23Ca | 0.87Bb | 79.44B | |
| t3 | 74.25C | 2.40D | 12.69B | 1.63Da | 1.22Cb | 58.86A | |
Different capital letters in the same column indicate significant differences (P < 0.05).
Different lowercase letters in the same row indicates significant differences (P < 0.05)
Water activity ranged between 0.33 and 0.45, assuring microbiological stability of the product. Significant differences between both legumes were found, with a higher aw for lentils (awLentil = 0.43) than for beans (awBean = 0.37).
The rehydration capacity of AF powders (Table 3) showed that for both, the original and rehydrated AF, lentils had more insoluble solids than beans, which is in agreement with the proximal analysis (Table 1). Data showed that, generally, increasing cooking time resulted in a higher amount of insoluble solids. It was remarkable that in none of the cases, the amount of insoluble solids in the rehydrated powder was higher than in the original AF. Moreover, the residual amount of solids in lentils AF was always lower after rehydration, attributable to the composition and microstructure above mentioned.
Table 3 shows that the contact angle for beans (<60.09°) was significantly smaller than for lentils (73.84°) (Fig. 3e,f). Contact angles smaller than 90° are associated with materials that have high wettability (Yuan & Lee, 2013), indicating that, although beans AF powder is more hydrophilic than lentils, both powders have high wettability. Additionally, the powder wettability increased as time increased (Table 3). This was more evident for bean powder at t3, since it was not possible to measure the contact angle (highly hydrophilic powder).
The higher content of soluble carbohydrates in beans AF could be linked to their lower aw and higher wettability and agglomeration, observed in the micrographs.
Either cooking time or legume type did not significantly affect flowability parameters (P > 0.05). All powders showed an average bulk density of 0.50 (±0.01) g/mL and a compacted density of 0.66 (±0.02) g/mL. The compacted density is always higher than the bulk density because the spaces between particles are minimised, forcing the powder to occupy smaller volumes (Goula et al., 2004). On the other hand, particle density (also called true density), does not consider the space between particles, and the average value found for the AF powders was 1.3 (±0.08) g/mL. Porosity is an interesting parameter due to its influence on the reconstitution process in water. The porosity of the analysed samples presented an average value of 0.43 (±0.03). Otherwise, the flowability of the powders was evaluated by calculating the HR and CI, obtained from the bulk and compacted densities. On average, the powders presented an HR of 1.30 (±0.02) and a CI of 22% (±1%). According to Shah et al. (2008), the powders had an acceptable flowability (1.26 < HR < 1.34 and 21 < CI < 25). These values were similar to those reported by Abreha et al. (2021) for oven-dried egg and better than the spray-dried egg (CI ~ 40%).
Analysing the FTIR spectra as a whole, marked differences were observed between legumes (Fig. 4), but no noticeable differences were detected with cooking time. In both legumes, peaks located in the range 2500–3600 cm−1 were present, which could be attributed to the water molecules because that zone refers to the absorption of stretching of the O-H bond (Gnanasambandam & Proctor, 2000). In addition, the range of frequency 3100–3500 cm−1 also has associated with the N–H stretching of Amide A or B (Carbonaro & Nucara, 2010; Nagai et al., 2022). According to Carbonaro & Nucara (2010), the infrared spectrum of proteins presents peaks that are strongly linked to the amide groups, and different ranges can be assigned to the different amide types: amide I from 1600 to 1690 cm−1, amide II from 1480 to 1570 cm−1 and amide III from 1229 to 1301 cm−1. These three peaks were observed in both raw legumes. However, in both AF powders, these peaks markedly decreased, related to protein denaturation caused by the drying process. This effect was less evident in lentils AF because of their higher amount of proteins.
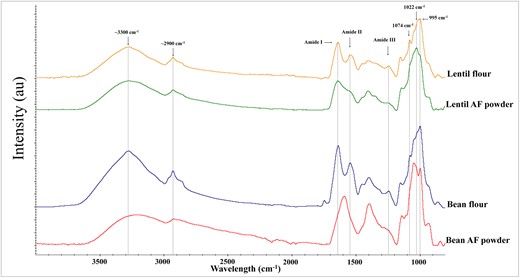
FTIR spectra of raw lentil ( ) and bean (
 ) flours as well as dried powders of lentils (
 ) and beans (
 ) aquafaba.
The range from 900 to 1200 cm−1 is assigned to carbohydrates, and the spectra of both AF and raw legumes presented multiple peaks in that zone (Fig. 4). However, changes in the proportions of these peaks can be observed between the raw legumes and also with their corresponding AF. This would indicate that there are differences in starch derivatives resulting from heat treatment and biological origin between the two legumes. Nagai et al. (2022) linked the peak at 1074 cm−1 with the crystalline region of starch. This peak was present in raw legumes and disappeared in the corresponding AF. Xu et al. (2019) associated 1047 cm−1 and 995 cm−1 peaks with the molecular order and crystalline region, and the peak at 1022 cm−1 with the amorphous and disordered phase of starch granules. In raw legumes, peaks at 1047 cm−1 and 995 cm−1 were present, whereas in AF, these peaks had a noticeable decrease while the peaks at 1022 cm−1 were increased. This change in the peaks' proportion was more marked in lentils and could be attributed to their less content of soluble carbohydrates compared with beans (Table 1).
Conclusions
After analysing the results, it is evident that the dominant factor influencing the functional properties of the aquafaba was the legume type, attributed to their chemical composition, and the concentration of solids in the cooking water.
The variations in the composition of the aquafaba allowed for the prediction of the final characteristics of the powders. The presence of higher levels of soluble carbohydrates in bean aquafaba increased their emulsifying capacity and resulted in powders with particles with a more uniform structure and smoother surface. However, these powders also exhibited greater agglomeration and hygroscopicity.
Lentil aquafaba had higher protein content, which can account for their superior foaming capacity and less marked loss of protein secondary structure through heat treatment.
By employing the spray-drying process, it was possible to obtain a compatible ingredient for the development of “animal cruelty-free”, “vegan” and “gluten-free” food products. This process offers an easily scalable method with immediate industrial applicability.
These findings pave the way for further studies aimed at the research of functional properties of other legumes, exploring other cooking processes or potential enhancements through physicochemical post-treatments.
Acknowledgments
The authors acknowledge the Planta de Alimentos para la Integración Social (PAIS – UNLP, Argentina) for providing the raw material for the studies performed in this paper. Dr. Nelson Romano is also acknowledged for his valuable and helpful suggestions about FTIR data processing and discussion.
Author contributions
María Eugenia Golzi: Data curation (equal); formal analysis (equal); investigation (equal); methodology (equal); validation (equal); writing – original draft (equal); writing – review and editing (equal). Lucas Marchetti: Conceptualization (equal); formal analysis (equal); funding acquisition (equal); methodology (equal); supervision (equal); writing – review and editing (equal). Gabriel Lorenzo: Conceptualization (equal); formal analysis (equal); funding acquisition (equal); methodology (equal); project administration (equal); supervision (equal); writing – review and editing (equal).
Funding
This research was supported by Consejo Nacional de Investigaciones Científicas y Tecnológicas (CONICET, Argentina) PIP 0161, Agencia Nacional de Promoción Científica y Tecnológica (ANPCYT) PICT 2021-0685, and Universidad Nacional de La Plata X-873.
Data availability statement
The data that support the findings of this study are available on request from the corresponding author. The data are not publicly available due to privacy or ethical restrictions.
