


Abstract
Methods based in the utilisation of near infrared (NIR) spectroscopy have been evaluated and reported by different authors for the analysis of a wide range of properties associated with meat quality in either live animals or during carcass evaluation, as infrared (IR) light has the capability to propagate through the several layers of the tissue. Recent reports by different authors also proved that methods based in the application of short wavelengths (e.g. 700–1100 nm) in the NIR region of the electromagnetic spectrum can measure properties related to meat quality non-destructively and non-invasively in live animals. In addition, this methodology was reported to be able to segregate tissues (e.g. lean and fat) assessed through the skin. Presently, there is a lack of knowledge on the capability of rapid and non-invasive methods based in NIR spectroscopy to assess and measure traits associated with meat quality in live animals (e.g. beef and pork). Therefore, this review reports the recent applications of NIR spectroscopy to predict traits (e.g. protein, fat, fatty acids and shear force) associated with meat quality in both live animals and carcass samples.
Introduction
Studies related to the evaluation of the main interrelationships between food, health and nutrition in the field of animal and food sciences often requires the analysis or assessment of samples post-mortem as well as the measurement of meat composition (e.g. protein, fat and intramuscular fat) to evaluate its nutritional value (Prevolnik et al., 2004; Berzaghi & Riovanto, 2009; Prieto et al., 2009, 2014, 2018). However, conventional analytical techniques used in research and by the industry are usually destructive (e.g. carcass assessment and proximate analysis), time-consuming (e.g. involve several steps, including sample preparation and processing), expensive and requires the utilisation of harmful reagents before the results are available to the operator or researcher (Pérez-Marín et al., 2009; Zamora-Rojas et al., 2013a,b, 2014; Cozzolino, 2014, 2015; Cozzolino & Roberts, 2016).
Near infrared (NIR) spectroscopy is considered by several authors as the most suitable method or technology to assess the chemical composition of several tissues and traits associated with meat quality in live animals, as wavelengths in the infrared (IR) region of the electromagnetic spectrum can penetrate the skin, fat and muscle of live animals (Bashkatov et al., 2005a,b, 2011; Azizian et al., 2008; Jacques, 2013; Zamora-Rojas et al., 2013a,b, 2014). During the last 60 years, this technique has been applied in agriculture and food industry for the routine assessment and quantification of the chemical composition of several agricultural products and raw materials (e.g. grain composition, fruit quality and forage analysis) (Osborne et al., 1993; Cozzolino, 2014, 2015; Cozzolino & Roberts, 2016; Fletcher et al., 2018). In recent years, NIR spectroscopy has evolved as an analytical method where the rapid uptake by the food industry can be explained by the advantages that its inherent characteristics offered (e.g. cost and easy to use) as well as to the availability of new and easy to operate instrumentation (e.g. handheld, portable spectrophotometers) (Osborne et al., 1993; Cozzolino, 2014, 2015; Cozzolino & Roberts, 2016; Fletcher et al., 2018).
Recent studies stated that the capability of NIR spectroscopy to measure variations in the human brain (e.g. oxygen uptake) and tissues (e.g. adipose tissue and muscle) might be due to the relative transparency of these tissues to the NIR radiation at different wavelengths (Conway et al., 1984; Du et al., 2001; Arimoto et al., 2005; Ding et al., 2005; Ma et al., 2005; Brown et al., 2011, 2012; Martelli, 2012; Jacques, 2013). For example, a study by Jacques (2013) has suggested that the capability of NIR spectroscopy to monitor oxygen uptake in the brain might be connected to the absorption of oxygen-dependant chromophores in tissues (e.g. haemoglobin and myoglobin) measured at several different wavelengths in the NIR region. In live applications of NIR reflectance spectroscopy, it has been also reported that tissues having different levels of pigments can decrease the intensity of the IR signal (Hutchinson et al., 1975; Pringle et al., 1999; Terletzky et al., 2012). Consequently, the observed interferences in the IR intensities might be also explained by the presence of hair and pigments in the epidermis of these animals (Hutchinson et al., 1975; Pringle et al., 1999; Terletzky et al., 2012).
Despite these interference issues, several researchers have reported and evaluated the capability of NIR reflectance spectroscopy to assess any traits (e.g. fat, fatty acids and colour) associated with meat quality in live animals, to predict different properties associated with meat carcass quality at the abattoir (Prieto et al., 2009; Wang et al., 2018). Table 1 summarises some of the main characteristics of both NIR and hyperspectral imaging spectroscopy used in the analysis of meat.
Characteristics of the infrared systems used for the analysis of meat
| Wavelength range | Sample collection | Type of samples | Instrument portability | |
|---|---|---|---|---|
| HYPER | VIS and NIR range | Spot and spatial resolution | Solid samples | Broad overtones |
| NIR | 750–2500 nm | Spot, small and large samples. Minimal sample preparation. | Liquids (transmission) and solids (diffuse reflectance) | Broad overtones |
HYPER, hyperspectral; NIR, near infrared; VIS, visible.
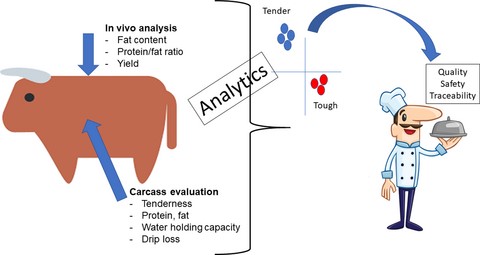
This review reports recent applications of NIR spectroscopy (e.g. live and carcass evaluation) to measure different properties or traits associated with meat quality (e.g. total lipids, fatty acid profiles, colour and drip loss). For the interest of readers, only reports/papers published in the last 10 years related to the applications and feasibility studies of this technology for the assessment of in vivo or carcass samples are discussed in this short review.
In vivo and carcass analysis
Several studies have evaluated the use of short wavelengths (SW) in the NIR range (700–1100 nm) due to their ability to penetrate the different skin layers and other tissues (e.g. adipose), allowing for the analysis of chemical composition or physiological responses (e.g. oxygen uptake, fat and protein content) in both animals and human tissues (Prevolnik et al., 2004; Prieto et al., 2009; Zamora-Rojas et al., 2013a,b, 2014). Recently, studies that have originated from Spain have proved the ability of NIR spectroscopy to assess different muscles and properties (e.g. subcutaneous fat, fat and colour) related to pork meat quality of live animals as well as to monitor post-mortem (e.g. carcass evaluation) and product quality properties (e.g. grading) (Prevolnik et al., 2004; Pérez-Marín et al., 2009; Prieto et al., 2009; Zamora-Rojas et al., 2013a,b, 2014).
In many of the applications where NIR spectroscopy has been used to assess live animals, it has been emphasised that light must penetrate all the layers of the tissue analysed (e.g. skin, soft and adipose tissue) during the measurement. However, the surrounded (e.g. subcutaneous adipose tissue) tissues can affect the trajectory and the amount of reflected light from the sample analysed (Ding et al., 2005; Renaudeau et al., 2006; Zamora-Rojas et al., 2013a,b). Therefore, knowledge about the main interrelationships between layers (e.g. skin, soft tissue, muscle, adipose tissue and connective tissue) and the way that light propagates through the several layers of the tissue under analysis is of importance for the successfully development of NIR application for live animals (Renaudeau et al., 2006; Zamora-Rojas et al., 2013a,b).
Although some studies were reported in the scientific literature on the use of NIR spectroscopy to assess meat properties through the skin of domestic animals (e.g. pigs), there is a distinct lack of information on the use of this technique to assess meat composition (e.g. protein and fat content) in other species (e.g. beef, sheep) or on the evaluation of other meat quality properties through the skin of live animals (Pérez-Marín et al., 2009; Zamora-Rojas et al., 2013a,b).
Recently, Pérez-Marín et al. (2009) described and discussed on developments and optimisation of a NIR system for the fast characterisation of pig fat composition measured both in vivo and in the carcass samples at the abattoir. The spectra of the samples sourced from different places (e.g. live animal, homogenised muscle and carcass) and positions (e.g. skin plus subcutaneous fat and skin-free of subcutaneous fat) were collected using a portable NIR instrument. The authors attempted to predict fatty acids where the standard error of cross-validation (SECV) of 1.24% and 0.82% was reported for palmitic acids in live animals and carcass samples, respectively. The SECV values obtained for stearic acid ranged between 0.67% and 0.94%, between 1.42% and 1.48% for oleic acid and between 0.36% and 0.55% for linoleic, measured in either in live animals or in the carcass, respectively. These researchers also stated that the models accounted for more than 60% of the observed variation in the fat content measured in the live animals, and between 31% and 87% of the variation in the carcass samples analysed using NIR spectroscopy. It was concluded that the use of NIR spectroscopy will allow for the implementation of real-time traceability and control systems in live animals before entering the food value chain.
Zamora-Rojas et al. (2012) explored the use of a handheld micro-electro-mechanical system (MEMS) instrument (1600–2400 nm) to authenticate carcasses from Iberian pig into different commercial categories sourced from three typical feeding regimes (e.g. Acorn, Recebo and Feed). The best classification results were 93.9% for Acorn, 96.4% for Feed and 60.6% for Recebo, respectively. The results from this experiment indicated that the MEMS system might be used as tool for in-line evaluation or carcass samples in the abattoir as well as to discriminate samples based on the diet or feed source (e.g. Acorn, Recebo and Feed). The same authors have reported the optical properties of pigskin and its potential effect on the performance of NIR calibrations using double integrating sphere (DIS) in combination with an inverse adding doubling (IAD) light propagation model (Zamora-Rojas et al., 2013a,b). These authors emphasised that the absorption coefficients in the adipose tissues were associated with the absorption of water and lipids. It has been highlighted by these authors that knowing the optical properties of the sample (e.g. absorption and scattering) is of importance to develop robust NIR applications for meat quality control (e.g. fat content), process analytics at either the abattoir or on the farm. These authors also evaluated and presented with information about absorbances and scattering values of pig adipose tissues in the NIR wavelength region (1150 and 2250 nm) suggesting that these data can be used to design new NIR sensors for the non-invasive analysis of fat.
In a recent study, Zamora-Rojas et al. (2014) evaluated and simulated the behaviour of NIR light during the analysis of Iberian pigskin samples in the infrared region (1150–1850 nm) based in Monte Carlo modelling. The authors also evaluated different distances (from the source to the sample) as well as the optimal configuration for the instrument to maximise the NIR data collected from the subcutaneous adipose tissue. Overall, the authors concluded that these data will provide with the relevant information to understand how light interacts with tissues in vivo.
Pérez-Marín et al. (2009) have also evaluated and reported that on the skin NIR assessment of live animals either at the farm or at the abattoir, showed a negative effect on the performances of the calibration models developed, measured as the standard error of prediction (SEP). The SEP values reported by these authors were comparatively high when traits related to meat quality where measured in live animals compared with those analysed using meat cuts or homogenised samples. These authors indicated that the reason for the high SEP values obtained in the NIR models developed using live animals was associated with the amount of NIR light reaching the tissue (e.g. reflectance). It has been also suggested by these authors that when applying NIR light into the sample, it is extremely dispersed (e.g. scattered) by the skin layers (e.g. structure of the tissue) including the epidermis (e.g. blood-free layer), dermis (e.g. vascularised layers, connective tissue and collagenous fibres) and hypodermis (e.g. subcutaneous adipose tissue and connective tissue) (Ding et al., 2005; Renaudeau et al., 2006; Pérez-Marín et al., 2009; Zamora-Rojas et al., 2013a,b, 2014).
Recently, researchers in Australia have confirmed that wavelengths (700–2500 nm) in the NIR region might be used to screen the proportion of muscle and fat through the skin in a model system (Roberts et al., 2017). The authors concluded that NIR spectroscopy might be used by beef producers as a tool to screen management practices (e.g. health and nutrition) in the farm as well as to infer product characteristics to target consistently uniform products to assuring consumer with a product of high quality. Although these results look promising, they were based in a model system and validation must be carried out using live animals.
The amount of fat in pork meat is one of the main traits responsible for its quality, as the fat content can influence the quality of the meat during processing (e.g. oxidation) (Rich et al., 2016). Researchers from Switzerland developed a method based on NIR spectroscopy to predict fat, polyunsaturated fatty acids (PUFA) and iodine value in the backfat of pigs from a breeding program as these parameters are used to monitor fat oxidative stability and consistency. These parameters are also being used by the pork industry in Switzerland for payment of pig carcasses (Rich et al., 2016). The authors of this study concluded that NIR spectroscopy might be used as a high throughput technique in pork breeding programmes.
Table 2 summarises the wavelengths and NIR modes reported in the literature on the applications of NIR spectroscopy in live animals.
In vivo applications of near infrared spectroscopy reported by several authors for the measurement of traits related to meat quality
| Application | Wavelength range (nm) | Mode | References |
|---|---|---|---|
| Fatty acids profile in live Iberian pig | 350–2500 | R | Pérez-Marín et al. (2009) |
| Iberian pig carcass | 1600–2400 | MEMS | Zamora-Rojas et al. (2012) |
| In situ analysis Iberian pig skin tissue | 1150–1850 | Fibre optic | Zamora-Rojas et al. (2013a,b) |
| Properties pig skin epidermis and dermis | 1150–2250 | T | Zamora-Rojas et al. (2013a,b) |
| Classification of tissues (e.g. lean vs. fat) through the skin | 700–2500 | R | Roberts et al. (2017) |
| Pork belly fat | 760–1040 | T | Wold et al. (2016) |
| Subcutaneous fat in pigs | 350–2500 | R | Prieto et al. (2018) |
R, reflectance; T, transmission.
On-line/in-line and at-line
Sorensen et al. (2012) and Sorensen & Engelsen (2017) reported the use of NIR spectroscopy for the online prediction of oxidation (e.g. iodine number) of adipose tissue from pork based in cross-validation. The NIR data (11 329 spectra) were unfolded from the true five-way array (e.g. carcass, horizontal position, vertical position, depth and spectral data points) where multivariate curve resolution (MCR) was used to analyse the data (Sorensen & Engelsen, 2017). The authors concluded that after MCR, they were able to generate heat maps highlighting the distribution of the constituent concentrations in the adipose tissue analysed (Sorensen & Engelsen, 2017).
A NIR system (760–1040 nm) was reported for the analysis of both pork belly and meat samples falling at high speed during processing (Wold et al., 2011, 2016). The authors have developed calibration models for fat content using partial least squares (PLS) regression (R2 = 0.98). The results obtained from the fat prediction (full cross-validation) were used to develop a fat distribution map (Wold et al., 2011, 2016). The authors concluded that NIT (NIR transmission) spectroscopy might be used to predict fat content in heterogenous samples such as meat.
The capability of NIR spectroscopy (350–2500 nm) to measure fatty acids content and iodine value in the subcutaneous fat of pigs was reported by Pietro and collaborators (Prieto et al., 2018). These authors showed that NIR spectroscopy was able to successfully predict total PUFA and n-3 FA proportions, the ratio between PUFA and saturated fatty acids, as well as iodine number. The R2 reported by these authors ranged between 0.90 and 0.95 and the root-mean-square error of prediction (RMSEP) ranged between 0.019% and 1.03%. The same authors reported that NIR spectroscopy was able to screen for saturated and monosaturated fatty acids, n-6 fatty acids and the ration between n-6/n-3 fatty acids. The authors reported R2 ranged between 0.80 and 0.89 and RMSEP values between 0.37% and 1.11%. It was concluded by these authors that the NIR method can be used for a rapid and non-destructive screening of fat in the abattoir.
Piao et al. (2018) reported the use of a handheld instrument combined with a fibre-optic for on-site assessment of beef adipose tissue and the overall quality of the fat (e.g. fatty acid profile) in Wagyu carcasses. The R2 for the prediction of monounsaturated, oleic and saturated fatty acids profiles measured using gas chromatography (GC) was 0.69, 0.64 and 0.67, respectively. Overall, the SEP values reported for the calibrations were approximately 2%. The authors concluded that the results obtained using the handheld instrument were accurate for the evaluation of fat in Wagyu carcasses.
The prediction of post-mortem pH (after 2 days) in beef carcass was attempted by using VIS-NIR spectroscopy (Reis & Rosenvold, 2014). The authors reported that the models based in PLS regression had limited accuracy with mean square errors between 0.20 and 0.36. Consequently, the obtained NIR spectra demonstrated a segregation of the beef carcasses and possessed a correct classification rate of 90% in most of the cases. Overall, these researchers suggested that NIR spectroscopy might be utilised to classify beef carcasses in-line.
A fibre-optic attached to a NIR instrument was evaluated to predict several composition and quality parameters in beef in the abattoir (e.g. pH, L, a, b, cooking loss and Warner-Bratzler shear force) (De Marchi, 2013). Results from this study indicated that NIR spectroscopy might be used to predict pH (SECV 0.04) as well as parameters associated with sample colour (e.g. L, a and b) (SECV of 1.94, 1.54 and 1.25 for L, a and b, respectively), where intermediate calibration models were reported for cooking loss. No robust calibrations were obtained for the measurement of Warner-Bratzler shear force (SECV 6.98 N) and cooking loss (SECV 1.48%). Overall, this study suggested that NIR spectroscopy might be a useful technique to monitor chemical and texture parameters in beef in the abattoir.
Muscle samples sourced from four meat processing plants were utilised to develop prediction models based on NIR spectroscopy (Kapper et al., 2012). The authors suggested that calibration models having R2 values higher than 0.70 can be only suitable for screening purposes but not for the accurate prediction of meat quality parameters. Consequently, after several quality parameters were tested (e.g. pH and colour) in four different locations, the authors concluded that only one per cent of drip loss can be accurately predicted using this methodology (RMSEP ranged between 0.7% and 1.1%).
Although reports indicated the ability of NIR spectroscopy to be used for the in-line and on-line analyses/monitoring of meat, this has not been fully demonstrated or implemented.
Hyperspectral and imaging analysis in the NIR range
Several authors have evaluated and reported applications of hyperspectral imaging as a non-destructive method for assessing beef quality (Cluff et al., 2008; Naganathan et al., 2008a,b; Peng et al., 2011; Elmasry et al., 2012; Xiong et al., 2017; Wang et al., 2018). In recent years, several authors have reported the ability of hyperspectral imaging to measure meat quality parameters such as tenderness, water holding capacity, intramuscular fat and proximate composition is just a few example (Cluff et al., 2008; Naganathan et al., 2008a; Peng et al., 2011). For example, Naganathan et al. (2008a) have evaluated the use of hyperspectral imaging (400–1000 nm) to predict tenderness in 14-day post-mortem samples, in both cooked and fresh meat samples. Similar studies were reported by other authors using hyperspectral imaging and other vibrational spectroscopy techniques (Elmasry et al., 2012; Xiong et al., 2017; Wang et al., 2018).
Hyperspectral imaging has been used to classify surface tissue as well as to estimate the thickness of the adipose tissues in lamb short loins (Rahman et al., 2018). The data were analysed by means of support vector machines. These authors reported that the methodology evaluated in this study was capable to classify fat and non-fat samples with 96% accuracy. It was concluded by the authors that hyperspectral can be used to predict fat coverage, total fat, as proxies to estimate lean meat yield in the carcass.
Final considerations
Despite the recent developments in NIR spectroscopy (e.g. handheld instrumentation, fibre optics and hyperspectral), applications of this technology for meat quality in in vivo or carcass analysis are scarce. For the development and implementation of these applications, numerous issues must be considered if quantitative models are going to be constructed. These include information about the number and origin of samples, the number of samples used in calibration and validation, the appropriate pre-processing method, knowledge about the error in the reference method and the expected error in the model developed, the spectra collection method (e.g. handheld, fibre-optic, hyperspectral imaging). In recent years, the growing uptake of rapid analytical methods by the food industry was boosted by the availability of low cost and easy to use instruments.
However, there are still important questions to ask when using NIR spectroscopy, for example, knowing the main objective of the application (e.g. accurately prediction of composition, monitor process and classify carcasses according to diet) and the expected absolute error in the model (SEP). In addition, issues related to meat safety, such microbial contamination and spoilage, meat freshness (e.g. total volatile nitrogen) are still not well defined or addressed using NIR or HSI in the meat industry where the detection limits, reference and instrumentation are an obvious bottleneck (Wang et al., 2018).
Different to the routine use of NIR spectroscopy in the lab, the development of in vivo and carcass applications will require a completely different approach not only about the development of models (e.g. calibration) but also in the way that the information generated is communicated and used. Therefore, this method might provide information not only about the specific sample, but also about the entire process from which the sample has originated, an important benefit that is usually ignored or overlooked.
Finally, among other limitations and one that will be critical for the further development of NIR and other spectroscopic methods is the absence of academic support in areas related to the use of instrumental techniques (e.g. spectroscopy, handheld instrumentation, fibre optics and hyperspectral) as well as with the analysis and interpretation of the data (e.g. chemometrics and modelling) used during the development of the specific application/s. Although there are few examples where industry embraces with academic organisations to share information and expertise promoting a multidisciplinary space to better understand these new technologies. Regrettably, these are still several roadblocks for the widespread of these technologies in R&D and their translation into the food industry.
Acknowledgments
The authors acknowledged the support of RMIT University.
Conflict of interest
The authors declared no conflict of interest.
Ethics approval
Ethics approval was not required for this research.
Data availability statement
Data sharing is not applicable to this article as no new data were created or analysed in this study.
