


Abstract
Malignant central airway obstruction (MCAO) is a condition characterized by severe dyspnoea and high mortality. Tracheo-bronchial stents have emerged as an effective treatment to restore airway patency. Our study aimed to evaluate the efficacy of 3D reconstruction of the upper airways to plan tracheo-bronchial stent insertion for MCAO.
This was a retrospective, single-centre observational study. We analysed data of patients undergoing tracheo-bronchial stent insertion for MCAO from January 2012 to January /2024. Patients undergoing tracheo-bronchial stent insertion for MCAO with 3D reconstruction (3D Reconstruction Group) were compared with patients treated prior to the use of 3D reconstruction (Standard Group).
A total of 136 patients were included in our study: 40 patients (29%) in the 3D Reconstruction Group and 96 patients (71%) in the Standard Group. Restore of airway patency was obtained in 96% of patients, without differences between groups (P = 0.48). Median operative time was 40 min in 3D Reconstruction Group vs 48 min in Standard Group, with a percentage reduction of 17% in the 3D Group (P = 0.03). Stent migration was less frequent in 3D Reconstruction Group than in Standard Group, being 5% vs 17% (P = 0.04). There were no significant differences in 30- and 90-day mortality.
Three-dimensional reconstruction of the upper airways was associated with reduced operative time and stent migration rate in patients with MCAO. Reconstructing patients' anatomical features optimizes the procedure without any added cost or delay of the treatment.

INTRODUCTION
Malignant central airway obstruction (MCAO) is a critical condition consisting in the limitation of airflow in the trachea, carina, or main bronchi caused by tumoural growth.
Although the most common aetiology of MCAO is lung cancer [1], any intrathoracic malignancy can cause airway obstruction and even extra thoracic tumours can metastasize to the airways, such as breast cancer, renal cancer or melanoma [2]. The mechanism of airway obstruction can be either intraluminal tumoural growth or extrinsic tumoural compression. Dyspnoea is the most common symptom of MCAO, with various degrees of severity. Severe dyspnoea can lead to impairment of daily activities, decrease of performance and increased mortality [3]. Restoring the airway patency is the primary objective to relief the patient’s symptoms and improve his or her functional status, allowing him or her to undergo chemo/radiotherapy [4]. The treatment of MCAO is rarely surgical because most patients have unresectable or metastatic disease, while chemo/radiotherapy may have beneficial effects on symptoms but after a rather long period of therapy [5]. Interventional rigid bronchoscopy offers the possibility to restore airway patency through mechanical debulking, dilatation and stenting while securing the airway throughout the procedure.
The appropriate tracheo-bronchial stent choice is based on multiple factors like level and degree of stenosis and anatomic characteristics of the airway. The most common complications of tracheal stent placement are stent displacement, haemoptysis, infection and restenosis [6]. Selecting the proper material, size and shape of stent is crucial to minimize complications.
Given the importance of concordance between the airway morphology and the stent, 3D reconstruction has been implemented in the planning of tracheo-bronchial stents positioning, through virtual and 3D printed models [7]. These techniques are increasingly adopted in clinical practice to plan treatments, guide surgical interventions and radiation therapy thanks to the development of user-friendly 3D modelling software. Standard imaging, while valuable, offers a limited 2D snapshot, whereas 3D reconstruction provides a comprehensive, volumetric understanding of thoracic tumours [8].
We aimed to evaluate the role in clinical practice of three-dimensional reconstruction of the airways in the planning of tracheo-bronchial stent insertion for MCAO.
MATERIALS AND METHODS
Study design
This was a retrospective, single-centre observational study conducted at the Thoracic Surgery Unit of University Campania ‘Vanvitelli’. The Institutional Review Board of University of Campania ‘Luigi Vanvitelli’ waived the need for ethical approval due to the retrospective nature of the study since there was no modification to the standard of care. In all cases, informed written consent was obtained from patients for the treatment and anonymous use of their data for scientific purposes. All the procedures were performed in accordance with international guidelines; with the Helsinki Declaration of 1975, revised in 1983; and the rules of the Italian laws of privacy.
We retrospectively analysed data of consecutive patients undergoing tracheo-bronchial stent insertion for MCAO from January 2012 to January 2024 at our institution. We implemented 3D preoperative reconstruction of the airways mainly for educational purposes, since ours is an academical teaching hospital, from 2020. Patients undergoing tracheo-bronchial stent insertion for MCAO with 3D reconstruction (3D Reconstruction Group) have been compared with patients treated prior to the use of 3D reconstruction (Standard Group). We included all patients that underwent tracheo-bronchial stent insertion for MCAO aged >18 years with follow-up for at least 6 months postoperative. We excluded patients with incomplete data or follow-up. The flow chart of patient selection is reported in Fig. 1.
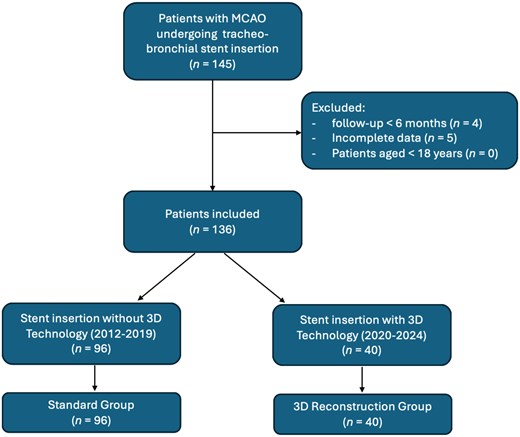
Flow chart of patient selection.
The primary end-point of the study was to restore airway patency. Secondary end-points were operative time, stent migration, postoperative complications and length of hospital stay.
Study population
For each patient the following data were recorded: anamnestic, comorbidities, history of previous cancer, spirometry, six-minute walking test (6MWT), laboratory data, characteristics of the stenosis, operative time, length of hospital stay (LOHS), peri-operative complications, intensive care unit stay (ICU), morbidity and mortality. Dyspnoea was measured through Modified Medical Research Council (mMRC) dyspnoea scale [9]. Each patient received a preoperative high-resolution computed tomography of the neck and thorax. Pulmonary function was also assessed postoperatively. Controls of stent positioning and patency were performed at 1, 3 and 6 months.
3D reconstruction of the upper airways
Three-dimensional reconstruction of upper airways was created with the open-source software ‘3D-slicer’ (Brigham and Women’s Hospital, Boston) [10]. 3D reconstruction started uploading preoperative chest CT-scan with <1.5 mm thickness as DICOM files and displaying them in multiplanar reconstruction. We checked the image orientation and quality, ensuring that the airways were clearly visible. We used the ‘Crop Volume’ module to focus on the region of interest. The tracheo-bronchial tree was segmented through the ‘segment editor’ instrument of the software because of the density differences between the airways and adjacent soft tissues, using the ‘Threshold’ effect to select the appropriate HU range. The ‘Paint’, ‘Erase’ and ‘Smoothing’ instrument were used to refine the segmentation and correct any inaccuracy. The lesion was identified, and then a digital model was created. 3D reconstruction gives the possibility to isolate the tracheo-bronchial stricture from neighbouring structures, freely rotate the model, display the structures in different colours, giving a comprehensive understanding of the airway’s anatomy. In the ‘Segments’ section, it is possible to adjust the colour, opacity and other visualization properties of the 3D model. 3D Slicer offers tools for measuring distances, volumes and other parameters. The parameters investigated were level, diameter, length of the stenosis and the base of implant of neoplastic tissue. We noticed the software's dependence on specific hardware configurations, which could affect rendering speed and image quality. To mitigate this, we performed all analyses on a dedicated workstation with consistent hardware specifications.
A virtual endoscopy was obtained from the 3D model, simulating the operative view, and helping to select the most appropriate kind of stent and level of stent placement. The 3D models were reviewed preoperatively, to plan and virtually rehearse the procedure. The models were saved on USB devices and uploaded in the operating room for intraoperative review.
Operative procedure
The stent was placed through rigid bronchoscopy (Stortz, Tuttlingen, Germany) under general anaesthesia. The patient was intubated with the rigid bronchoscope and a specialized anaesthetists maintained controlled ventilation during the procedure. The airway patency was restored through standard maneuvers consisting in mechanical debulking, coring and dilation. When needed, Neodymium-doped yttrium aluminum perovskite (Nd-YAP) laser was used for tumour devascularization or haemostasis. In cases of extrinsic tumour compression, the dilatation was performed with rigid bronchoscopes of increasing calibre and/or with angioplasty balloons. Either covered self-expanding metallic stents (SEMS) or silicone stents were used, choosing the shape (cylindrical, conical, Y or J-shape stent) based on the stenosis features. The stent was placed under endoscopic view. Flexible bronchoscopy supplemented rigid bronchoscopy to verify the stent placement and to aspirate blood and secretions. The operative procedure of a patient in 3D Reconstruction Group is shown in Figs 2 and 3 and Videos 1 and 2. Operative images of a patient in Standard Groups are showed in Fig. S1. The patients were extubated at the end of the procedure and admitted to ICU or directly to the surgical ward.
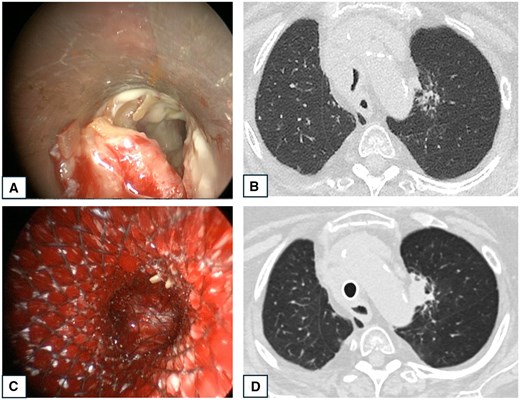
Operative images and CT-scan of a patient presenting tumoural infiltration of the lower third of the trachea. (A) Bronchoscopic image showing tumoural infiltration of the trachea. (B) Pre-operative CT-scan showing tracheal stenosis by a mediastinal mass. (C) Bronchoscopic image of a covered Y-shaped SEMS insertion. (D) CT-scan 2 days postoperative showing the Y-shaped stent in place with restored tracheal lumen.
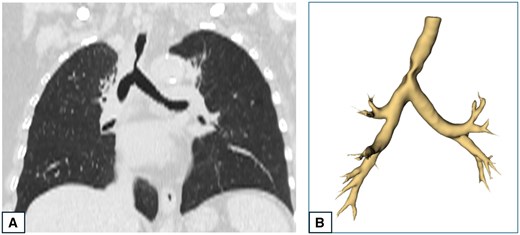
CT-scan and 3D reconstruction of a patient presenting tumoural infiltration of the lower third of the trachea. (A) CT-scan showing a stenosis in the lower third of the trachea. (B) 3D reconstruction of the tracheo-bronchial three showing the tracheal stenosis.
Video showing the preoperative images, 3D reconstruction and operative images of a patient presenting tumoural infiltration of the lower third of the trachea.
Video showing the preoperative images, 3D reconstruction and operative images of a patient presenting tumoural infiltration of the trachea dislocating the tracheal axis.
Statistical analysis
Data were summarized as mean and standard deviation for continuous variables and as absolute number and percentage for categorical variables. A Shapiro–Wilk test was performed to assess normality of data, and in case of non-normal distribution data were summarized as median and interquartile range. Differences between groups were evaluated with Chi-squared test for categorical variables and Student’s t-test for continuous variables, or Mann–Whitney U-test for not normally distributed continuous variables. For the significant univariate differences between the two groups, an analysis adjusted for age, presence of COPD, diabetes, severe stenosis grade and intraluminal stenosis was performed. For a continuous dependent variable, the adjusted P-value for the previous covariates was calculated using a linear regression model, while for a dichotomous dependent variable, a logistic regression model was used. A P-value < 0.05 was considered statistically significant. MedCalc statistical software (Version 12.3, Broekstraat 52; Mariakerke, Belgium) was used for this analysis. We used MedCalc software for its intuitive interface and availability at our institution.
RESULTS
In the study period, 145 patients were treated for MCAO with tracheo-bronchial stent insertion. Nine patients were excluded for incomplete data (n = 5) or lack of follow-up (n = 4). Therefore, 136 patients were included in our study: 40 patients (29%) underwent tracheo-bronchial stent insertion for MCAO with 3D reconstruction, while 96 patients (71%) underwent standard tracheo-bronchial stent insertion for MCAO (Table 1). The stenosis was in the main bronchi in 58% of patients (30% right, 28% left), in the trachea in 22% of patients and in the carina in 20% of patients. The stenosis was intraluminal in 55% of patients, extraluminal in 29% of patients, mixed in 16% of patients.
MCAO characteristics
| Variables | Total (n = 136) | 3D Reconstruction group (n = 40) | Standard group (n = 96) | P-value |
|---|---|---|---|---|
| Stenosis type, n (%) | ||||
| 75 (55) | 21 (53) | 54 (56) | 0.68 |
| 39 (29) | 10 (25) | 29 (30) | 0.54 |
| 22 (16) | 9 (22) | 13 (14) | 0.19 |
| Stenosis level, n (%) | ||||
| 30 (22) | 8 (20) | 22 (23) | 0.7 |
| 27 (20) | 9 (23) | 18 (19) | 0.67 |
| 79 (58) | 23 (57) | 56 (58) | 0.92 |
| Stenosis grade, n (%) | ||||
| 7 (5) | 2 (5) | 5 (5) | 0.96 |
| 34 (25) | 9 (23) | 25 (27) | 0.66 |
| 95 (70) | 29 (72) | 66 (68) | 0.66 |
| Stent type, n (%) | ||||
| 80 (59) | 23 (57) | 57 (59) | 0.83 |
| 27 (20) | 7 (18) | 20 (21) | 0.65 |
| 3 (2) | 1 (3) | 2 (2) | 0.88 |
| 26 (19) | 9 (22) | 17 (18) | 0.51 |
| MCAO aetiology, n (%) | ||||
| 98 (72) | 30 (75) | 68 (71) | 0.62 |
| 16 (12) | 3 (8) | 13 (14) | 0.34 |
| 15 (11) | 5 (12) | 10 (10) | 0.72 |
| 1 (1) | 0 | 1 (1) | 1 |
| 4 (3) | 2 (5) | 2 (2) | 0.35 |
| 2 (1) | 0 | 2 (2) | 1 |
A covered SEMS cylindrical stent was used in 80 patients (59%); a silicon Dumon cylindrical stent was used in 26 cases (19%). A covered SEMS Y-shaped stent was deployed in 27 patients with carinal involvement (20%), while a covered conical SEMS was chosen for 3 patients (2%). Stenosis grade was mild in 7 patients (5%), moderate in 34 patients (25%) and severe in 95 patients (70%). The most common MCAO aetiology was lung cancer (72%), followed by oesophageal (12%) and thyroid cancer (11%). Renal cancer (1%), lymphoma (3%) and colon cancer (1%) were other aetiologies. The groups resulted comparable in terms of symptoms, anamnestic and functional data (Table 2). Most patients had dyspnoea (98%) and cough (80%) as presenting symptoms. During preoperative functional assessment, the median FEV1 was 37.5%, median FVC was 36% and median 6MWT distance was 138.5 meters. In addition, 59 patients (43%) reported a dyspnoea mMRC4, 39 (29%) had a mMRC3, 25 (18%) had a mMRC2, 13 (10%) had a mMRC1, while no patients reported a mMRC0.
Characteristics of study population
| Variables | Total (n = 136) | 3D Reconstruction group (n = 40) | Standard group (n = 96) | P-Value |
|---|---|---|---|---|
| Age (years), M (SD) | 66 (7) | 67 (8) | 66 (8) | 0.24 |
| Gender (male), n (%) | 76 (56) | 23 (57) | 53 (55) | 0.8 |
| BMI (Kg/m2), median (IQR) | 23.75 (21.7–25.7) | 24.2 (22.2–25.8) | 23.55 (21.5–25.5) | 0.89 |
| Smoking history, n (%) | 81 (59) | 24 (60) | 57 (59) | 0.94 |
| Comorbidities, n (%) | ||||
| 31 (23) | 9 (22) | 22 (23) | 0.95 |
| 28 (21) | 9 (22) | 19 (20) | 0.72 |
| 19 (13) | 6 (15) | 13 (13) | 0.51 |
| ASA score, n (%) | ||||
| / | / | / | / |
| 13 (9) | 3 (7) | 10 (10) | 0.59 |
| 55 (41) | 16 (40) | 39 (41) | 0.94 |
| 68 (50) | 21 (53) | 47 (49) | 0.7 |
| Symptoms of MCAO, n (%) | ||||
| 134 (98) | 39 (98) | 95 (99) | 0.51 |
| 109 (80) | 32 (80) | 77 (80) | 0.97 |
| 42 (31) | 12 (30) | 30 (31) | 0.88 |
| 41 (30) | 13 (32) | 28 (29) | 0.69 |
| Preoperative mMRC, n (%) | ||||
| / | / | / | / |
| 13 (10) | 4 (10) | 9 (9) | 0.91 |
| 25 (18) | 8 (20) | 17 (18) | 0.53 |
| 39 (29) | 11 (28) | 28 (29) | 0.18 |
| 59 (43) | 17 (42) | 42 (44) | 0.96 |
| Preoperative FEV1%, median (IQR) | 37.5 (33–42) | 36.5 (32.7–41.25) | 38.5 (34–42) | 0.09 |
| Preoperative FVC%, median (IQR) | 36 (32–39) | 34 (31–37.2) | 36 (32–40) | 0.88 |
| Preoperative 6MWT (m), median (IQR) | 138.5 (108.7–164.2) | 143 (106.2–155) | 138 (113.7–166) | 0.50 |
| Preoperative laboratory data | ||||
| 10.010 (1072) | 10.750 (1103) | 9.954 (1210) | 0.66 |
| 12.3 (2.2) | 13.1 (1.8) | 12.0 (2.7) | 0.81 |
| 274 (210–313) | 278 (257–301) | 271 (210–313) | 0.24 |
BMI: Body mass index.
Comparison between groups
The outcome comparison between 3D reconstruction group and standard group is reported in Table 3. Median operative time was 47 min, resulting shorter in 3D reconstruction group in comparison with standard group (40 vs 48 min), with a significant difference in the univariate analysis (P = 0.03) and multivariable analysis (P = 0.04) (Fig. S2). Successful restore of the airway patency was obtained in 130 patients (96%), without differences between groups (P = 0.48). Fifty-seven patients were admitted to the ICU postoperatively (P = 0.98). The mean ICU stay was 26 h, without differences between groups (P = 0.07). There was no significant difference in LOHS (P = 0.12) and reoperation rate (P = 0.95).
Outcome comparison
| Variables | Total (n = 136) | 3D Reconstruction group (n = 40) | Standard group (n = 96) | P-Value |
|---|---|---|---|---|
| Operative time (min), median (IQR) | 47 (30-63) | 40 (29-53) | 48 (30-66) | 0.03 |
| Restore of airway patency, n (%) | 130 (96) | 38 (95) | 92 (96) | 0.48 |
| ICU admission, n (%) | 78 (57) | 23 (58) | 55 (57) | 0.98 |
| ICU stay (hours), M (SD) | 26 (4) | 26 (3) | 27 (5) | 0.07 |
| LOHS (days), median (IQR) | 6 (4-8) | 5 (3-8) | 6 (4-8) | 0.12 |
| Postoperative mMRC, n (%) | ||||
| 4 (3) | 1 (2) | 3 (3) | 0.84 |
| 19 (14) | 5 (13) | 14 (15) | 0.74 |
| 37 (27) | 12 (30) | 25 (26) | 0.63 |
| 57 (42) | 16 (40) | 41 (42) | 0.77 |
| 19 (14) | 6 (15) | 13 (14) | 0.82 |
| Postoperative FEV1%, median (IQR) | 67 (65-70) | 68.3 (65-71) | 67 (65-70) | 0.09 |
| Postoperative FVC%, median (IQR) | 64.5 (62-68) | 64 (63-66) | 65 (62-70) | 0.12 |
| Postoperative 6MWT (m), median (IQR) | 268 (242-295) | 265 (249-282) | 270 (230-298) | 0.89 |
| Complications | ||||
| 18 (13) | 2 (5) | 16 (17) | 0.04 |
| 14 (10) | 4 (10) | 10 (10) | 0.94 |
| 12 (8) | 3 (8) | 9 (9) | 0.72 |
| 8 (6) | 2 (5) | 6 (6) | 0.77 |
| 9 (7) | 3 (8) | 6 (6) | 0.79 |
| Reoperation, n (%) | 20 (15) | 6 (15) | 14 (15) | 0.95 |
| Chemo/Radiotherapy after stent placement, n (%) | 105 (77) | 30 (75) | 75 (78) | 0.69 |
| 30-day mortality, n (%) | 8 (6) | 2 (5) | 6 (6) | 0.77 |
| 90-day mortality, n (%) | 21 (15) | 6 (15) | 15 (16) | 0.92 |
| Overall survival (months), median (IQR) | 9 (6-12) | 10 (7-12) | 9 (6-12) | 0.21 |
ICU: Intensive care unit.
The most common complication was stent migration in nineteen patients (13%), more frequent in the standard group (17% vs 5%) with a significant difference in the univariate analysis (P = 0.04) and multivariable analysis (P = 0.02) (Fig. S2). Fourteen patients (10%) experienced restenosis (P = 0.94). Stent infection was found in 12 patients (8%, P = 0.72), haemoptysis in 8 patients (6%, P = 0.77), and arrhythmias in 9 patients (7%, P = 0.79).
Median postoperative FEV1 was 67, median FVC was 64.5 and median distance at 6MWT was 268 m. There was a significant increase in FEV1, FVC and 6MWT in both groups (P = 0.003, P = 0.02 and P = 0.01). A reduction in dyspnoea severity was observed in both groups, with less patients manifesting dyspnoea grade mMRC4 (14% vs 43%, P = 0.001) and more patients reporting grade mMRC3 (42% vs 29%, P = 0.02), grade 2 (27% vs 18%, P = 0.08), grade 1 (14% vs 10%, P = 0.24) and grade 0 (3% vs 0, P = 0.16). A total of 105 patients (77%) underwent chemo/radiotherapy after tracheo-bronchial stent insertion, without significant difference between groups (P = 0.69). Hence, in both groups the outcome of increasing respiratory function was achieved, allowing a good percentage of patients to undergo systemic cancer treatment.
No intraprocedural deaths were observed. The median overall survival was 9 months (P = 0.46), similar between groups. There were no significant differences in 30-day and 90-day mortality rate between groups (P = 0.77, P = 0.92). This finding suggests that the implementation of 3D reconstruction for preoperative planning of tracheo-bronchial stent insertion did not impact short/intermediate-term survival rates in patients with MCAO.
DISCUSSION
The implications of MCAO are often invalidating for patients. Dyspnoea, respiratory failure, haemoptysis, post-obstructive pneumonia, and tracheoesophageal fistulas represent the most common complications of MCAO [11]. The majority of MCAO are surgically inoperable and require a multimodality palliative treatment due to advanced cancer stage. Tracheo-bronchial stents have emerged as an effective treatment for tumoural extrinsic compression, submucosal tumour involvement, and maintaining patency after bronchoscopic tumour removal [12]. While it is demonstrated that airway stents improve the quality of affected patient’s life by alleviating symptoms [13], the choice of appropriate stent is crucial to reduce complications and reintervention [14]. Our research indicated that pre-operative 3D reconstruction may be a useful tool for planning tracheo-bronchial stent insertion for MCAO.
First, we found that 3D reconstruction was associated with a significant reduction of operative time. 3D reconstruction allows to isolate the stenotic tract from neighbouring structures giving the operator a different perspective compared with 2D vision. This kind of preoperative planning is particularly useful for operators at the beginning of their experience as it may facilitate patient selection [15], as well as expert operators in occasion of complex tracheal defects. Pre-operative 3D reconstruction allows the operator to have a personalized and comprehensive vision, increasing the confidence when coming to the actual procedure. The integration of 3D planning into airway intervention training offers a powerful approach to improving operator proficiency and patient safety. By providing realistic simulations and enhancing anatomical understanding, 3D technology can empower less-experienced operators to perform complex procedures with greater confidence and accuracy.
During bronchoscopic stent insertion, coordination with a specialized anaesthesiologist is fundamental to avoid long periods of apnea and desaturation. A shorter operative time is beneficial in this subset of patient with high anaesthesiologic risk, strictly related to underlying conditions.
Second, the results of our study highlighted a lower rate of stent migration in 3D reconstruction group. Stent migration is a dreaded complication of endoscopic stent placement, with a reported incidence of 5–20% [16]. A displaced stent may obstruct airways, causing respiratory distress and hypoxia. Stent migration can damage the tracheal mucosa, leading to inflammation, perforation, and scar tissue formation. Furthermore, a migrated stent can shift to a suboptimal position, increasing the risk of restenosis. Both stent migration and restenosis severely impact patients with MCAO, requiring additional procedures and compromising their quality of life. Stent migration incidence is believed to be higher for silicone stents than for SEMS [17]. In our study, there were no difference between groups in the distribution of silicon and SEMS and in stent morphology. We think therefore that the lower rate of stent migration in 3D group was not influenced by the kind of stent. Stent selection was guided by comparing airway morphology and diameters, visualized both in 3D reconstructed images and CT-scan images, to the available stent kinds to select the most fitting and reducing stent migration due to mismatch in size between the stent and tracheo-bronchial segment. An example of 3D model use to select the stent size is reported in Fig. 4: the tracheal deviation caused by thyroid carcinoma exerting extrinsic compression is visible on multiplanar reconstruction CT-scan, but the bidimensional view can underestimate the length of the defect. 3D reconstruction allowed to correctly measure the length of the stenotic tract and select the stent length, being 6 cm on the 3D reconstruction, while it was underestimated at 5 cm on the CT-scan.
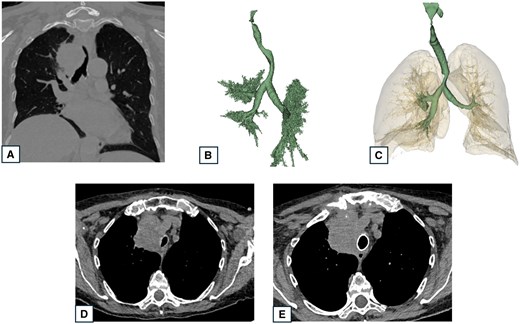
CT-scan images and 3D reconstruction of a patient presenting tracheal infiltration and deviation by a thyroid tumour. (A) Preoperative CT-view showing tracheal stenosis and deviation; (B) Preoperative 3D reconstruction showing tracheal stenosis and deviation; (C) Postoperative 3D reconstruction showing tracheal stent and lung in transparency; (D) Preoperative CT showing tracheal stenosis and tumour compression; and (E) Postoperative CT-scan showing the cylindric tracheal stent restoring airway patency.
The most natural step forward after 3D reconstruction of the airways is manufacturing 3D-printed models of the trachea and 3D printed patient-specific tracheo-bronchial stent. 3D reconstruction is a useful tool with no additional costs, particularly when using an open-source software, compared with the standard technique, and characterized by a short processing time of about 30–40 min depending on the operator’s experience. While there is an initial investment in time needed to learn to perform 3D reconstruction, the potential for reduced operative time and decreased complications suggests that it could be a cost-effective strategy for tracheo-bronchial stent insertion in patients with MCAO. 3D-printing is, conversely, a time-consuming process with additional costs. The realization of a 3D-printed model reproducing the patient’s trachea has been reported by some authors [18] with the objective of stent insertion simulation. The rehearsal of stent placement before the procedure enabled a successful and quick procedure, particularly in cases of complex stenosis, similarly to our experience, even if the advantages have not been statistically proved. The downside of this technique is the necessity of an available 3D-printer and the time needed to print the model, around 3–12 h.
Regarding 3D custom stents there are some clinical experiences conducted under local ethical committee authorization or FDA-granted compassionate use exemption with promising results, but there is yet not an official authorization for clinical use [19]. The production and sterilization time of 30–50 days represent the main limitation for their application in the context of MCAO. It is possible that processing times will be shortened, but at present is still not a practical solution in an urgency setting.
Some limitations of our study are its small sample size, single-centre design, and retrospective nature. Due to the small sample size, we acknowledge that our study lacked statistical power to detect some clinically relevant differences in the postoperative outcomes, including ICU stay, LOHS and postoperative 6MWT. Also, the 3D Reconstruction group is underpowered to detect differences in rare outcomes (e.g. mortality). Our study’s wide time interval, covering more than 10 years, may affect the results as we implemented 3D-reconstruction only in 2020. Improved stent materials or bronchoscopy techniques variation over the study period could potentially confound the results of our analysis. However, our centre experience with rigid bronchoscopy started several years before this study. All procedures were performed by the same operator (A.F.) with an experience of more than 700 endoscopic procedures, limiting the risk of bias related to technical variability. This characteristic of our experience may nonetheless introduce single-operator bias: the learning curve and case selection favour expert operators, potentially overestimating the benefits of new techniques like 3D reconstruction. These biases may limit the generalizability of results, therefore multicentre prospective randomized trials and standardized training are needed to validate our findings. Transparency regarding operator experience is essential for correct interpretation. A longer follow-up period would be useful to confirm our research results validity in the future.
We decided to include patients treated for MCAO with different kinds of stent, instead of focusing our attention on a specific kind. This choice was made to have a wider population, but it needs to be acknowledged as a possible confounding factor. We think that our results should be interpreted with caution, and that our experience can be useful to other physician for the endoscopic treatment of MCAO.
CONCLUSIONS
Three-dimensional reconstruction of the upper airways has a potential role in shortening operative time and reducing stent migration in patients with MCAO. The 3D reconstruction implementation improves the accuracy of bronchoscopic procedure planning without any added cost or delay of treatment. The current accessibility of 3D reconstruction software allows the use of this technique in centres without the need of advanced imaging tools.
SUPPLEMENTARY MATERIAL
Supplementary material is available at ICVTS online.
FUNDING
This research received no external funding.
CONFLICT OF INTEREST
The authors declare no conflict of interest.
DATA AVAILABILITY
The data presented in this study are available on request from the corresponding author.
INFORMED CONSENT STATEMENT
Written informed consent has been obtained from all subjects involved in the study.
INSTITUTIONAL REVIEW BOARD STATEMENT
This study was conducted according to the guidelines of the Declaration of Helsinki and approved by the Institutional Ethics Committee of Università Degli Studi Della Campania ‘Luigi Vanvitelli’. Due to the retrospective nature of this study, no specific approval code was required because there was no modification in standard of patient care.
Author contributions
Beatrice Leonardi, MD: Conceptualization; Visualization; Writing—original draft. Stefano Forte: Resources. Antonio Marella: Data curation. Francesco Panini D’Alba: Data curation. Giuseppe Vicario: Data curation. Grazia Bergameo: Investigation. Francesca Capasso: Investigation. Francesco Leone: Methodology. Noemi Maria Giorgiano: Formal analysis. Davide Gerardo Pica: Investigation. Emanuele Martorana: Supervision. Riccardo Villa: Formal analysis. Maria Marvulli: Resources. Riccardo Monti: Formal analysis. Gaetana Messina: Writing—original draft. Francesco Ferrigno: Writing—review & editing. Marco Mosella: Resources. Paolo Chiodini: Formal analysis. Giovanni Vicidomini: Methodology. Alfonso Fiorelli: Conceptualization; Visualization; Writing—review & editing
Reviewer information
Interdisciplinary CardioVascular and Thoracic Surgery thanks Mohammed Nabil Abd AlJawad and the other, anonymous reviewer(s) for their contribution to the peer review process of this article.
REFERENCES
ABBREVIATIONS
- ICU
Intensive care unit
- LOHS
Length of hospital stay
- MCAO
Malignant central airway obstruction
- SEMS
Self-expanding metallic stents
