


Abstract

The Magna Ease aortic valve (Edwards Lifesciences, Irvine, CA) is a third-generation bioprosthetic valve developed as a modification of the well-studied Perimount and Magna valve designs. This study’s objective is to evaluate a large, single-centre experience with Magna Ease aortic valve replacement (AVR) focusing on clinical outcomes and haemodynamic performance.
All patients undergoing AVR between 8/2010 and 10/2018 at our institution implanted with the Magna Ease valve were included except those undergoing ventricular assist device or congenital aortic surgery. Primary outcomes were overall survival and freedom from reoperation. Mean transprosthetic gradient (mTPG) and structural valve deterioration (SVD) served as secondary outcomes.
Totally 1126 consecutive implantations of Magna Ease valves were included. Concomitant procedures were performed in 56.5% (n = 636). No severe patient–prosthesis mismatch (PPM) was present at implantation. Overall survival at 30 days, 1 year, 5 years and 9 years was 97.2%, 95.0%, 86.1% and 78.2%, respectively, with improved survival for isolated AVR. Total of 2.4% (n = 27) of patients required reoperation with 0.3% (n = 4) for SVD. Echocardiographic follow-up data revealed low mTPG throughout the study period. SVD occurred in 28.7% of patients at a mean of 3.9 years post implantation.
Magna Ease AVR maintained low mean transprosthetic gradients throughout mid-term evaluation and was associated with excellent overall survival and freedom from reoperation at nine years post implantation.
INTRODUCTION
The Carpentier–Edwards Perimount Magna Ease aortic valve (PMEAV) (Edwards Lifesciences, Irvine, CA) is a bovine, stented, supra-annular aortic valve bioprosthesis built on the prior designs of the well-established Perimount and Magna valves. The PMEAV differs primarily by a lower profile and narrower sewing ring with the addition of a proprietary Thermafix [1] tissue treatment intended to reduce calcification and valve deterioration over time. In the case of aortic valvular disease, the choice of valve implant is now more complex than ever given multiple, excellent tissue valves available for surgical implantation [2] and the increasing role of transcatheter devices [3]. Multiple prior studies demonstrate the safety and efficacy of the Perimount valves [4, 5] but few data exist specifically regarding the mid-term haemodynamic outcomes of the Magna Ease 3300 TFX model. [4, 6] The objective of this study is to report outcomes from a large, single-centre experience with the PMEAV focusing on mid-term valve-related outcomes and follow-up echocardiographic data.
MATERIALS and METHODS
Ethical statement
This study was approved by the Spectrum Health Institutional Review Board, approval number 2019–116 on May 9, 2019. Patient consent for this study protocol was waived.
Study cohort
Adult Patients undergoing surgical aortic valve replacement (AVR) at Spectrum Health Meijer Heart Center between 17 August 2010 and 26 October 2018 were included in this analysis. Patient follow-up was stopped on September 29, 2019. Isolated AVR, AVR with concomitant procedures, as well as emergent and redo operations, were included. All causes of aortic valvular disease were included. Patients with a previous or concomitant implant of a left ventricular assist device (LVAD), previous congenital or paediatric aortic valve surgery, and those with implantation of the PMEAV in a non-aortic position were excluded. Postoperatively, all patients received aspirin indefinitely; warfarin was added for those with a mitral or tricuspid valve procedure, anti-arrythmia surgery or otherwise at high-risk for thromboembolic events. Clinical data were extracted from the prospectively maintained institutional Society of Thoracic Surgeons database. Echocardiographic data were retrospectively retrieved from patient electronic medical record.
Data analysis
Baseline demographic data and patient characteristics were evaluated. The primary outcome was overall survival and freedom from aortic valve reoperation. Reoperation included patients who received transcatheter AVR. Echocardiographically determined mean transprosthetic gradient (mTPG) and structural valve deterioration served as secondary outcomes. Mortality data were obtained from patient charts and verified with the State of Michigan Death Index. Perioperative morbidities were queried from local STS database. Aortic valve-specific outcomes included Patient-Prosthesis Mismatch (PPM) at implant defined by the manufacturer’s effective orifice area (EOA) and aortic valve reintervention categorized by intervention for structural valve deterioration, prosthetic valve endocarditis and non-structural valve deterioration.
Echocardiography data were retrieved from the electronic medical record. Prosthetic valve area was calculated by the continuity equation [7] if not reported directly; pressure gradients were abstracted from the echocardiogram reports. Trans-thoracic echocardiogram (TTE) data were grouped into the following time periods, as not all patients had a TTE at the specified time intervals: 3 months (0–6 months), 1 year (6–24 months), 3 years (24–48 months), 5 years (48–72 months), 8 years (7–9 years). If a patient had more than one TTE within the aforementioned intervals, the TTE nearest the specified time point was included in the analysis.
Structural valve deterioration (SVD) was defined by criteria established by the Valve Academic Research Consortium-2 (VARC-2) [8]. These criteria include mTPG greater than 20 mmHg, an EOA of 0.9 cm2 or less for body surface area (BSA) of < 1.6 m2 or EOA < 1.1 cm2 for a BSA ≥ 1.6 m2, Doppler velocity index of <0.35, and moderate or severe aortic insufficiency. PPM was defined as EOA index of <0.85 cm2/m2 and was categorized as severe (<0.65 cm2/m2), moderate (0.65–0.75 cm2/m2) and mild (0.75–0.85 cm2/m2) [8].
Statistical methods
Descriptive statistics are reported on the entire patient population. Continuous data are expressed as mean ± standard deviation or median [25th, 75th percentile], where appropriate due to normality of data. Categorical data are expressed as frequency (%). To compare postoperative categorical outcomes by procedure type, a Chi-square analysis was used unless there was more than 20% of the expected cell counts less than 5, then Fishers exact test was used. To analyse the continuous postoperative outcomes by procedure type Kruskal–Wallis analysis was utilized and if the overall analysis was significant a post-hoc comparison using Wilcoxon rank sum and a Bonferroni correction were utilized to identify where the differences exist. Kaplan–Meier curves were utilized to visualize the time to event analyses for mortality and SVD. To analyse the difference in isolated vs non-isolated AVR, the log rank test statistic was used. All analyses were performed using SAS (SAS Enterprise Guide software, Version 7.1, SAS Institute Inc, Cary, NC).
RESULTS
Baseline demographics and patient characteristics
During the study period, there were 2196 bioprosthetic AVRs of which 1194 were with the PMEAV. Sixty-eight patients were excluded for the above criteria; thus, the final study population consisted of 1126 consecutive PMEAV Bioprosthetic AVRs. Males represented 72.8% of the study population and the mean age of the patients was 67.1 ± 12.1 years. Baseline and operative characteristics of the study population are displayed in Table 1. The mean predicted Society of Thoracic Surgeon’s risk score was 3% ± 3% for all patients. Most patients had preserved left ventricular ejection fraction and over half underwent concomitant procedures.
Baseline patient characteristics and operative details
| Variable | Study population (N = 1126) | |
|---|---|---|
| Age (years) | 67.1 ± 12.1 | |
| Gender (male) | 820 (72.8) | |
| Body mass index (kg/m2) | 30.1 ± 6.1 | |
| Body surface area (m2) | 2.1 ± 0.3 | |
| Diabetes | 335 (29.8) | |
| Dialysis | 22 (2.0) | |
| Lung disease | 274 (24.3) | |
| COPD | 96 (8.5) | |
| Cerebrovascular disease | 164 (14.6) | |
| Peripheral artery disease | 151 (13.4) | |
| Prior myocardial infarction | 131 (11.6) | |
| Heart failure | 168 (14.9) | |
| Hypertension | 938 (83.3) | |
| Dyslipidaemia | 841 (74.7) | |
| Liver disease | 31 (2.8) | |
| Family history of CAD | 223 (19.8) | |
| Arrhythmia | 211 (18.7) | |
| Atrial fibrillation | 188 (16.7) | |
| Persistent/permanent | 87 (7.7) | |
| Other atrial fibrillation | 101 (9.0) | |
| Smoking history (current/former) | 616 (54.7) | |
| Illicit drug use | 56 (5.0) | |
| Alcohol use (drinks/week) | ||
| None | 458 (40.7) | |
| <2/week | 417 (37.0) | |
| 2–7/week | 159 (14.1) | |
| >7/week | 92 (8.2) | |
| Depression | 151 (13.4) | |
| Endocarditis | 58 (5.1) | |
| Mediastinal radiation | 18 (1.6) | |
| Immunosuppression | 39 (3.5) | |
| Cardiogenic shock | 28 (2.5) | |
| Albumin | 3.7 ± 0.5 | |
| Ejection fraction (%) | 55.3 ± 13.2 | |
| Haemoglobin (g/dl) | 13.3 ± 2.1 | |
| Platelets (x10^3/uL) | 214 ± 68 | |
| Degree of aortic insufficiency | ||
| None | 269 (23.9) | |
| Trace | 148 (13.1) | |
| Mild | 337 (29.9) | |
| Moderate | 182 (16.2) | |
| Severe | 190 (16.9) | |
| Society of thoracic surgeons score | 0.03 ± 0.03 | |
| Redo operations | 114 (10.1) | |
| Indication | ||
| Endocarditis | 58 (5.1) | |
| Root/aorta operation | 88 (7.8) | |
| Aortic stenosis | 765 (67.9) | |
| Aortic insufficiency | 215 (19.1) | |
| Operative status | ||
| Elective | 899 (79.8) | |
| Urgent | 193 (17.1) | |
| Emergent | 34 (3.0) | |
| Operative approach | ||
| Sternotomy | 983 (87.3) | |
| Mini-sternotomy | 127 (11.3) | |
| Right thoracotomy | 16 (1.4) | |
| Concomitant procedure | ||
| Coronary artery bypass grafting | 413 (36.7) | |
| Mitral or tricuspid valve | 86 (7.6) | |
| Antiarrhythmic procedure | 52 (4.6) | |
| Root operation | 85 (7.6) | |
| Cross clamp time (min) | 129.1 ± 58.4 | |
| Cardiopulmonary bypass time (min) | 161.5 ± 73.6 | |
Continuous variables are presented as mean ± SD and categorical variables as number (%).
Operative characteristics
Of the 1126 patients, most were elective operations in patients without a prior history of heart surgery. A minority of AVRs were performed through a minimally invasive partial sternotomy or right thoracotomy. Table 2 summarizes the number of implants by valve size. The most common sizes of implants were 23 mm and 25 mm prostheses. PPM was present at implant in 1.6% of patients (n = 14) with no severe PPM noted.
Valve implant sizes and patient–prosthesis mismatch
| Variable | Study population (N = 1126) |
|---|---|
| Valve size (mm) | |
| 19 | 17 (1.5) |
| 21 | 122 (11.0) |
| 23 | 331 (29.8) |
| 25 | 362 (32.6) |
| 27 | 227 (20.4) |
| 29 | 53 (4.8) |
| Estimated PPM at implant | |
| 0.75-0.85 | 12 (1.4) |
| 0.65-0.75 | 2 (0.2) |
| <0.65 | 0 (0.0) |
| Variable | Study population (N = 1126) |
|---|---|
| Valve size (mm) | |
| 19 | 17 (1.5) |
| 21 | 122 (11.0) |
| 23 | 331 (29.8) |
| 25 | 362 (32.6) |
| 27 | 227 (20.4) |
| 29 | 53 (4.8) |
| Estimated PPM at implant | |
| 0.75-0.85 | 12 (1.4) |
| 0.65-0.75 | 2 (0.2) |
| <0.65 | 0 (0.0) |
PPM: patient–prosthesis mismatch.
Categorical variables are presented as number (%).
Operative outcomes
Table 3 displays 30-day clinical outcomes data for the entire study population as well as each operative subset. Overall 30-day all-cause mortality was 3.3% (n = 37) and 1.0% (n = 5) for isolated AVR. Multi-valve procedures were associated with highest perioperative mortality. Risk of stroke, renal failure and need for permanent pacemaker were low and rate of postoperative complications was generally lower in the isolated AVR group. The most common postoperative complication was atrial fibrillation, occurring in 32.7% (n = 368); this was lower in the subset that also received an anti-arrhythmia procedure 21.1% (n = 11, P < 0.001).
Postoperative outcomes
| Variable | Overall (N = 1126) | Isolated AVR (N = 490) | AVR + CABG (N = 413) | AVR + MV/TV (N = 86) | AVR + antiarrhythmic procedure (N = 52) | Root operation (N = 85) | P-value |
|---|---|---|---|---|---|---|---|
| Hospital mortality | 27 (2.4) | 4 (0.8) | 9 (2.2) | 8 (9.3) | 3 (5.8) | 3 (3.5) | <0.001* |
| 30—Day mortality | 37 (3.3) | 5 (1.0) | 16 (3.9) | 9 (10.5) | 3 (5.8) | 4 (4.7) | <0.001* |
| Reoperation | 56 (5.0) | 18 (3.7) | 16 (3.9) | 11 (12.8) | 3 (5.8) | 8 (9.4) | 0.003* |
| Prolonged vent. | 142 (12.6) | 34 (6.9) | 64 (15.5) | 23 (26.7) | 6 (11.5) | 15 (17.7) | <0.001 |
| Pneumonia | 32 (2.8) | 8 (1.6) | 15 (3.6) | 5 (5.8) | 1 (1.9) | 3 (3.5) | 0.11* |
| Stroke | 33 (2.9) | 11 (2.2) | 16 (3.9) | 3 (3.5) | 0 (0.0) | 3 (3.5) | 0.43* |
| Renal failure | 68 (6.0) | 17 (3.5) | 28 (6.8) | 9 (10.5) | 4 (7.7) | 10 (11.8) | 0.007 |
| Atrial fibrillation | 368 (32.7) | 136 (27.8) | 165 (40.0) | 27 (31.4) | 11 (21.1) | 29 (34.1) | <0.001 |
| Pacemaker | 45 (4.0) | 23 (4.7) | 11 (2.7) | 3 (3.5) | 5 (9.6) | 3 (3.5) | 0.15* |
| Sternal infection | 1 (0.1) | 1 (0.2) | 0 (0.0) | 0 (0.0) | 0 (0.0) | 0 (0.0) | 1.00* |
| Sepsis | 19 (1.7) | 7 (1.4) | 8 (1.9) | 3 (3.5) | 1 (1.9) | 0 (0.0) | 0.39* |
| LOS (days) | 7 [5, 12] | 6 [5, 9] | 9 [6, 13] | 11 [8, 17] | 9 [6, 12] | 7 [5, 13] | <0.001 |
LOS: length of stay.
Numeric data are expressed as median [25th, 75th percentile], categorical data are expressed as frequency (%). (*) denotes Fishers exact test was used.
Mid-term outcomes
Total follow-up was 5261 patient years with mean follow-up time of 5 ± 2 years. Figure 1 depicts a Kaplan–Meier survival curve separated by indication for operation. Overall survival probability at 30 days, 1, 5 and 9 years was 97.2%, 95.0%, 86.1%, and 78.2% respectively. Survival probability of isolated versus non-isolated AVRs was significantly better at each time period as displayed in Table 4 (P < 0.001) and when comparing aortic stenosis patients to endocarditis (P = 0.002) and aortic insufficiency (P = 0.002), displayed in Figure 1.
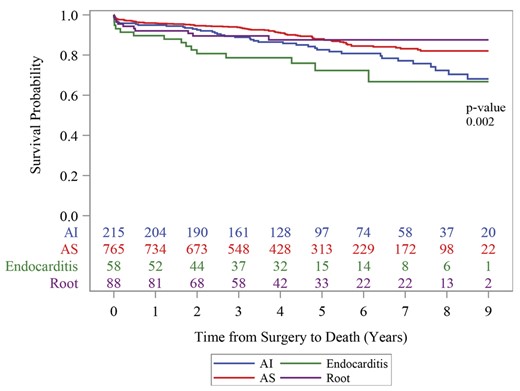
Kaplan–Meier 9-year freedom from death by indication for AVR.
AI: aortic insufficiency; AS: aortic stenosis.
Isolated versus not isolated aortic valve replacement survival
| Follow-up | Isolated AVR | Not isolated AVR |
|---|---|---|
| 1 Year | 96.9 (95.0, 98.1) | 93.7 (91.5, 95.3) |
| 5 Years | 91.2 (87.9, 93.7) | 82.1 (78.3, 85.2) |
| 9 Years | 84.1 (77.6, 88.9) | 73.7 (68.3, 78.3) |
| Follow-up | Isolated AVR | Not isolated AVR |
|---|---|---|
| 1 Year | 96.9 (95.0, 98.1) | 93.7 (91.5, 95.3) |
| 5 Years | 91.2 (87.9, 93.7) | 82.1 (78.3, 85.2) |
| 9 Years | 84.1 (77.6, 88.9) | 73.7 (68.3, 78.3) |
AVR: aortic valve replacement.
Numeric data are expressed as median (25th, 75th percentile).
Reoperation occurred in 2.9% (n = 27) at a median of 2.1 years (0.5–3.4 years interquartile range). Sixteen reoperations occurred in the isolated AVR group with the remainder distributed among the other groups. Three reoperations occurred for either ascending or descending aortic aneurysm and a total of 12 patients required reoperation for prosthetic valve infectious endocarditis, of which four had recurrent infectious endocarditis. Four reoperations occurred for SVD of which three received transcatheter AVR with the remaining patients having a root replacement with a 29 mm PMEAV valve within a 30-mm Gelweave graft (Terumo Aortic, Sunrise FL, USA). Reoperation for SVD occurred at a median of 2.4 years. The remaining seven reoperations occurred for ventricular pseudoaneurysm (n = 2), paravalvular leak (n = 2), late non-aneurysmal dehiscence of the aortic suture line without repeat AVR (n = 1), orthotopic heart transplant for right ventricular failure without evidence of aortic valve degeneration (n = 1) and paravalvular pannus (n = 1).
Echocardiography data
Follow-up echocardiographic data were available for 90.1% (n = 1015) patients postoperatively for a mean of two years and a maximum of nine years postoperatively. A total of 2319 echocardiogram follow-up years were obtained. Totally 3875 transthoracic echocardiograms (TTE) were reviewed of which 68.7% had reported mTPG. Mean transprosthetic gradient was available for 37 of the 66 patients with TTE follow-up at eight years post implantation. Table 5 reports the transprosthetic gradient for the entire study population during the follow-up period and mTPG stratified by implant size. Mean transprosthetic gradient postoperatively was 11.5 ± 6.1 mmHg, which decreased from an overall mean gradient 37.1 ± 17.4 mmHg preoperatively. Mean gradient for aortic stenosis patients only was 40.7 ± 15.6 mmHg preoperatively. Overall mTPG remained low with a slight, yet progressive interval increases to 13.7 ± 8.2 mmHg by eight years. Mean transprosthetic gradient was lowest in larger valve (25–29 mm) sizes. The trends in mTPG in those patients’ echocardiographic follow-up at eight years are displayed in Figure 3.
Echocardiographic follow-up data
| Variable | 3 months | 1 year | 3 years | 5 years | 8 years |
|---|---|---|---|---|---|
| Mean gradient | N = 699 11.5 ± 6.1 | N = 355 12.0 ± 6.8 | N = 347 12.0 ± 5.1 | N = 174 12.6 ± 7.1 | N = 37 13.7 ± 8.2 |
| Mean gradient stratified by size (mm) | |||||
| 19 | N = 6 13.9 ± 5.3 | N = 3 14.3 ± 5.1 | N = 7 16.8 ± 4.4 | N = 5 21.5 ± 10.7 | N = 2 15.5 ± 4.5 |
| 21 | N = 78 14.0 ± 5.7 | N = 38 13.5 ± 5.2 | N = 50 13.7 ± 5.3 | N = 22 13.6 ± 4.6 | N = 6 12.1 ± 6.4 |
| 23 | N = 208 12.9 ± 8.3 | N = 127 13.0 ± 6.3 | N = 113 12.6 ± 4.8 | N = 61 13.1 ± 5.9 | N = 15 16.8 ± 10.3 |
| 25 | N = 236 11.2 ± 4.6 | N = 113 11.4 ± 5.0 | N = 111 11.7 ± 5.4 | N = 50 13.3 ± 9.2 | N = 11 11.2 ± 6.1 |
| 27 | N = 135 9.4 ± 3.55 | N = 58 10.8 ± 11.0 | N = 53 9.8 ± 4.3 | N = 30 8.7 ± 4.4 | N = 3 8.9 ± 5.0 |
| 29 | N = 34 8.2 ± 3.4 | N = 16 8.5 ± 2.4 | N = 13 8.3 ± 2.9 | N = 5 9.9 ± 4.8 | N = 0 — |
Categorical data are expressed as number (%); continuous data are expressed as median ± SD.
SVD, as defined in our study, occurred in 28.7% (n = 323) of patients at a mean interval of 3.9 years post implantation. The main criteria by which patients met definitions for SVD were mean trans-prosthetic gradient > 20 mmHg (24.7%) and decreased aortic valve area (20.7%). Figure 2 summarizes freedom from SVD of the study patients by indication for AVR in a Kaplan–Meier curve. Moderate or severe prosthetic regurgitation occurred in 38 (3.9%) of patients excluding those with postoperative endocarditis.
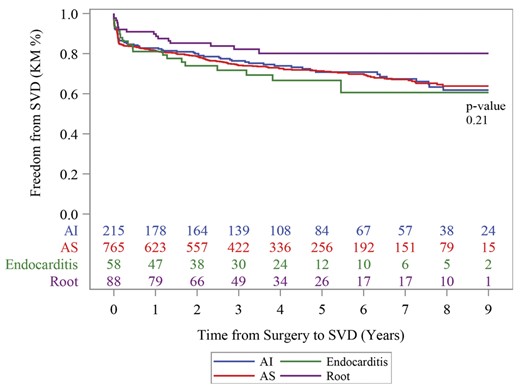
Kaplan–Meier freedom from structural valve deterioration (SVD) at 9 years by indication for AVR. AI: aortic insufficiency; AS: aortic stenosis; SVD: structural valve deterioration.
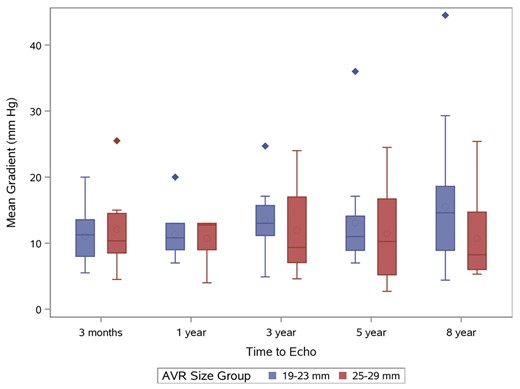
Mean transprosthetic gradient in patients with an 8-year follow-up.
Circles within boxes = mean; Line across middle of box = median; the bottom and top of the box = 25th and 75th percentile, respectively. Error bars represent 1.5 times the 25th and 75th percentiles. Outlier data outside of these ranges are represented by the diamonds.
DISCUSSION
The PMEAV valve is the third generation of the Carpentier-Edwards stented bioprosthetic aortic valve, yet mid-term clinical and haemodynamic outcomes of this valve remain limited with prior analyses including smaller patient numbers [9–11]. In a nine-year follow-up of the PMEAV valve, we found excellent patient survival, very good haemodynamic performance and low rate of reoperation with this prosthesis.
To our knowledge, the current study is the largest single-institution series of specifically the PMEAV 3300 TFX valve, having excluded patients with the Perimount and Magna aortic valves, with over 5261 patient follow-up years. The key finding of this study was that patients who received the PMEAV valve had excellent mid-term survival and freedom from reoperation. The overall 5-year and 9-year survival was 86.1% and 78.2%, respectively, with 91.2% and 84.1% for isolated AVR, respectively. Freedom from aortic valve reintervention in this series was 97.6% at nine years. These outcomes demonstrate an excellent safety profile of the prosthesis, and compare favourably with previous series of Magna implants [4, 5] as well as other aortic bioprosthetic valves [12–14]. In an analysis of 850 PMEAV valves sized 19–23 mm, survival at 5 years was reported at 82.7% [15]. In a recent, single-institutional retrospective review of 1953 patients with the Trifecta bioprosthetic valve (St. Jude Medical, St. Paul, MN), 5-year overall and isolated AVR survival were shown to be 70% and 78%, respectively, with freedom from reoperation at 1 and 5 years at 99% and 96%, respectively [12]. Use of the Mitroflow aortic valve (SORIN S.p.A., Milano, Italy) demonstrated a 5-year survival of 76.6% [13], and a study of 797 Mosaic valve (Medtronic, Minneapolis, MN) AVRs reported a 10-year survival of 63.2% and 88% freedom from reoperation at a 17-year follow-up [14].
In-hospital and thirty-day outcomes in the present cohort are similar to other studies of both the PMEAV and other valves. We noted a 30-day mortality of 3.3% overall and 1.0% for the isolated AVR group. This is similar to prior studies evaluating the PMEAV [16]. Implantation of the Trifecta valve has been reported to be associated with 5.1% overall and 1.4% isolated AVR mortality [12]. The rate of postoperative atrial fibrillation and pacemaker placement, noted in Table 3, may also be lower than reported with the Trifecta valve [12].
Overall mTPG remained low even at an 8-year follow-up (13.7 ± 8.2 mmHg) compared to 11.5 ± 6.1 mmHg at a 3-month follow-up. These gradients are slightly higher than those reported for the Trifecta valve, which is consistent with prior studies [11, 12]. However, some data suggest that these differences do not persist past one year [11, 17]. A meta-analysis of haemodynamic performance of the PMEAV and Trifecta valves [18] concluded that gradients were lower in the Trifecta group; however, this included both the Magna and Magna Ease valves and only a subset of studies included haemodynamic data beyond one year. Thus, both valves appear to have acceptable gradients in the mid-term periods. The current study adds further haemodynamic data on the Magna Ease valve, not previously available in this large sample size. Differences in gradients between valves may be due to construction techniques, type and flexibility of stents and leaflet design. Gradient is also a product of the effective orifice area (EOA), but EOA is variable between valve types and sizes. Optimal valve sizing remains a challenge, as surgeons have few data to guide selection and sizing, often having to rely on tables published by manufacturers. With no industry or society guidelines to standardize the creation or use of these charts, data suggest that the manufacturer-provided charts are often inaccurate [19]. One analysis comparing the Perimount Magna EOA-Index chart to postoperative echocardiograms noted that the EOA-Index chart was only 35% sensitive in predicting postoperative PPM [20].
While mTPG compares well to other valves, the rate of SVD is higher than published data for the PMEAV valve. In the retrospective review of 850 PMEAV valves, SVD events were reported at a rate 1.1% at a mean of 3.7 years [15], yet systematic echocardiogram data were not reported for the entire cohort. In 20-year outcome data for the 2659 patients with the Perimount Valve, SVD rate was reported at 0.85% per valve-year [4]. In that study, SVD was defined strictly by echocardiographic criteria of TPG > 40 mmHg and severe aortic regurgitation, which differs from the current and more conservative definitions of SVD [8]. While a significant proportion of patients in our cohort did meet the current criteria for SVD, this did not correspond to a clinical difference or increased rate of reoperations occurring due to SVD. The rate of reoperation for SVD in this series (0.3%) is similar to the rate noted in the PMEAV group (0.0%) in a recent comparison of PMEAV to Trifecta valves [9]. In that study, the Trifecta valve had a reoperation for SVD rate of 1.2% at five years and 3.3% at 7 years. Kilic and colleauges [12] reported reoperation for SVD for the Trifecta valve to be 1% at 5 years. In both studies [9, 12], the Trifecta valve appears to have a significantly higher rate of reoperation for SVD than the PMEAV valve. Possible reasons why we note a higher rate of SVD than previous studies may be due to longer echocardiographic follow-up and the updated definition of SVD.
An understanding of the properties and limitations of each available bioprosthesis and technique is important given the increasing complexity in treatment of aortic valve diseases. Each prosthesis has intrinsic features that are important to consider when deciding to replace a valve. This study adds further support to the use of the PMEAV by further quantifying the mid-term freedom from mortality and reintervention particularly with echocardiographic follow-up on a large cohort. These data are congruent with a recent comparison of the Perimount and Trifecta valves, where a higher rate of deterioration was observed in patients who received the Trifecta prosthesis. While the implication on clinical practice from this single-centre retrospective study is limited, when taken in context with other available data, the excellent mid-term freedom from mortality and reintervention, as well as low mTPG, supports the use of this valve in clinical practice.
Limitations
Limitations of this study include the single-centre and retrospective design of the study, thus limiting the generalizability of these data. The lack of a standardized protocol for echocardiogram data meant that echocardiograms were grouped into time periods. Having standardized yearly follow-up of all valve patients by TTE would be optimal to assess the evolution of haemodynamic properties of the PMEAV prosthesis, but such a protocol would be costly to the healthcare system. Thus, unless symptomatic or for other reasons, patients did not routinely receive an echocardiogram aside from the initial postoperative study. Therefore, the available echocardiographic data may overestimate the mTPG in the follow-up population. Frequently, echocardiogram data were recorded without sufficient quantitative data including peak velocities and gradients to calculate SVD. Furthermore, while most TTEs were performed at labs accredited in echocardiography by the Intersocietal Accreditation Commission, a minority of studies particularly from early in study period were performed by labs outside this hospital system without accreditation. Additionally, while this hospital system is the major referral centre for cardiac surgery in our geographic area, it is possible that follow-up in other centres occurred, thus limiting the completeness of these data.
Further directions
Given the large proportion of patients who developed SVD as defined by VARC-28 definitions in the early postoperative period, further investigation should address patient-specific risk factors for development of SVD in the PMEAV. Standardized data, free from industry influence, on valve EOA and PPM are not available [19, 20]. Such data may help prevent early PPM and future studies should investigate this.
CONCLUSION
The current study represents the largest single-institution series of AVRs with the Magna Ease valve with longest echocardiographic follow-up. Mid-term freedom from mortality and valve reintervention was excellent supporting the common selection of this valve in surgical AVR. Further study specifically focusing on long-term haemodynamic outcomes of this specific valve should be undertaken to assess the frequency and significance of SVD.
ACKNOWLEDGEMENTS
Statistical support was provided by the Frederik Meijer Heart and Vascular Institute.
Reviewer information
Interactive CardioVascular and Thoracic Surgery thanks Yasunori Iida, Parwis B. Rahmanian and the other, anonymous reviewer(s) for their contribution to the peer review process of this article.
Presented at the 34th Annual Meeting of the European Association for Cardio-Thoracic Surgery, Barcelona, Spain, 8-10 October 2020.
