


Abstract

Recent mortality studies showed worse prognosis in patients (ARNS) with severe aortic regurgitation and preserved ejection fraction (EF) not fulfilling the criteria of current guidelines for surgery. The aim of our study was to analyse left ventricular (LV) systolic and diastolic function and mechanical energetics to find haemodynamic explanations for the reduced prognosis of these patients and to seek a new concept for surgery.
Global longitudinal strain (GLS) and echo-based single-beat pressure–volume analyses were performed in patients with ARNS (LV end-diastolic diameter <70 mm, EF >50%, GLS > −19% n = 41), with indication for surgery (ARS; n = 19) and in mild hypertensive controls (C; n = 20). Additionally, end-systolic elastance (LV contractility), stroke work and total energy (pressure–volume area) were calculated.
ARNS demonstrated significantly depressed LV contractility versus C: end-systolic elastance (1.58 ± 0.7 vs 2.54 ± 0.8 mmHg/ml; P < 0.001), despite identical EF (EF: 59 ± 6% vs 59 ± 7%). Accordingly, GLS was decreased [−15.7 ± 2.7% (n = 31) vs −21.2 ± 2.4%; P < 0.001], end-diastolic volume (236 ± 90 vs 136 ± 30 ml; P < 0.001) and diastolic operant stiffness were markedly enlarged, as were pressure–volume area and stroke work, indicating waste of energy. The correlation of GLS versus end-systolic elastance was good (r = −0.66; P < 0.001). ARNS and ARS patients demonstrated similar haemodynamic disorders, whereas only GLS was worse in ARS.
ARNS patients almost matched the ARS patients in their haemodynamic and energetic deterioration, thereby explaining poor prognosis reported in literature. GLS has been shown to be a reliable surrogate for LV contractility, possibly overestimating contractility due to exhausted preload reserve in aortic regurgitation patients. GLS may outperform conventional echo parameters to predict more precisely the timing of surgery.
INTRODUCTION
According to the European Heart survey [1], aortic valve regurgitation (AR) is the third most common valvular heart disease in Europe. Current guidelines recommend aortic valve replacement or reconstruction in patients with severe AR and subnormal ejection fraction (EF <50%; class IA) [2, 3], in patients with preserved EF but symptoms of heart failure New York Heart Association (NYHA) II–IV (class IA) [2, 3], or in patients with normal EF (EF >50%) but without symptoms if left ventricular (LV) size is markedly abnormal [LV end-diastolic diameter (LVEDD) >70 mm, LV end-systolic diameter (LVESD) >50 mm, class IIA] [2, 3]. These patients have limited spontaneous and postoperative outcomes [4–6]. Recent studies reported that many patients with severe AR without class IIA criteria displayed abnormal systolic function despite preserved EF at rest. In these cohorts, reduced global longitudinal strain value (>−19%) [7] or decreased contractility reserve during exercise [8] correlated significantly with prognosis. These results suggest that the recommendations of the current guidelines may be too restrictive, that outcomes could be improved if surgery is performed earlier, and that a better understanding of the disturbed LV haemodynamics is urgently needed as well.
The present study aimed to analyse echo-derived single-beat pressure–volume (PV) measurements including end-systolic elastance (Ees), diastolic operant stiffness, myocardial energetics and strain/strain rate, as advanced modalities for detection of disturbed LV function in patients with severe AR, but without any class IIA criteria (ARNS patients). ARNS patients were compared against patients with severe AR and indication for surgery due to symptoms (NYHA II–IV) or reduced EF (<50%) (ARS patients) and mildly hypertensive controls (C). We hypothesized that ARNS patients would have reduced LV contractility, disturbed diastolic function and waste of stroke work (SW) which may explain the limited prognosis of these patients reported in the literature [6–9].
METHODS
Patients
Forty-one patients with severe AR without indication for surgery (ARNS); normal EF, moderately abnormal LV size (LVEDD <70 mm, LVESD <50 mm), but also without symptoms of heart failure, and 19 patients with severe AR with indication for surgery (ARS; EF <50%, or symptoms of heart failure), were retrospectively analysed. The studied patients were investigated between 2016 and 2019 in our echo-lab. Patients with a combined aortic vitium having even mild stenosis were excluded. Twenty age- and gender-matched individuals with mild hypertension served as controls (C) having similar load conditions compared to AR patients. Severe AR was classified echocardiographically according to the guidelines of the European Society of Cardiology and the American Society of Echocardiography [2, 10], including vena contracta >7 mm, left ventricular outflow tract-jet >65% and regurgitant volume >60 ml. The study was approved by the institutional medical ethics committee of the University of Lübeck, Germany (No. 16-011).
Echocardiographic pressure–volume loop reconstruction in volunteers
PV loops were constructed using echocardiography for deriving volume indices and arm-cuff blood pressure (BP) measurements to estimate LV pressures. Transthoracic echocardiography was performed on a Vivid E9 ultrasound system (General Electric, Frankfurt, Germany). Non-invasive BP measurements by arm-cuff were conducted simultaneously to echocardiographic recordings of the LV outflow tract velocity time integral (VTI) signal at rest. BP measurements were used to construct PV loops. The investigation included regular 2-dimensional echocardiography and Doppler imaging for assessing LV volume and LV dimensions (LVEDD and LVESD) according to the guidelines of the ASE. LV EF, stroke volume (SV), end-systolic volume (ESV) and end-diastolic volume (EDV) were measured according to Simpson in the 4- and 2-chamber view. Cardiac output was calculated: (cardiac output) = HR × SV. The ventricular pre-ejection time and systolic period were measured by assessing the time between the R-wave of electrocardiogram at the beginning as well as at the end of the pulsed-waved Doppler left ventricular outflow tract-VTI signal. Global longitudinal strain (GLS) and strain rate were obtained from baseline transthoracic echocardiography grey-scale images of apical 2-, 3- and 4-chamber views with a rate of 50–70 frames/s. The LV-GLS and strain rate were analysed offline using Echopac software (General Electric, Frankfurt, Germany). Strain analysis could only be performed in a subgroup of patients (Controls: n = 20; ARNS: n = 31; ARS: n = 15).
Echocardiographically derived single-beat pressure–volume analysis
Afterload parameters
Effective arterial elastance (Ea) is a measure of both arterial mean and pulsatile load [11]. Ea is calculated as follows: Ea = end-systolic pressure/SV (Fig. 1) but is falsely reduced in patients with AR due to marked SVs with high regurgitation volume. LV end-systolic wall stress was calculated according to [12] using the formula = end-systolic pressure × (1 + ESV/Vw), where Vw is the volume of LV wall.
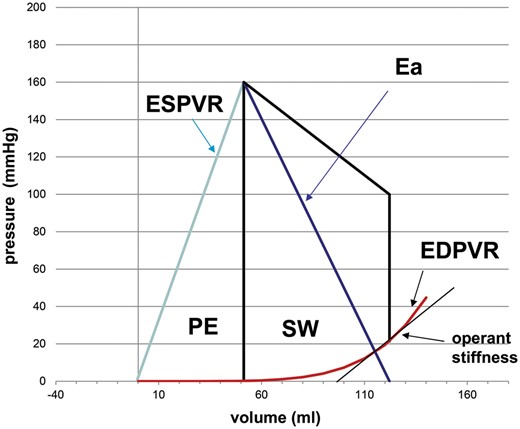
Representative echo-based single-beat PV loop of 1 LV cycle. Ea: effective arterial elastance; EDPVR: end–diastolic pressure–volume relationship; ESPVR: end-systolic pressure–volume relationship; Operant stiffness: tangent to EDPVR at LVEDP; LV: left ventricular; PE: potential energy (triangle area between ESPVR and PV loop); PV: pressure–volume; SW: stroke work.
Systolic parameters
The single-beat end-systolic pressure–volume relationship (ESPVR) and its slope (Ees) can be derived by single-beat echocardiography analysis.
ESPVR: Pes= Ees × ESV + Yo
Pes = end-systolic pressure
ESV= end-systolic volume
Yo = Intersection of ESPVR with pressure axis
According to Chen et al. [13], single-beat Ees can be assessed by a complex algorithm containing systolic and diastolic BP, SV, EF and pre-ejection and total systolic ejection time intervals from LV outflow pulsed-wave Doppler (Fig. 1).
Diastolic parameters
Diastolic parameters could only be analysed in controls and a subgroup of ARNS (n = 18). The single-beat end-diastolic pressure relationship can be estimated by the method of Klotz et al. [14] using the EDV and pressure [LV end-diastolic pressure (LVEDP)]. LVEDP was calculated using the LV filling index E/E′
LVEDP = 11.96 + 0.596 × E/E′ [15]
EDPVR: Ped = α × EDVβ
Ped = end-diastolic pressure
β = stiffness constant
EDV = end-diastolic volume
α = curve fit constant
LV capacitance describes the EDV at predefined EDP. 30 mmHg is arbitrarily used in our study to assess V30 (LV capacitance at 30 mmHg) [16]. It increases with a rightward shift of end-diastolic pressure–volume relationship (EDPVR) and decreases with a leftward shift of EDPVR. The stiffness constant β describes the steepness of EDPVR independent of leftward or rightward shifts [17].
The operant stiffness of LVEDP and corresponding volume point of the EDPVR are geometrically characterized by the tangent to that point of the curve (Fig. 1). The slope of this tangent can be calculated by the first derivative of the EDPVR.
Diastolic operant stiffness: d(Ped)/d(EDV)= α × β × EDV (β − 1)
Energetics
LV stroke energy (SW) or kinetic energy consists of the complete area surrounded by the LV PV loop, while potential energy can be calculated by the triangle bordered by ESPVR, volume axis and LV PV loop. Total pressure volume area (PVA) represents both potential energy and SW and correlates well with myocardial oxygen consumption.
Statistical analysis
Measurements were performed in all groups (ARNS, ARS and C). Continuous variables are presented as mean ± standard deviation. Before starting the statistical analysis, a Kolmogorov–Smirnov test for checking normal distribution of the samples was performed. Changes in haemodynamic parameters in individual patients were analysed with a one-way ANOVA test and a Tukey post hoc test if groups show normal distribution. Otherwise, a Kruskal–Wallis test and Dunn’s multiple comparison test was used. To compare diastolic parameters and filling pressures in controls and patients with severe AR without indication for surgery, a Mann–Whitney test was performed or a two-tailed Student’s t-test, if the data were normally distributed. Box plots were used to show the single data of all groups. Pearson correlation was calculated in normally distributed parameters of patients with ARNS. Binary distributed variables of baseline characteristics of different groups were compared using Fisher’s exact test. P-values <0.05 were considered to reflect statistically significant differences. Statistical analysis was performed by GraphPad Prism 8.1.2.
A formal power analysis for sample size calculation could not be performed a priori due to a lack of comparative data on strain and Ees in patients with ARNS. However, based on findings in patients with severe AR presenting with reduced contractility (Ees 0.62 ± 0.23 mmHg/ml [18]), versus preserved contractility (Ees 2.15 ± 1.5 mmHg/ml [18]), 10 patients per group would have been sufficient to show a significant difference (P < 0.05) in Ees with a power of 80%.
RESULTS
Basic characteristics of patients with severe AR without indication for surgery (ARNS), patients with severe AR with indication for surgery (ARS) and hypertensive controls (C) are summarized in Tables 1 and 2. The groups did not differ with respect to age, gender, rhythm and comorbidities. About 40% of ARNS and ARS patients had a bicuspid valve.
Clinical characteristics of the studied groups of patients
| Control (n = 20) | P-value C versus ARNS | ARNS (n = 41) | ARS (n = 19) | P-value C versus ARS | |
|---|---|---|---|---|---|
| n (%) | n (%) | n (%) | |||
| Males | 17 (85) | 0.48 | 33 (79) | 16 (88) | >0.99 |
| Hypertension | 13 (65) | 0.59 | 24 (57) | 12 (66) | >0.99 |
| AF | 2 (10) | 0.99 | 6 (14) | 1 (5.6) | >0.99 |
| Bicuspid valve | 0 (0) | 0.002 | 18 (43) | 8 (44.4) | 0.001 |
| Diabetes type II | 1 (5) | 0.33 | 0 (0) | 2 (11.1) | 0.61 |
| Relevant CAD | 0 (0) | >0.99 | 0 (0) | 0 (0) | >0.99 |
| Drugs | |||||
| ß- blocker | 8 (40) | 0.78 | 19 (45) | 7 (39) | >0.99 |
| ACE-inhibitor | 5 (25) | 0.10 | 21 (50) | 14 (78) | 0.004 |
| Coumarin | 2 (10) | 0.59 | 2 (5) | 0 (0) | 0.49 |
| NOAK | 1 (5) | >0.99 | 3 (7) | 2 (11) | 0.61 |
| Diuretics | 4 (20) | >0.99 | 10 (24) | 9 (50) | 0.10 |
| Insulin | 0 (0) | >0.99 | 0 (0) | 1 (6) | 0.50 |
| Metformin | 0 (0) | >0.99 | 0 (0) | 1 (6) | 0.50 |
| Ca2+-blocker | 1 (5) | 0.65 | 5 (12) | 2 (11) | 0.61 |
| Aspirin | 2 (10) | >0.99 | 5 (12) | 5 (28) | 0.24 |
| Statins | 2 (10) | 0.48 | 8 (19) | 3 (17) | 0.66 |
P-values of ARNS versus control group (C); P-values of ARS versus control group (C); there were no statistical differences between ARNS and ARS group.
ACE: angiotensin-converting enzyme; AF: atrial fibrillation; CAD: coronary artery disease.
Basic haemodynamic and mechanic energy data of the studied groups of patients
| Control (n = 20) | ARNS (n = 41) | ARS (n = 19) | P-value | |
|---|---|---|---|---|
| Mean ± SD | Mean ± SD | Mean ± SD | ||
| Age (years) | 57 ± 15 | 58 ± 15 | 57 ± 16 | 0.58 |
| BMI (kg/m2) | 26.8 ± 5.6 | 25.6 ± 4.1 | 27.4 ± 4.8 | 0.55 |
| HR (bpm) | 76 ± 14 | 71 ± 11 | 77 ± 15 | 0.18 |
| Syst. BP (mmHg) | 137 ± 25 | 140 ± 21 | 135 ± 18 | 0.79 |
| Diast. BP (mmHg) | 81 ± 15 | 72 ± 9 | 72 ± 11 | 0.001 |
| SW (mmHg × ml) | 7720 ± 2352 | 12 910 ± 5644 | 12 064 ± 5958 | 0.0001 |
| Epot (mmHg × ml) | 3597 ± 1012 | 7118 ± 5401 | 6661 ± 3547 | 0.0001 |
| PVA (mmHg × ml) | 11 254 ± 3045 | 19 950 ± 10 031 | 18 593 ± 8281 | 0.001 |
| EF (%) | 59 ± 6 | 59 ± 7 | 53 ± 11 | 0.01 |
| Ees (mmHg/ml) | 2.54 ± 0.81 | 1.58 ± 0.69 | 1.45 ± 0.68 | <0.0001 |
| GLS (%) | −21.2 ± 2.4 | −15.7 ± 2.7 | −12.4 ± 3.4 | <0.0001 |
| LVESDi (cm/m2) | 1.72 ± 0.3 | 2.04 ± 0.25 | 2.31 ± 0.42 | <0.0001 |
| LV-mass (g) | 167 ± 44 | 290 ± 87 | 372 ± 168 | <0.0001 |
P-values describe the result of the one-way ANOVA test.
BMI: body mass index; BP: blood pressure; Ees: end-systolic elastance; EF: ejection fraction; GLS: global longitudinal strain; HR: heart rate; LVESD: left ventricular end-systolic diameter; PVA: pressure–volume area; SD: standard deviation; SW: stroke work.
The key haemodynamics of ARNS patients, ARS patients and controls are listed in Table 2, and Figs 2 and 3. Systolic BP (Table 2) as well as end-systolic wall stress (Fig. 2A) did not differ between groups, while Ea was significantly reduced in both AR groups (Fig. 2H). EF showed normal values in ARNS patients and controls (Fig. 2B), and was slightly reduced but preserved in ARS group. Interestingly, LV contractility was significantly reduced in ARNS and ARS patients compared to controls due to a rightward shift of ESPVR expressed by a lower Ees (Fig. 2C). In contrast, SV, potential energy, SW and total PVA were significantly elevated in ARNS and ARS patients almost twice that of controls (Fig. 2D–G, Table 2). ARNS and ARS patients showed markedly enlarged hearts as indicated by higher LV mass, LVEDD and EDV, which differed markedly from controls (Table 2, Fig. 3A and B). Interestingly, changes in LV ventricular haemodynamics and energetics correlate closely and did not differ significantly between ARNS and ARS patients, except for the values of EF, LVEDD and GLS (Figs 2B, 3A and 5B). In particular, Ees (1.58 ± 0.8 and 1.45 mmHg/ml ±0.7, ns) was similar in both AR groups, while GLS (−15.7 ± 2.7% and −12.4 ± 3.4%, P < 0.05) was more restricted in ARS patients.
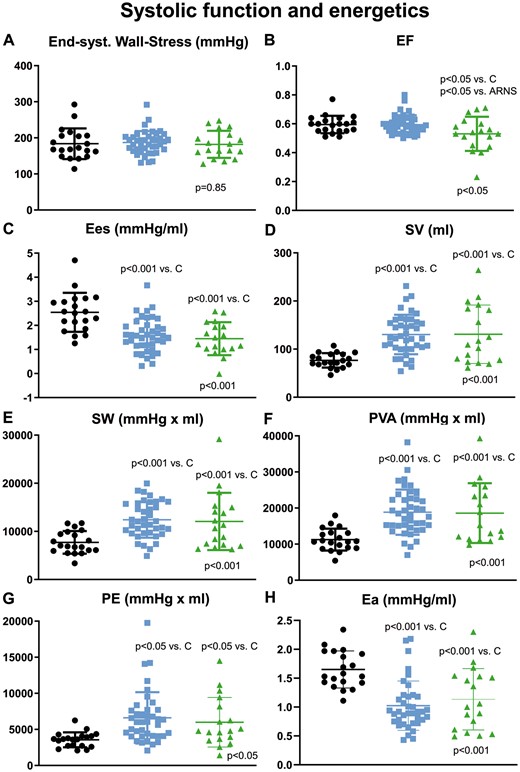
Comparison of (A) end-systolic wall stress; (B) EF; (C) Ees; (D) SV; (E) SW; (F) PVA; (G) PE and (H) Ea in controls (black), ARNS (blue) and ARS (green); P-value on the x-axis represents one-way ANOVA test; significant P-values of post hoc test are indicated above the box plots. ARNS: patients with high-grade AR without indication for surgery; ARS: patients with high-grade AR with indication for surgery; Ea: effective arterial elastance; EF: ejection fraction; Ees: end-systolic elastance; PE: potential energy; PVA: pressure–volume area; SV: stroke volume; SW: stroke work.
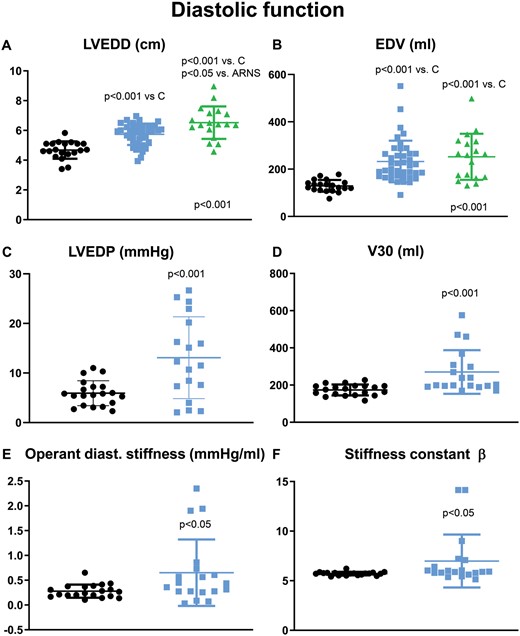
Comparison of (A) LVEDD; (B) EDV in controls (black); ARNS (blue) and ARS (green); Comparison of (C) LVEDP; (D) V30; (E) operant stiffness and (F) stiffness constant β in controls (black, n = 20) and ARNS (blue; n = 18) . For P-values of (A) and (B) see Fig. 2. ARNS: patients with high-grade AR without indication for surgery; ARS: patients with high-grade AR with indication for surgery; EDV: end-diastolic volume; LVEDD: left ventricular end-diastolic diameter; LVEDP: left ventricular end-diastolic pressure.
LV filling pressure was significantly higher in ARNS patients compared to controls (Fig. 3C). Accordingly, LV capacitance V30 was significantly higher in ARNS patients compared to controls indicating rightward shift of EDPVR (Fig. 3D). The stiffness constant β, indicating the steepness of EDPVR as well as operant diastolic stiffness of ARNS hearts were significantly elevated compared to controls (Fig. 3E and F); LV wall stress did not differ between all groups: LV eccentric or volume-overload type of remodelling of patients with AR was compensated by increased LV mass, thereby normalizing LV wall stress.
More detailed analysis of the ARNS patients revealed that there was no correlation between LVEF and LV size (LVEDD, Fig. 4A). Increased LV size was associated with decreased myocardial contractility, as Ees and GLS deteriorated as LVEDD increased (Fig. 4B and C). The correlation between indexed LVESD and GLS was r = 0.44, P = 0.04. EF and Ees lacked any correlation (Fig. 4F) in ARNS patients. SV and PVA significantly increased with enlargement of the heart (Fig. 4D and E), possibly indicating the contribution of LV remodelling and intensive use of the Frank-Starling mechanism. To visually compare the location of the scatter plot of ARNS patients with that of the control group, the mean value of the latter is inserted as a black line in the ARNS correlation diagrams (Fig. 4). When comparing this line with the data points of the ARNS group, it becomes obvious that almost all patients of this group have lower Ees and higher GLS values than the mean of the control group. Similar results were obtained for PVA and SV values.
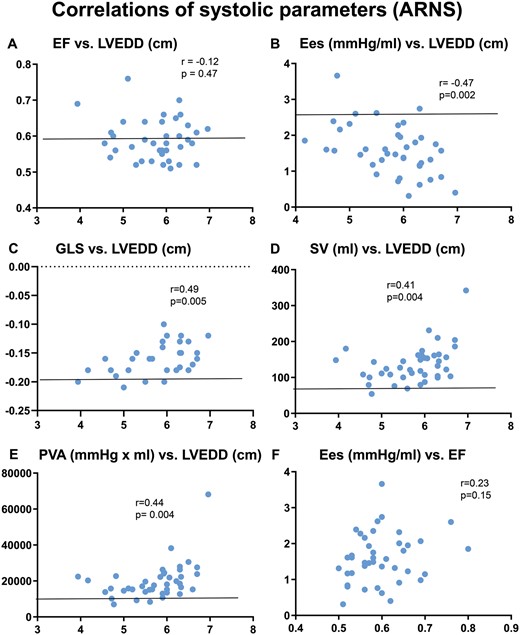
Correlation of (A) EF versus LVEDD; (B) Ees versus LVEDD; (C) GLS versus LVEDD; (D) SV versus LVEDD; (E) PVA versus LVEDD and (F) Ees versus EF. The black line represents the mean value of y-axis of controls. Ees: end-systolic elastance; EF: ejection fraction; LVEDD: left ventricular end-diastolic diameter.
Figure 5A demonstrates 2 typical strain bull’s eye views for a control and an ARNS patient. In accordance with other indicators of contractility, GLS and strain rate were also significantly reduced in ARNS and ARS patients compared to controls (Fig. 5B and C). GLS of ARS patients was significantly higher restricted than in ARNS patients. GLS and strain rate versus Ees showed a negative correlation with identical correlation coefficients and P-values in the ARNS cohort (Fig. 5D and E).
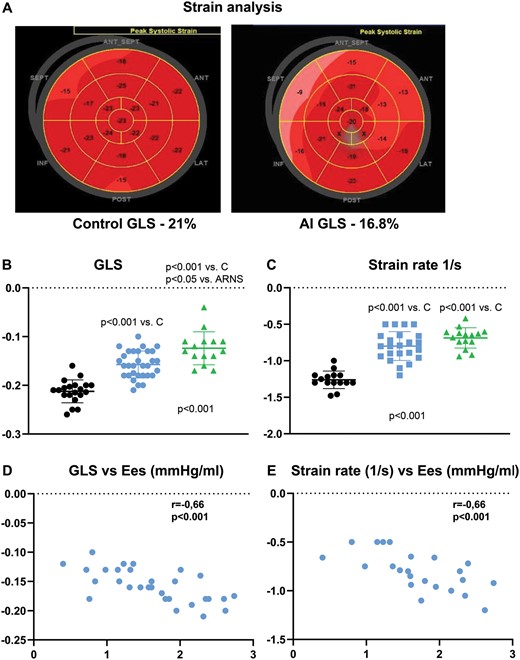
(A) Representative strain bull’s eye of a control (left side) and of an ARNS patient (right side); (B) comparison of GLS and (C) strain rate in controls (black, n = 20), ARNS (blue, n = 31) and ARS (green, n = 15); correlation of GLS (D) and strain rate (E) versus Ees in ARNS patients. For P-values of (B) and (C) see Fig. 2. ARNS: patients with high-grade AR without indication for surgery; ARS: patients with high-grade AR with indication for surgery; Ees: end-systolic elastance; GLS: global longitudinal strain.
DISCUSSION
The present study shows that ARNS patients who do not meet the class IIA criteria despite normal EF suffer from impaired LV systolic function in combination with diastolic dysfunction and abnormally increased mechanical energy. These severe haemodynamic disorders of the ARNS group almost matched those of the ARS group. The pathological results of the ARNS group presumably show the haemodynamic background of the corresponding patients in whom a strikingly poor prognosis was reported in the literature [7–9, 19].
In detail, LV contractility was markedly reduced in ARNS patients indicated by the lower Ees as well as suppressed GLS and strain rate compared to controls, although LVEF showed clearly normal values in both groups (Fig. 2). SV, mechanical energy and the other assessed haemodynamic values almost doubled in ARNS and ARS patients (Figs 2 and 3), and differed markedly from hypertensive controls. ARNS and ARS patients showed an almost identical increase in LV dimensions, significantly elevated total mechanical SW and similar Ees values, while only GLS and EF were worse in ARS patients. These results suggest that both cohorts present with an almost identical degree of severe myocardial dysfunction, which does not fit the clear separation of both groups in the current guidelines.
Notably, moderate correlations between reduced LV contractility and increasing LV size, concomitant increase in SV and total SW (PVA) were observed in ARNS patients, but no correlation to LVEF. These results may indicate that chamber enlargement (remodelling) and activation of the Frank-Starling reserve masks and compensates the reduced myocardial inotropy of ARNS patients. LVEF that is influenced by preload and afterload [20] showed no correlation to LV contractility markers, especially in ARNS patients (see Fig. 4F), and remained even preserved in the ARS group (53%). Consequently, EF may be regarded as a poor prognostic marker in these patients because of its insensitivity to changes in Ees, SV, energy and LV size. Longitudinal strain (GLS) and strain rate are also affected by preload [21] and afterload [22], but revealed a much better correlation than EF with contractility (Ees, r = 0.71) [23], strongly confirming our results in ARNS patients (r = 0.66). Longitudinal strain and strain rate are generally accepted as prognostically significant [24].
Our results demonstrate a good correlation between the preload-independent contractility marker Ees and both GLS and strain rate, and seem equally representative for contractility in the studied AR patients. Nevertheless, AR patients have special loading conditions. Controls and ARNS patients showed similar heart rate and afterload which can be approximated by peak-systolic aortic pressure as well as end-systolic wall stress [12]. Ea does not reliably represent total afterload in patients with severe AR because it underestimates afterload due to the aortic valve leakage [25]. However, the preload expressed by EDV and LVEDP is maximally increased due to the high regurgitation volume in ARNS patients who completely lose their preload reserve with higher LVEDV, as indicated by the steep operant stiffness compared to controls. In this case, GLS values of ARNS patients reflect both contractility and maximal use of the preload reserve. This has 2 consequences for measuring strain in patients with severe AR: First, if preload reserve is completely exhausted, even a slight reduction of GLS beyond a range of −19% indicates clear reduction of contractility correlating well with preload-independent Ees. Second, if the preload reserve has completely contributed to the compensation of the GLS, the measured values of the GLS are likely overestimating true myocardial contractility; in other words, higher contractility values than that actually exist. The compensation of preload reserve on GLS in patients with severe AR can roughly be calculated from the reduction of radial strain of about 9% after aortic valve replacement and cessation of regurgitation [26]. Contractility overestimated by GLS could at least additionally explain the limited prognosis of ARNS patients. Due to the influence of the preload reserve in patients with severe AR, even slight deviations of measured GLS values from the ‘normal’ value (about −19%, [27]) can already be regarded as a serious disturbance in contractility and may be used as ‘threshold’ for surgery.
Diastolic function of ARNS patients revealed increased LV capacitance (V30; Fig. 3C) with high operant diastolic stiffness (dP/dV) created by the marked steepness of EDPVR [28]. Stiffness constant β was even higher than that of patients suffering from diastolic dysfunction and heart failure with preserved ejection fraction [17], both close to the border of preload reserve at rest. The latter results may explain the limited exercise tolerance of ARNS patients and increased myocardial fibrosis detected in biopsies in patients with AR as well as in experimental studies [29]. Consequently, besides disturbed LV contractility, ARNS patients have also an advanced diastolic handicap that probably makes surgery more urgent.
Limitations
This is a retrospective, observational and unicentric study with low sample size focusing only on the haemodynamics of the 2 AR groups and mildly hypertensive controls. For the study, advanced quantitative echocardiographic parameters like GLS and strain rate were not uniformly available, and therefore explain the different numbers of the studied haemodynamic parameters in the single cohorts, especially for diastolic parameters in ARS patients.
The study used non-invasive PV analysis. All essential parameters like ESPVR and EDPVR were validated by comparing them to invasive measurements. The inherently greater variability of echo-based volume measurements is adverse compared with that of invasive assessments. Consequently, volume values of both techniques may differ in their absolute values, but nevertheless, the echo-based technique can describe or identify relevant changes. Therefore, the echo-based parameters of the PV diagram are a widely accepted and a frequently used method [11, 13, 17, 30].
CONCLUSIONS
Echo-derived single-beat PV analyses including Ees as standard measure of LV contractility, mechanical energy and echo-obtained conventional LV parameters, such as GLS, were studied in asymptomatic patients with severe AR and normal EF who do not meet class IIa criteria of current guidelines. Compared to age-matched hypertensive controls, these ARNS patients demonstrated strong depression of LV systolic and diastolic function with marked waste of energy. The severe disorders of the ARNS patients almost matched those of the ARS group, and may explain the poor prognosis reported in literature. The correlation of GLS or strain rate with Ees was better than any other LV parameter, qualifying GLS as reliable surrogate of LV contractility and prognostic tool for easy use in echo-handling. Caution should be exercised when evaluating the GLS measurements, as LV contractility may be overestimated in AR patients caused by excessive use of the Frank-Starling law. Therefore, slight deviations of the GLS values from the lower normal limit (about −19%) may be accepted as threshold for aortic valve repair, if confirmed by higher sample sizes in future controlled studies.
Conflict of interest: none declared.
Author contributions
Jan-Christian Reil: Conceptualization; Data curation; Formal analysis; Investigation; Methodology; Writing—original draft. Gert-Hinrich Reil: Conceptualization; Formal analysis; Methodology; Writing—original draft; Writing—review & editing. Nora Hecker: Data curation; Writing—review & editing. Vasco Sequeira: Writing—review & editing. Jeffrey S. Borer: Writing—review & editing. Ulrich Stierle: Writing—review & editing. Christoph Marquetand: Conceptualization; Writing—review & editing. Claudia Busch: Formal analysis; Investigation. Daniel Lavall: Writing—review & editing. Johannes Patzelt: Writing—review & editing. Matthias Heringlake: Writing—review & editing. Hans-Joachim Schäfers: Writing—review & editing. Hans-Hinrich Sievers: Writing—review & editing. Stephan Ensminger: Writing—review & editing. Anas Aboud: Conceptualization; Writing—review & editing.
Reviewer information
Interactive CardioVascular and Thoracic Surgery thanks Peter Verbrugghe and the other, anonymous reviewer(s) for their contribution to the peer-review process of this article.
REFERENCES
- AR
Aortic regurgitation
- ARNS
Patients with high-grade AR without indication for surgery
- ARS
Patients with high-grade AR with indication for surgery
- BP
Blood pressure
- Ea
Effective arterial elastance
- EDPVR
End-diastolic pressure–volume relationship
- EDV
End-diastolic volume
- Ees
End-systolic elastance
- EF
Ejection fraction
- ESPVR
End-systolic pressure–volume relationship
- ESV
End-systolic volume
- GLS
Global longitudinal strain
- LV
Left ventricle
- LVEDD
Left ventricular end-diastolic diameter
- LVEDP
Left ventricular end-diastolic pressure
- LVESD
Left ventricular end-systolic diameter
- NYHA
New York Heart Association
- PV
Pressure–volume
- PVA
Pressure–volume area
- SV
Stroke volume
Author notes
Jan-Christian Reil and Gert-Hinrich Rei contributed equally to this work.
