


Abstract
The aim was to estimate the risk of dialysis postoperative de novo dialysis in patients undergoing elective cardiac surgery, according to varying degrees of pre-existing renal dysfunction, and to compare the outcomes with the expected prevalence of dialysis based on several risk scores.
A retrospective analysis was performed over a 5-year period (2012–16) from a series of 1332 adult patients who underwent elective cardiac surgery. Patients were divided into 3 estimated creatinine clearance (eCrCl) groups: eCrCl >60 ml/min, eCrCl from 50 ml/min to 60 ml/min and eCrCl ≤49 ml/min. The primary outcome was any renal failure requiring first-time dialysis during the postoperative hospital stay. The expected risk for postoperative dialysis was calculated with 3 predictive scores: the Society of Thoracic Surgeons Bedside Risk Tool, the Cleveland Clinic Score and the Simplified Renal Index. The global accuracy of eCrCl and the different scores was evaluated in terms of calibration and discrimination.
In the overall population, 26.6% of patients presented moderate or severe pre-existing renal dysfunction, and the need for de novo dialysis varied from 0.6% to 5.0% depending on the degree of preoperative eCrCl (P < 0.0001). Preoperative renal dysfunction with eCrCl <50 ml/min was associated with nearly 8-fold increase of risk for postoperative dialysis; eCrCl between 50 ml/min and 60 ml/min showed a 2-fold increase, though this last difference did not reach statistical significance.
In elective cardiac surgery, isolated preoperative eCrCl seemed to be an accurate indicator of risk for postoperative de novo dialysis. More complex models did not provide additional information to stratify that risk.
INTRODUCTION
Postoperative kidney failure requiring de novo dialysis after cardiac surgery ranks among the most dreaded surgical complications and is associated with higher mortality, poor quality of life, and increased hospital length of stay and use of resources [1]. Nevertheless, less than 12% of patients with acute kidney injury (AKI) after cardiac surgery require dialysis [2, 3]. AKI is a complex syndrome with manifestations ranging from small increase in serum creatinine to anuric renal failure. Although minimal changes in postoperative creatinine have been associated with a significant reduction in short- and long-term survival [4, 5], the estimated probability of dialysis after cardiac surgery is a more important adverse event from the medical standpoint than other stages of renal impairment. Previous studies have demonstrated that between 0.9% and 6.7% of patients undergoing different types of cardiac surgery require postoperative dialysis [2, 3, 6–11]. Furthermore, these studies also indicate that patients requiring de novo dialysis have extremely high mortality, with 37.8–70.0% of patients dying before leaving the hospital [7, 10–12].
A few systematic reviews of pooled data identified several preoperative factors to be associated with the need for postoperative dialysis after cardiac surgery, including renal disease, high serum creatinine, older age, female gender, diabetes, EuroSCORE, type of surgery, peripheral vascular disease, lung disease, heart failure, hypertension, recent myocardial infarction, cardiogenic shock, urgent operation, New York Heart Association Class III–IV, prior cardiac surgery and use of intra-aortic balloon pump [3, 6, 7]. A set of intraoperative and postoperative variables were also identified as potential predictors of dialysis, including cardiopulmonary bypass time, need for re-exploration, intraoperative haemofiltration, low cardiac output and high transfusion requirement [3, 6].
Several risk models have been developed and validated to predict postoperative kidney failure after cardiac surgery [13]. The 3 best-known scores predicting AKI requiring dialysis are the Society of Thoracic Surgeons (STS) Bedside Risk Tool [7], the Cleveland Clinic Score [14] and the Simplified Renal Index (SRI) of Toronto [15]. Pre-existing renal dysfunction is common among patients undergoing cardiac surgery, with up to 29% of cases presenting with moderate or severe renal impairment [16], and this condition is the single most significant factor associated with the need for postoperative renal replacement therapy [7]. Although many other baseline factors have been suggested to be associated with the need for postoperative dialysis, only impaired glomerular filtration rate may be considered to show a close cause–effect relationship. Thus, we hypothesized that, compared with other more complex risk scores, isolated preoperative glomerular filtration rate may be sufficient to closely predict the need for postoperative renal replacement therapy.
Therefore, the aim of this study was to estimate the risk for postoperative de novo dialysis in patients undergoing elective cardiac surgery, according to varying degrees of pre-existing renal dysfunction, and to compare the outcomes with the expected prevalence of dialysis based on several risk scores.
MATERIALS AND METHODS
A retrospective analysis was performed of prospectively collected data (ambispective design) over a 5-year period (2012–16) from a consecutive series of 1332 adult patients who underwent elective cardiac surgery at the Buenos Aires University Hospital and its associated clinics. All types of on-pump and off-pump elective cardiac surgery were included, except procedures associated with active valve endocarditis, postinfarction ventricular septal defect or free wall rupture, ischaemic mitral regurgitation associated with acute myocardial infarction, urgent coronary surgery secondary to percutaneous coronary angioplasty complication, acute aortic dissection, transplantation and transcatheter aortic valve implantation. Baseline and operative data were prospectively collected in a clinical registry, which included the variables needed to estimate operative risk mortality based on the EuroSCORE II, the age–creatinine–ejection fraction (ACEF) score [17] and the modified ACEF (ACEFCG) model [18]. Additional information on other risk factors, comorbidities, major operative complications and in-hospital operative mortality was added in the computerized database.
Creatinine clearance was estimated with the Cockcroft–Gault equation, and patients were divided into 3 estimated creatinine clearance (eCrCl) groups: eCrCl >60 ml/min, eCrCl from 50 ml/min to 60 ml/min and eCrCl ≤49 ml/min. Categories for renal dysfunction were adopted from the EuroSCORE II classification, except for the mild/normal eGrCl lower limit (60 ml/min) that was adopted from the National Kidney Foundation guidelines. The primary outcome was defined as any postoperative renal failure requiring first-time haemofiltration or dialysis during the postoperative hospital stay. Indications for dialysis in patients with renal injury were volume overload, uraemia or biochemical abnormalities. Patients with preoperative dialysis-dependent renal failure were excluded from the analysis. Additionally, AKI was defined as eCrCl decrease >50% of baseline levels. The expected risk for postoperative dialysis was calculated with 3 different predictive scores: the STS score [7], the Cleveland score [14] and the SRI score [15]. The original STS simplified additive score based on the STS National Database includes 10 variables, the model developed at the Cleveland Clinic includes 9 variables and the SRI developed at Toronto General Hospital includes 7 variables. Different combinations of variables needed to calculate the 3 scores include serum creatinine, age, gender, race, type of surgery, diabetes, recent myocardial infarction, chronic lung disease, New York Heart Association class, redo, chronic heart failure, left ventricular ejection fraction, cardiogenic shock, emergent surgery and preoperative intra-aortic balloon pump. Risk for dialysis was calculated for each patient with each model, and data were averaged within the 3 groups stratified by eCrCl. Ratio between observed and expected (O/E) need for dialysis was calculated for each score. In addition, accuracy to predict the need for postoperative dialysis was tested with the 3 mortality risk models (EuroSCORE II, ACEF and ACEFCG).
Baseline preoperative clinical variables and in-hospital outcome data were recorded and analysed with the approval of the local Institutional Review Board, which waived the need for a written informed consent.
Statistical analysis
Continuous variables were expressed as mean and standard deviation or as median and interquartile range. The Kolmogorov–Smirnov goodness-of-fit test was used to analyse normal distributions. Univariate comparison of dichotomous variables was performed using the χ2 test and odds ratio (OR) with the associated 95% confidence interval (95% CI). Two-tailed Fisher’s exact test was used when cell expected values were below 5. Continuous variables were compared using the Student’s t-test, the Mann–Whitney U-test, the Kruskal–Wallis or the analysis of variance tests. The O/E ratio for mortality was calculated and evaluated using the χ2 test. The global accuracy of eCrCl and the different scores was evaluated in terms of calibration and discrimination. Model calibration was assessed by the Hosmer–Lemeshow goodness-of-fit test (HLχ2). Receiver operating characteristic curve analysis was used to estimate the performance of eCrCl and the risk scores to predict de novo dialysis risk. The area under the receiver operating characteristic curve (AUC) with its 95% CI was calculated, and the comparison of 2 AUCs was done with the DeLong non-parametric test (Epidat, Version 3.1; OPS-OMS). Binary logistic regression with backward stepwise conditional method was used to evaluate the independent association of variables included in the ACEFCG model with the need for dialysis. Sample size needed to estimate AKI rate was calculated with a 95% CI, an estimated ratio of 0.15 and a maximum admissible error of 0.05 (n = 196). Statistical analysis was performed with IBM SPSS Statistics, version 23.0 (IBM Corporation, Armonk, NY, USA). A 2-tailed P-value ≤0.05 was considered statistically significant.
RESULTS
Table 1 describes the baseline demographic characteristics of patients stratified by initial eCrCl. Among all patients, 14% (n = 180) had preoperative eCrCl <50 ml/min and 13% (n = 174) between 50 ml/min and 60 ml/min. Operative and postoperative clinical outcomes stratified by baseline eCrCl are described in Table 2. The need for dialysis was associated with direct renal failure (7 cases), volume overload and prolonged ventilation (4 cases), low cardiac output (3 cases), multiple organ failure, mediastinitis and major postoperative bleeding (1 case each). The rate of AKI based on eCrCl decrease >50% was 12% (95% CI 8–16%; 25 of 203 patients), whereas 8% of patients developing AKI needed dialysis.
Demographic and clinical characteristics stratified by eCrCl
| eCrCl <50 ml/min (n = 180) | eCrCl 50–60 ml/min (n = 174) | eCrCl >60 ml/min (n = 978) | P-value | |
|---|---|---|---|---|
| Age (years), median (IQR) | 75 (69–80) | 74 (69–78) | 65 (58–72) | <0.01 |
| BMI (kg/m2), median (IQR) | 25 (23–27) | 26 (24–28) | 27 (25–30) | <0.01 |
| Female gender, n (%) | 85 (47) | 65 (37) | 192 (20) | <0.01 |
| Diabetes, n (%) | 35 (19) | 38 (22) | 238 (24) | 0.32 |
| Dyslipidaemia, n (%) | 44 (24) | 57 (33) | 326 (33) | 0.06 |
| Hypertension, n (%) | 111 (62) | 93 (53) | 515 (53) | 0.08 |
| COPD, n (%) | 2 (1) | 16 (9) | 47 (5) | <0.01 |
| Vascular disease,an (%) | 4 (2) | 14 (8) | 35 (4) | 0.01 |
| Redo, n (%) | 2 (1) | 2 (1) | 16 (2) | 0.80 |
| Heart failure, n (%) | 6 (3) | 3 (2) | 8 (1) | 0.02 |
| Recent MI, n (%) | 3 (2) | 1 (0.6) | 29 (3) | 0.13 |
| Type of surgery, n (%) | ||||
| Isolated CABG | 73 (41) | 70 (40) | 567 (58) | <0.01 |
| Isolated valve | 65 (36) | 57 (33) | 236 (24) | |
| Combined and others | 42 (23) | 47 (27) | 175 (18) | |
| Off-pump CABG surgery | 26 (14) | 24 (14) | 156 (16) | 0.71 |
| Ejection fraction (%), mean (SD) | 53 ± 15 | 57 ± 12 | 57 ± 11 | <0.01 |
| EuroSCORE II, median (IQR) | 3.5 (2.6–6.0) | 2.2 (1.5–3.7) | 1.2 (0.8–1.2) | <0.01 |
| ACEF score, median (IQR) | 1.3 (1.2–1.9) | 1.3 (1.1–1.4) | 1.1 (0.9–1.3) | <0.01 |
| ACEFCG score, median (IQR) | 3.9 (3.3–4.4) | 2.2 (2.1–2.4) | 1.1 (0.9–1.3) | <0.01 |
| Serum Cr (mg/dl), mean (SD) | 2 ± 1 | 1 ± 0.3 | 1 ± 0.2 | <0.01 |
| eCrCl (ml/min), mean (SD) | 38 ± 10 | 55 ± 3 | 95 ± 38 | <0.01 |
Vascular disease includes cerebrovascular and peripheral vascular diseases.
ACEF: age, creatinine and ejection fraction score; BMI: body mass index; CABG: coronary artery bypass grafting; COPD: chronic obstructive pulmonary disease; Cr: creatinine; eCrCl: estimated creatinine clearance; IQR: interquartile range; MI: myocardial infarction; SD: standard deviation.
Operative and postoperative clinical outcomes stratified by estimated baseline creatinine clearance
| eCrCl <50 ml/min (n = 180) | eCrCl 50–60 ml/min (n = 174) | eCrCl >60 ml/min (n = 978) | P-value | |
|---|---|---|---|---|
| Cross-clamping time (min), median (IQR) | 40 (30–50) | 40 (30–50) | 35 (30–45) | <0.01 |
| Re-exploration for bleeding, n (%) | 6 (3) | 2 (1) | 14 (1) | 0.16 |
| Low cardiac output, n (%) | 5 (3) | 6 (3) | 19 (2) | 0.41 |
| Stroke, n (%) | 3 (2) | 0 (0) | 10 (1) | 0.27 |
| Ventilation >48 h, n (%) | 8 (4) | 3 (2) | 16 (2) | 0.05 |
| Postoperative MI,an (%) | 0 (0) | 1 (1) | 7 (1) | 0.62 |
| Mediastinitis, n (%) | 1 (1) | 1 (1) | 18 (2) | 0.24 |
Calculated on the number of isolated coronary bypass surgeries in Table 1.
eCrCl: estimated creatinine clearance; IQR: interquartile range; MI: myocardial infarction.
The risk of de novo dialysis after elective cardiac surgery for the total population was 1.3% (n = 17). Among the patients undergoing on-pump CABG surgery, 1.2% (n = 6) required postoperative dialysis versus 0.5% (n = 1) of off-pump CABG procedures (P = 0.68). The incidence of dialysis based on the degree of pre-existing kidney dysfunction in patients undergoing cardiac surgery is shown in Fig. 1. The risk for dialysis significantly increased from normal to severely impaired renal function (χ2 for trend = 17, P < 0.01). Patients with preoperative eCrCl <50ml/min had nearly 8 times higher chance of requiring the denovo dialysis compared to patients with normal eCrCl values (OR 8, 95% CI 3–24; P < 0.0001), whereas in the case of eCrCl between 50 ml/min and 60 ml/min, the same chance increased about 2 times (OR 2, 95% CI 0.4–9.4; P = 0.35). Comparison between observed and predicted risk of de novo dialysis according to the STS, the Cleveland and the SRI scores stratified by preoperative eCrCl is shown in Table 3. Although the performances were not statistically different, the STS and the Cleveland models showed an optimal (O/E ratio 1.0) or near optimal (O/E ratio 1.2) performance in patients with eCrCl >50 ml/min, whereas the STS score tended to slightly overestimate and the Cleveland score to mildly underestimate risk of dialysis in patients with eCrCl <50 ml/min.
Comparison between observed and predicted risk of de novo dialysis according to the STS, the Cleveland and the SRI scores, stratified by estimated preoperative creatinine clearance
| eCrCl <50 ml/min (n = 180) | eCrCl 50–60 ml/min (n = 174) | eCrCl >60 ml/min (n = 978) | |
|---|---|---|---|
| Observed risk for dialysis (%) | 5.0 | 1.1 | 0.6 |
| The STS score (%) | |||
| Expected risk, mean (SD) | 6.7 (2) | 1.1 (1) | 0.5 (0.4) |
| Observed/expected ratio | 0.7 | 1.0 | 1.2 |
| P-value | 0.50 | 1.00 | 0.76 |
| The Cleveland Clinic Score (%) | |||
| Expected risk, mean (SD) | 2.9 (4) | 1.1 (1) | 0.6 (0.5) |
| Observed/expected ratio | 1.7 | 1.0 | 1.0 |
| P-value | 0.60 | 1.00 | 1.00 |
| The SRI score (%) | |||
| Expected risk, mean (SD) | 3.8 (3) | 2.9 (2) | 1.0 (1) |
| Observed/expected ratio | 1.3 | 0.4 | 0.6 |
| P-value | 0.61 | 0.45 | 0.45 |
P-values were calculated by comparing paired observed versus expected risks according to each model.
eCrCl: estimated creatinine clearance; SD: standard deviation; SRI: Simplified Renal Index of Toronto; STS: Society of Thoracic Surgeons Bedside Risk Tool.
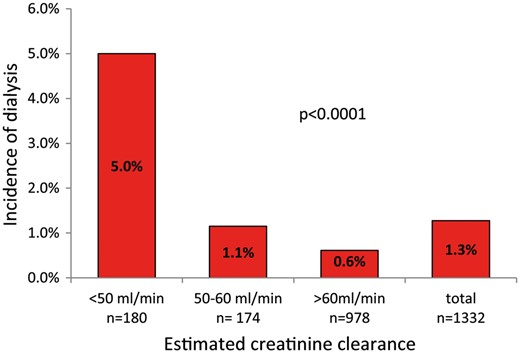
Incidence of de novo dialysis based on the degree of pre-existing kidney dysfunction in patients undergoing cardiac surgery.
Preoperative values of eCrCl showed an acceptable discriminatory power and calibration to differentiate between patients requiring or not dialysis after elective cardiac surgery (C-statistic = 0.72, 95% CI 0.57–0.87, HLχ2 statistic = 7.6; P = 0.47). In comparison, the STS risk score showed similar discriminatory power and calibration (C-statistic = 0.74, 95% CI 0.6–0.9, HLχ2 statistic = 9.2; P = 0.16; DeLong χ2 statistic = 0.14, P = 0.71). Values for the Cleveland score were C-statistic = 0.72, 95% CI 0.6–0.9, HLχ2 statistic = 0.7; P = 0.86 (DeLong χ2 statistic = 0.001, P = 0.98); and in the case of the SRI score, values were C-statistic = 0.73, 95% CI 0.6–0.9, HLχ2 statistic = 1.2, P = 0.55 (DeLong χ2 statistic = 0.05, P = 0.83).
Discrimination and calibration parameters were as follows: for EuroSCORE II, C-statistic = 0.71, 95% CI 0.6–0.8, HLχ2 statistic = 14, P = 0.09; for ACEF, C-statistic = 0.68, 95% CI 0.5–0.8, HLχ2 statistic = 5.0, P = 0.76 and for ACEFCG, C-statistic = 0.77, 95% CI 0.6–0.9, HLχ2 statistic = 5.1, P = 0.75. Logistic regression analysis of variables included in ACEFCG showed a one-variable model containing eCrCl as an independent factor associated with postoperative dialysis (OR 0.97, 95% CI 0.95–1.1; P = 0.005) (Table 4).
Logistic regression analysis of variables included in the ACEFCG score used to predict risk due to dialysis
| Variables | Wald | −2 log likelihood | Nagelkerke R2 | OR | 95% CI lower limit | 95% CI upper limit | P-value |
|---|---|---|---|---|---|---|---|
| Step 1 | 172 | 0.06 | |||||
| Age | 0.72 | 1.01 | 0.95 | 1.07 | 0.79 | ||
| eGFR | 4.94 | 0.98 | 0.96 | 0.99 | 0.03 | ||
| LVEF | 1.42 | 0.98 | 0.94 | 1.01 | 0.23 | ||
| Constant | 0.77 | 0.13 | 0.38 | ||||
| Step 2 | 172 | 0.06 | |||||
| eGFR | 6.38 | 0.98 | 0.96 | 0.99 | 0.01 | ||
| LVEF | 1.35 | 0.98 | 0.95 | 1.02 | 0.25 | ||
| Constant | 2.19 | 0.23 | 0.14 | ||||
| Step 3 | 173 | 0.05 | |||||
| eGFR | 8.04 | 0.97 | 0.95 | 0.99 | 0.01 | ||
| Constant | 13.8 | 0.09 | 0.00 |
ACEF: age, creatinine and ejection fraction score; CI: confidence interval; eGFR: estimated glomerular filtration rate; LVEF: left ventricular ejection fraction; OR: odds ratio.
Figure 2 describes in-hospital observed mortality and EuroSCORE II predicted risk of mortality based on the pre-existing degree of kidney dysfunction. Overall mortality risk significantly increased from normal to severely impaired renal function (χ2 for trend = 9, P = 0.003). In-hospital mortality associated with de novo dialysis was 29% (n = 5). Finally, Table 5 describes the univariate analysis of demographic and preoperative clinical factors associated with de novo dialysis after cardiac surgery.
Univariate analysis of demographic and preoperative clinical factors associated with dialysis after cardiac surgery
| Characteristics | Overall | Postoperative dialysis | No postoperative dialysis | P-value |
|---|---|---|---|---|
| Number of patients | 1332 | 17 | 1315 | |
| Age (years), median (IQR) | 68 (60–74) | 72 (65–74) | 68 (60–74) | 0.21 |
| BMI (kg/m2), median (IQR) | 27 (25–29) | 27 (25–30) | 27 (25–29) | 0.74 |
| Female gender, n (%) | 355 (27) | 5 (29) | 350 (27) | 0.79 |
| Diabetes, n (%) | 311 (23) | 6 (35) | 305 (23) | 0.38 |
| Dyslipidaemia, n (%) | 427 (32) | 9 (53) | 418 (32) | 0.06 |
| Hypertension, n (%) | 719 (54) | 9 (53) | 710 (54) | 0.93 |
| COPD, n (%) | 74 (6) | 2 (12) | 72 (6) | 0.24 |
| Heart failure, n (%) | 17 (1) | 1 (3) | 16 (1) | 0.20 |
| Type of surgery, n (%) | ||||
| Isolated CABG | 710 (53) | 7 (41) | 703 (53) | 0.52 |
| Isolated valve | 358 (27) | 5 (29) | 353 (27) | |
| Combined and others | 264 (20) | 5 (29) | 259 (20) | |
| Ejection fraction (%), mean (SD) | 57 ± 11 | 52 ± 15 | 57 ± 11 | 0.06 |
| EuroSCORE II, median (IQR) | 1.5 (0.9–2.8) | 2.9 (2.0–4.2) | 1.5 (0.9–2.8) | <0.01 |
| ACEF score, median (IQR) | 1.2 (1.0–1.3) | 1.3 (1.2–1.6) | 1.2 (1.0–1.3) | 0.01 |
| ACEFCG score, median (IQR) | 1.2 (1.0–2.1) | 2.8 (1.3–4.3) | 1.2 (1.0–2.1) | <0.01 |
| Serum Cr (mg/dl), mean (SD) | 1.1 ± 0.6 | 1.7 ± 1.4 | 1.1 ± 0.6 | 0.01 |
| eCrCl (ml/min), mean (SD) | 82 ± 39 | 60 ± 38 | 82 ± 39 | 0.02 |
ACEF: age, creatinine and ejection fraction score; BMI: body mass index; CABG: coronary artery bypass grafting; COPD: chronic obstructive pulmonary disease; Cr: creatinine; eCrCl: estimated creatinine clearance; IQR: interquartile range; SD: standard deviation.
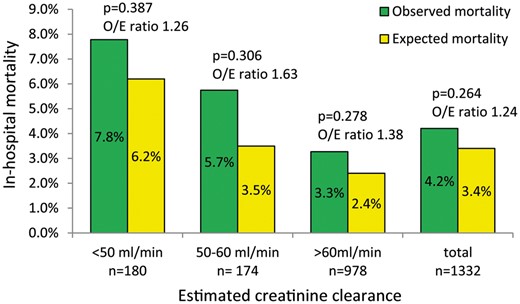
In-hospital observed mortality and EuroSCORE II predicted risk of mortality, based on the degree of pre-existing kidney dysfunction in patients undergoing cardiac surgery. O/E ratio: observed-to-expected.
DISCUSSION
In the overall population, 26.6% of patients presented moderate or severe pre-existing renal dysfunction, and the need for de novo dialysis varied from 0.6% to 5.0% depending on the degree of preoperative eCrCl. Preoperative renal dysfunction with eCrCl <50 ml/min was associated with nearly 8-fold increase of risk for postoperative de novo dialysis in patients undergoing elective cardiac surgery. Conversely, eCrCl between 50 ml/min and 60 ml/min showed approximately 2-fold increase, though this difference did not reach statistical significance when compared with patients with normal preoperative renal function. Comparatively, previous researchers communicated a prevalence of pre-existing renal impairment between 29.2% and 36.0% [16, 19], whereas Nguyen et al. [19] reported a need for de novo dialysis ranging between 1.1% and 9.9% for different estimated glomerular filtration rates in patients with aortic valve replacement.
Nearly 30% of patients requiring de novo dialysis died during hospital stay. This high mortality rate should not be exclusively attributed to dialysis but to morbidity and postoperative complications leading to renal replacement therapy. Although mortality increased from normal to severely impaired renal function, the smallest difference in O/E ratio was paradoxically found in patients with the poorest eCrCl. However, because O/E ratios for all categories were over 1, there is still room for improvement of our results based on the EuroSCORE II standards. A recent meta-analysis of 46 studies demonstrated that dialysis was associated with more than 5-fold increase in early mortality after surgery [2].
AUCs for the STS, the Cleveland and the SRI models varied between 0.70 and 0.80 with good calibration values. Nevertheless, isolated preoperative eCrCl performance was equivalent to these risk scores. These comparable results might be explained by the low burden of certain predictive variables included in the STS, the Cleveland and the SRI scores but uncommon in our elective population, such as combined mitral valve surgery, type I diabetes, emergency surgery, cardiogenic shock and preoperative intra-aortic balloon pump. On the basis of the Australian and New Zealand Society of Cardiac and Thoracic Surgery registry, Ng et al. [20] reported an AUC of 0.67, 0.74 and 0.74 for the STS, the Cleveland and the SRI models, respectively. Validation in a Mayo Clinic cohort found that the AUC for the same 3 scores was 0.81, 0.86 and 0.79 [21]. Other external validations reported an AUC between 0.82 and 0.86 for the Cleveland risk model and between 0.73 and 0.82 for the SRI model [22, 23].
The analysis of preoperative demographic and clinical characteristics showed that eCrCl <50 ml/min was associated with older age, smaller body mass index, female gender, heart failure, valve surgery, lower ejection fraction and higher values of EuroSCORE II, ACEF and ACEFCG scores. Also, longer operative cross-clamping time and prolonged postoperative ventilation were associated with low eCrCl. Many of these predictive variables were included in the STS, the Cleveland and the SRI scores, and because the same variables were more prevalent in our population of patients with the lowest eCrCl, it was expected that the single preoperative stratification by eCrCl had an acceptable global accuracy.
Risk stratification tools include different combinations of risk factors, and there is not a general agreement on the use of these predictive models for AKI after cardiac surgery [13, 20]. For instance, the STS score includes age, New York Heart Association class and recent myocardial infarction, which are not present in the Cleveland score; and the last model includes gender, chronic heart failure and pulmonary disease, not represented in the SRI score. However, it is widely known that preoperative renal function is the main factor to consider when evaluating patients who are at risk for AKI after surgery [1, 13, 20, 22], and this factor is clearly accounted for in the 3 models, with maximum weight assigned to eCrCl or serum creatinine.
It is not clear whether avoidance of cardiopulmonary bypass would prevent postoperative AKI [24, 25]. In the best case, nearly one-third of off-pump CABG surgeries may have reduced the global incidence of de novo dialysis in our study.
Previous research showed the EuroSCORE to be a good predictor of major postoperative morbidity in cardiac surgery, particularly for respiratory and dialysis-dependent renal failure [26]. This observation led us to analyse the potential usefulness of other models. The ACEFCG score is a mortality risk model based on only 3 preoperative variables, giving a preponderant weight to eCrCl. Although this score was originally developed to assess mortality risk, it performed accurately to predict the need for de novo dialysis in this study. Although it could be argued that knowing the preoperative risk would not alter the surgical decision-making process, the importance of comparing expected versus observed AKI rates may be justified from a health care quality perspective.
Recently, Meersch et al. [27] used 2 renal biomarkers, insulin-like growth factor-binding protein 7 (IGFBP7) and tissue inhibitor of metalloproteinases-2 (TIMP-2) to identify patients at high risk for cardiac surgery-associated AKI. These authors demonstrated that optimization of volume status and haemodynamics, avoidance of nephrotoxic drugs and prevention of hyperglycaemia in patients with urinary [TIMP-2]×[IGFBP7] >0.3 reduced the frequency and severity of AKI after cardiac surgery. This single-centre randomized controlled trial supports the possibility of associating the prediction of AKI with a set of perioperative preventive interventions.
Limitations
This study has some limitations. The small number of de novo dialysis found in our population precluded us from providing non-biased information on other risk factors for postoperative dialysis. Furthermore, no data on the length of postoperative dialysis, temporary or permanent, were achieved. The other models used to predict non-dialysis requiring AKI following cardiac surgery as the Multicentre Study for Perioperative Ischaemia (MCSPI) score [28], the Acute Kidney Injury After Cardiac Surgery (AKICS) score [29] and the Northern New England Cardiovascular Disease Study Group (NNECDG) score [30] were not included in this study, because they presented a composite outcome including renal dysfunction requiring or not dialysis. Hence, this study was limited to estimate only the risk for de novo dialysis, and no attempt was made to analyse less severe degrees of postoperative renal failure. Finally, indices that are based exclusively on preoperative data, as baseline eCrCl, could fail to assign risk to patients who develop unexpected operative or postoperative complications [29].
CONCLUSION
In conclusion, in elective cardiac surgery, isolated preoperative eCrCl seemed to be an accurate indicator of risk for postoperative de novo dialysis. It is almost intuitive that worse preoperative renal function will lead to a higher rate of postoperative renal failure; however, more complex models did not provide additional information to stratify that risk. Nonetheless, this study should be considered a retrospective external validation of the STS, the Cleveland and the SRI models exclusively for elective patients.
Conflicts of interest: none declared.
