


Abstract
The public health care system in Brazil has extensive waiting lists of patients requiring complex operations such as coronary artery bypass grafting (CABG). The purpose of this study was to identify the mortality and morbidity rates of the patients awaiting CABG and identify predictors of adverse events and their association with perioperative outcomes.
We conducted a retrospective analysis of outpatient medical records of patients referred for this elective procedure in Rio de Janeiro, Brazil. Excluded from the study were records of patients with any of the following: an indication for urgent surgery, unstable angina or concomitant surgical valvular disease or subsequent transfer to clinical or percutaneous therapy.
A total of 274 patients were identified and met the inclusion criteria, with a median waiting time for an operation of 142.7 days. While waiting for CABG surgery, 31 (11.3%) patients died of any cause and 42 (15.3%) patients had a serious cardiac event (death, myocardial infarction or unstable angina). Of the 22 (8%) incidents of acute myocardial infarction, 8 (2.9%) were non-fatal and 14 (5.1%) were fatal. There was a greater risk of death awaiting CABG surgery in patients with a left ventricular ejection fraction below 45% (hazard ratio = 2.33, 95% confidence interval 1.02–5.32; P = 0.039). The operative mortality rate was 5.8%. Although there was no evidence of worse perioperative outcomes in patients with prolonged waiting times for an operation, there was an association between waiting more than 16 weeks for an operation and death while on the list.
Extensive waiting periods for CABG contribute to higher mortality and morbidity rates, especially in patients with left ventricular dysfunction.
INTRODUCTION
Cardiovascular disease is the leading cause of death in the world [1]. Among the cardiovascular diseases, coronary artery disease (CAD) is the most prominent cause of morbidity and mortality. In several clinical scenarios, coronary artery bypass grafting (CABG) has proven efficacy in relieving patients’ symptoms and increasing survival rates [2–5]; however, CABG is a major operation that requires highly specialized hospitals and well-trained patient care professionals, which generate high costs within the health care systems. The lack of both structural and financial resources in many countries [6–10], especially in those offering universal access to health services, results in extensive waiting periods and the need to prioritize the waiting list for CABG to mitigate the potentially adverse cardiac events [11] sustained by patients and reduce social repercussions [10], psychological disorders and anxiety [12].
In Brazil, a chronic imbalance exists between the supply of CABG operations and the number of patients referred for this procedure. Although there is a need to ascertain which patient groups are at higher risk of death and adverse events while awaiting CABG, little current knowledge is available to provide a foundation for the most effective method of prioritizing these high-risk patients. Previous studies, though not recent, found that risk factors such as left ventricular dysfunction and angina were associated with worse outcomes in patients on the waiting list for CABG [11, 13, 14].
The purpose of this study was to (i) assess the incidence of death and other adverse cardiovascular events in patients on the waiting list for CABG, (ii) identify the variables associated with these events and (iii) assess the association between the waiting times for CABG and perioperative complications.
MATERIALS AND METHODS
This study was approved by the National Institute of Cardiology (Instituto Nacional de Cardiologia)—Ethical Committee for Research Projects (no. 31080214.9.0000.5272). Because data were collected by analysing the medical records, informed consent was waived, and investigators signed a term of confidentiality. The data were reported in accordance with the STROBE reporting guidelines for observational research [15].
Study design
We performed a retrospective analysis of a prospective cohort to evaluate the duration on the waiting list for elective CABG and its relationship to (i) percentage of deaths of any cause, (ii) percentage of combination of cardiac death, non-fatal acute myocardial infarction (AMI) and unstable angina requiring immediate hospitalization and (iii) relevant clinical parameters that may indicate increased risk for death and composite outcome. Relevant clinical variables and the results of laboratory tests were retrieved from medical records by an independent investigator for the waiting list period from 1 March 2011 to 11 September 2015 at the National Institute of Cardiology (Instituto Nacional de Cardiologia) in Rio de Janeiro, Brazil. Telephone interviews were conducted to retrieve or clarify the medical records when needed or to update the records of patients without follow-up visits to the institution. Deaths outside of the National Institute of Cardiology were confirmed at the Mortality Information Service of the State of Rio de Janeiro.
Setting
The National Institute of Cardiology is in Rio de Janeiro and is a leading reference centre in Brazil for cardiac diseases of high complexity. Since 1973, it has served the region as a public hospital specializing in cardiac diseases. In 2000, it was designated by the Ministry of Health as the reference institution for training, research and formulating health policy. The institution has 165 beds, 60 of which are designated for intensive care. The institution admits over 4000 patients and performs approximately 1200 surgeries and 50 000 medical consultations annually [16].
Subjects
Inclusion criteria included patients aged 18 years or older who were consecutively referred for elective, isolated (without concomitant valve surgery) CABG at the National Institute of Cardiology. Exclusion criteria included patients who refused the procedure or whose management was changed to medical treatment only or to percutaneous transluminal angioplasty.
Variables
Time awaiting coronary artery bypass grafting
The waiting time for the operation was considered to be the date of enrolment on the preoperative list (upon request from the attending physician) until the date of the operation or death. The time to the first event was counted from the date of inclusion on the list until the reported event [death, myocardial infarction (MI) or unstable angina].
Clinical/laboratorial variables
Data collected included gender (male/female), age (at the time of enrolment), presence or absence of risk factors for CAD [systemic arterial hypertension, diabetes mellitus, dyslipidaemia, obesity or overweight, chronic renal failure, current or previous smoking (yes or no) and family history of early CAD (presence or absence)], presence or absence of previous cardiac events (MI, percutaneous transluminal angioplasty and CABG) and presence or absence of relevant current coronary diagnoses (stable angina, heart failure, left ventricular dysfunction, concomitant carotid artery disease and peripheral arterial disease). The laboratory results for the following parameters were recorded at the time of enrolment: total cholesterol, high-density lipoprotein, low-density lipoprotein, triglycerides, fasting glucose and serum creatinine levels.
We conducted a review of all reports of coronary angiography and echocardiography at rest and collected data for ejection fraction and the left ventricular function for each patient. Complete definitions are shown in the Supplementary Material. In addition, we collected each patient’s score from the European System for Cardiac Operative Risk Evaluation II [17].
Perioperative outcomes
We gathered perioperative outcomes of death and MIs. Operative mortality was defined by all-cause mortality occurring 30 days after the procedure. Perioperative MI (related to CABG—‘Type 5 MI’) was diagnosed when (i) the levels of the myocardial necrosis biomarkers (creatine phosphokinase-MB or troponin) rose above the 99th percentile of the reference range for the method during the first 72 h after CABG and were associated with the appearance of new pathological Q waves on an electrocardiogram or new left branch block (LBB) or (ii) a coronary angiogram showed a new occlusion of a native coronary artery or a surgical graft occlusion or (iii) we found imaging evidence of a new loss of myocardial viability [18].
Statistical analysis
Continuous variables were expressed as the mean ± standard deviation for normal distribution and the median for non-normal distribution; categorical variables were demonstrated as percentages. The non-parametric Mann–Whitney U-test was used for continuous variables; to determine statistical difference between groups, a P-value of <0.05 was considered significant.
On univariable analysis, the Kaplan–Meier curves were generated (Time 0 was the time of enrolment on the waiting list); significance was assessed by the log-rank test. The multivariable model was constructed after univariable prescreening, and covariates were included in the model when they had a P-value of ≤0.30. The Cox proportional hazards model was used for multivariable analysis. The proportionality assumption for the Cox regression model was assessed by the Grambsch–Therneau test. To calculate the cumulative incidence of events during a queue, a competing risks data analysis was used. To evaluate the trend events over time (association between waiting time and events on the list), the χ2 test for trend in proportions was used. Missing data in regression models were handled by case–complete analysis. All calculations and graphics were performed using the software application R (R Foundation for Statistical Computing, Vienna, Austria; www.r-project.org), survival and survminer packages (versions 3.3.1, 0.2.2 and 2.39-5, respectively).
RESULTS
Patient characteristics
The patient selection process is shown in Fig. 1. From a total of 472 patients, 274 patients met the criteria for inclusion in the study. Baseline characteristics, laboratory data and medications prescribed during the waiting period are shown in Table 1. The operations took place between 18 May 2011 and 23 May 2016.
Demographics and clinical and laboratory data
| Variables | Patients (n = 274), % | Mean ± SD |
|---|---|---|
| Age (years) | 63.4 ± 8.3 | |
| Male | 192 (70.1) | |
| Systemic arterial hypertensiona | 267 (98.2) | |
| Diabetes mellitusa | 124 (45.6) | |
| Dyslipidaemiaa | 263 (96.7) | |
| Chronic renal failurea | 41 (15.1) | |
| History of myocardial infarctiona | 139 (51.1) | |
| Current smokera | 30 (11.0) | |
| Previous smokera | 133 (48.9) | |
| Carotid artery diseasea | 29 (10.7) | |
| Peripheral artery diseasea | 44 (16.2) | |
| Family history of CADa | 88 (32.4) | |
| History of PTCAa | 29 (10.7) | |
| History of CABGa | 3 (1.1) | |
| Overweightb | 100 (40.2) | |
| Obesityb | 80 (32.1) | |
| Height (m) | 1.64 ± 0.08 | |
| BMI (kg/m2) | 27.8 ± 4.2 | |
| Angina—functional class (CCS)a | ||
| No angina | 26 (9.6) | |
| I | 12 (4.4) | |
| II | 85 (31.2) | |
| III | 119 (43.8) | |
| IV | 30 (11.0) | |
| HF—functional class (NYHA)a | ||
| I | 220 (80.9) | |
| II | 34 (12.5) | |
| III | 18 (6.6) | |
| IV | 0 | |
| Echocardiographyc | ||
| Normal ventricular function | 181 (66.3) | |
| Mild ventricular dysfunction | 40 (14.7) | |
| Moderate ventricular dysfunction | 38 (13.9) | |
| Severe ventricular dysfunction | 14 (6.3) | |
| Left ventricular ejection fraction (%) | 58.3 ± 13.6 | |
| Total cholesterol (mg/dl) | 172 ± 47.5 | |
| HDL (mg/dl) | 36.8 ± 9.6 | |
| LDL (mg/dl) | 102.5 ± 38.7 | |
| Triglycerides (mg/dl)d | 147.0 [100.0–199.8] | |
| Blood glucose (mg/dl) | 121.3 ± 43.4 | |
| Creatinine (mg/dl)d | 0.9 [0.8–1.1] | |
| EuroSCORE II (%) | 2.45 ± 1.86 | |
| Coronary angiography | ||
| Univascular lesion | 8 (3.0) | |
| Bivascular lesion | 87 (31.8) | |
| Three-vessel lesion | 174 (63.5) | |
| Isolated LMCA lesion | 4 (1.5) | |
| LMCA lesion | 57 (20.8) | |
| Proximal LAD stenosis | 181 (66.0) | |
| Medicationse | ||
| Diuretics | 105 (41.2) | |
| Beta blocker | 246 (96.5) | |
| Calcium channel blocker | 104 (40.8) | |
| Mononitrate | 137 (53.7) | |
| Dinitrate | 3 (1.2) | |
| Acetylsalicylic acid | 246 (96.5) | |
| ACEI | 118 (46.3) | |
| ARB | 110 (43.1) | |
| Statin | 253 (99.2) | |
| Fibrate | 4 (1.6) | |
| Oral hypoglycaemic agent | 86 (33.7) | |
| Insulin | 28 (10.9) |
Two patients with no information.
Twenty-five patients with no information.
One patient with no information.
Median and interquartile range.
Nineteen patients with no information.
ACEI: angiotensin-converting enzyme inhibitor; ARB: angiotensin II receptor blocker; BMI: body mass index; CABG: coronary artery bypass grafting; CAD: coronary artery disease; CCS: Canadian Cardiovascular Society; EuroSCORE: European System for Cardiac Operative Risk Evaluation; HDL: high-density lipoprotein; HF: heart failure; LAD: left anterior descending coronary artery; LDL: low-density lipoprotein; LMCA: left main coronary artery; NYHA: New York Heart Association; PTCA: percutaneous transluminal coronary angioplasty; SD: standard deviation.
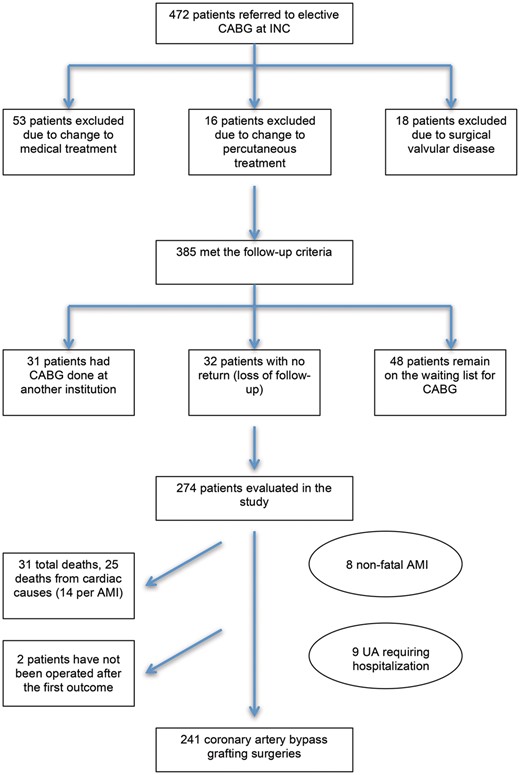
Process for selecting patients and the outcomes of those on the waiting list for CABG. AMI: acute myocardial infarction; CABG: coronary artery bypass grafting; INC: Instituto Nacional de Cardiologia; UA: unstable angina.
There was a high prevalence of cardiovascular risk factors, especially systemic arterial hypertension (98.2%), diabetes mellitus (45.6%), dyslipidaemia (96.7%) and current or previous smoking (59.9%). Most individuals (75%) had symptoms of angina and Canadian Cardiovascular Society Class II or III. Another important feature of the sample was that most patients (66.3%) had normal systolic ventricular function, with 80.9% of them considered New York Heart Association functional Class I. Acetylsalicylic acid, beta blockers and statins each had a reported use of more than 90% by the study cohort.
Waiting time and outcomes
The median waiting time for CABG was 142.7 days, ranging from 15 to 1117 days (interquartile range 74–278 days).
The primary outcome (death from any cause) occurred in 31 (11.3%) patients while they were on the waiting list, with a median of 338 (range 17–955) days. The composite end-point (combination of cardiac death, non-fatal AMI and unstable angina requiring immediate hospitalization) occurred in 15.3% of the study cohort (n = 42) with a median of 174.5 (range 17–955) days. We had documentation of 22 (8%) cases of AMI while on the waiting list. Among these events, 36% (n = 8) were non-fatal and 64% (n = 14) were fatal. Of the 31 deaths, 81% (n = 25) were due to cardiac causes. Hospitalization for unstable angina occurred in 3.3% of patients (n = 9).
A borderline statistical difference (P = 0.052) was found between the waiting period of the patients who died awaiting surgery (median 338 days; interquartile range 58.5–458 days) and of those who did not (median 135 days; interquartile range 74.5–260 days). In the analysis of time distribution of events, we found an association between prolonged waiting time and death, with 67.7% of deaths occurring after 16 weeks of waiting (P = 0.025). No association was found between waiting time and combined outcome (P = 0.652) (Table 2).
Association between waiting time for coronary artery bypass grafting and cardiovascular events while on the waiting list
| Waiting time | Number of patients (n = 274) | Composite end-point (n = 42), % | Total deaths (n = 31), % |
|---|---|---|---|
| Up to 4 weeks | 10 | 3 (7.1) | 3 (9.7) |
| From 4 to 8 weeks | 77 | 5 (11.9) | 3 (9.7) |
| From 8 to 16 weeks | 78 | 9 (21.4) | 4 (12.9) |
| Over 16 weeks | 109 | 25 (59.6) | 21 (67.7) |
The estimated cumulative incidence graph that accounts for the competing risks while on the waiting list is depicted in Fig. 2.
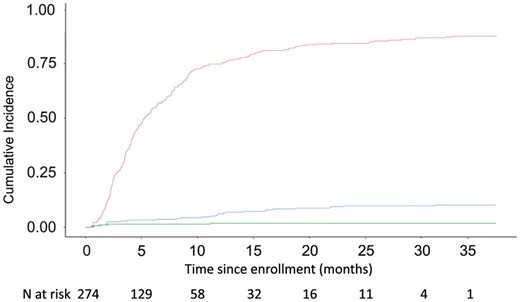
Cumulative incidence graph showing competing risks of events while patients were on the waiting list for coronary artery bypass grafting (CABG) procedures. Red curve: patients who underwent CABG; blue curve: patients who died while waiting for CABG; green curve: patients who did not have the operation or who died in the queue. Numbers at the bottom: number of subjects who are still at risk, i.e. under follow-up and free of any event, at each time point.
Of the 241 patients who underwent CABG, operative death occurred in 5.8% (n = 14); 4.1% (n = 10) had a perioperative infarction. No significant difference was observed in waiting times between patients who died in the perioperative period and those who did not die (169.5 vs 140 days, P = 0.43) nor was there an association between perioperative infarction and time on the waiting list.
Of the 8 patients who had non-fatal AMIs while awaiting CABG, 2 patients were still waiting to undergo operation and 6 patients underwent operation, with 1 operative death reported (16.6% mortality rate). The 9 patients who had unstable angina while waiting underwent CABG, with no operative death documented.
Predictors of death on the waiting list
The results of univariable prescreening analysis and multivariable analysis are shown in Table 3. In the multivariable analysis, no statistical correlation was observed between most clinical variables nor was there any association between coronary anatomy and death, except for the presence of left ventricular dysfunction. Left ventricular dysfunction with a left ventricular ejection fraction below 45% was significantly associated with death [hazard ratio (HR) 2.33, 95% confidence interval (CI) 1.02–5.32; P = 0.039]. Dyslipidaemia was found to be a protective factor (HR 0.24, 95% CI 0.08–0.75; P = 0.008).
Univariable and multivariable analyses of risk factors for death of patients on the waiting list
| Univariable analysis | Multivariable analysis | |||||
|---|---|---|---|---|---|---|
| Variables | HR | 95% CI | P-value | HR | 95% CI | P-value |
| Age (years) | 0.99 | 0.94–1.03 | 0.55 | |||
| Male gender | 0.95 | 0.44–2.08 | 0.91 | |||
| BMI >25 kg/m2 | 0.56 | 0.12–2.58 | 0.47 | |||
| Systemic arterial hypertension | 0.26 | 0.03–2.02 | 0.28 | 0.31 | 0.07–1.39 | 0.13 |
| Diabetes mellitus | 0.98 | 0.47–2.04 | 0.96 | |||
| Dyslipidaemia | 0.18 | 0.06–0.52 | 0.009 | 0.24 | 0.08–0.75 | 0.008 |
| Chronic renal failure | 1.14 | 0.39–3.3 | 0.81 | |||
| History of myocardial infarction | 0.83 | 0.40–1.7 | 0.61 | |||
| Current smoking | 0.76 | 0.18–3.2 | 0.71 | |||
| Family history of CAD | 0.48 | 0.17–1.41 | 0.15 | 0.57 | 0.18–1.77 | 0.33 |
| Carotid disease | 1.1 | 0.26–4.7 | 0.89 | |||
| Peripheral artery disease | 1.08 | 0.41–2.86 | 0.87 | |||
| Ejection fraction <45% | 2.45 | 1.13–5.29 | 0.018 | 2.33 | 1.02–5.32 | 0.039 |
| Stable angina, CCS Class III/IV | 0.58 | 0.27–1.22 | 0.15 | 1.32 | 0.67–2.60 | 0.42 |
| Left main coronary artery stenosis | 0.70 | 0.29–1.73 | 0.43 | |||
BMI: body mass index; CAD: coronary artery disease; CCS: Canadian Cardiovascular Society; CI: confidence interval; HR: hazard ratio.
Predictors of the composite end-point for those on the waiting list
Results of univariable and multivariable analyses of risk factors for the composite end point while on the waiting list are shown in Table 4. In the multivariable analysis of the composite end-point, none of the variables were associated with an increased risk of events. A body mass index >25 had a protective effect for outcomes (HR 0.31, 95% CI 0.13–0.73; P = 0.007).
Univariable and multivariable analyses of risk factors for composite end-point during the waiting time
| Univariable analysis | Multivariable analysis | |||||
|---|---|---|---|---|---|---|
| Variables | HR | 95% CI | P-value | HR | 95% CI | P-value |
| Age (years) | 0.99 | 0.95–1.03 | 0.47 | |||
| Male gender | 0.7 | 0.37–1.32 | 0.28 | 0.67 | 0.27–1.66 | 0.38 |
| BMI >25 kg/m2 | 0.31 | 0.13–0.72 | 0.009 | 0.31 | 0.13–0.73 | 0.007 |
| Systemic arterial hypertension | 0.51 | 0.07–3.77 | 0.55 | |||
| Diabetes mellitus | 1.24 | 0.67–2.31 | 0.49 | |||
| Dyslipidaemia | 0.24 | 0.08–0.67 | 0.018 | 0.15 | 0.02–1.21 | 0.078 |
| Chronic renal failure | 1.71 | 0.78–3.73 | 0.20 | 2.46 | 0.95–6.35 | 0.06 |
| History of myocardial infarction | 0.57 | 0.30–1.09 | 0.077 | 0.70 | 0.26–1.85 | 0.48 |
| Current smoking | 1.84 | 0.77–4.4 | 0.20 | 1.16 | 0.30–4.52 | 0.83 |
| Family history of CAD | 0.7 | 0.32–1.52 | 0.35 | |||
| Carotid disease | 2.35 | 0.96–5.75 | 0.087 | 2.07 | 0.65–6.5 | 0.22 |
| Peripheral artery disease | 1.28 | 0.58–2.1 | 0.54 | |||
| Ejection fraction <45% | 1.80 | 0.90–3.6 | 0.12 | 1.88 | 0.72–4.92 | 0.19 |
| Stable angina CCS Class III/IV | 1.08 | 0.58–2.03 | 0.81 | |||
| Left main coronary artery stenosis | 0.97 | 0.47–1.98 | 0.92 | |||
BMI: body mass index; CAD: coronary artery disease; CCS: Canadian Cardiovascular Society; CI: confidence interval; HR: hazard ratio.
DISCUSSION
This study demonstrated a high rate of cardiac events and death in patients with CAD referred for CABG surgery during the waiting time for the procedure, with a mortality rate of 11.3% and a composite end-point (combination of cardiac death, AMI and unstable angina requiring immediate hospitalization) of 15.3%. The mortality rate due to cardiac causes was 9.1% in the overall sample, with AMI occurring in 8% and unstable angina requiring hospitalization in 3.3% of patients. We found an association between prolonged waiting times and death for those on the waiting list, similar to the results from other studies [9, 11, 14, 19]. The median waiting time for patients with the outcome of death was longer than that for those who survived (338 compared with 135 days, respectively). There was also a tendency for adverse events to occur with the more prolonged waiting period in the composite outcome; however, the difference did not reach statistical significance, possibly due to the limited sample size.
Evaluating the clinical predictors for the increased risk of adverse events showed that only the presence of an ejection fraction <45% was an independent predictor of death for those on the waiting list (HR 2.33). Surprisingly, dyslipidaemia had an inverse association with death (HR 0.24), which may be attributed to the use of statins or of higher doses of statins in these patients. Statins have been proved to be effective in reducing death and cardiovascular events [20, 21], especially in patients at high risk for major vascular events, such as those with diabetes [22]. For the composite outcome, no variable was associated with increased risk of vascular events. A body mass index higher than 25 kg/m2 was considered a protective factor for the composite end-point in the multivariable analysis. This result is supported by results from several studies that have demonstrated an obesity paradox, suggesting that higher body mass index (including overweight and moderately obese patients) is associated with decreased rates of mortality and morbidity [23, 24]. These individuals have lower mortality rates and fewer adverse perioperative outcomes after cardiac procedures compared with normal weight, underweight and morbidly obese patients, showing a reverse J-shaped curve [24]. The severity of stable angina was not significantly associated with the occurrence of events for those on the waiting list. Although severe stable angina is usually associated with a worse prognosis [6, 13, 25], in this study, it was not associated with outcomes for those on the waiting list. This result is likely due to the fact that patients with Canadian Cardiovascular Society Class IV angina were not included in the elective CABG list. It is important to note that our study does not support the current practice in our hospital of prioritizing patients based on clinical symptoms—worse angina grade, poor New York Heart Association functional capacity—or on critical anatomical findings on coronary angiograms.
The extensive waiting period experienced by the cohort in this study (142.7 days) was significantly longer than those in similar studies from other countries (142.7 days vs 39.5 days [7], 142.7 days vs 100 days [13], 142.7 days vs 18 days [14] and 142.7 days vs 113 days [26]), contributing to a higher rate of mortality than in these studies (11.3% current study vs 4% highest value of the similar studies [27]). The non-fatal MI rate (2.9%) of the current cohort is similar to the 1.9% reported by Koomen et al. [13]. Cesena et al. [25] reported a far higher incidence (22.9%) of secondary outcomes than that in our study (15.3%), though that result is likely due to the latter considering any hospitalization from cardiac causes as a secondary outcome. Similarly, Jackson et al. [27] reported in their study a higher incidence of patients with non-fatal AMI and unstable angina than that in our study (6% vs 2.9% and 34% vs 3.3%, respectively), though this finding likely reflects the differences in the inclusion and exclusion criteria for each study. The mortality rate for those on the waiting list was almost identical to that in a previous Brazilian study by Haddad et al. [28], whose mortality rate was 11.2%. This latter study, however, showed longer waiting times (median 570 days). There is significant evidence that delaying the operation for patients with severe left ventricular dysfunction increases the number of deaths [11, 14, 25, 29]. A study published by Beanlands et al. [30] analysed 35 patients referred for CABG with an ejection fraction smaller than or equal to 35%; the group with a waiting time for the procedure >35 days had a preoperative mortality rate of 24% vs 0 in the group that waited up to 35 days for the surgery.
As mentioned above, making comparisons between different studies should be done with caution, because the characteristics of the populations may be quite different. The sample in this study showed a high prevalence of risk factors for CAD; other studies included priority patients (urgent and semiurgent) who were excluded from this analysis.
Limitations
Several limitations in this study should be noted. Patient adherence to drug therapy is not always properly and clearly registered in the medical records. There can also be missing data, especially in anthropometric measurements. There is no information on the distribution of elective, urgent and emergency cases among the complete population of patients operated during the period studied. The number of secondary outcome events (MI and unstable angina) may also be underestimated, because those might have resulted in hospitalizations at other centres, which we would be unable to identify because Brazil currently does not have a unified system for tracking the health status of patients. Nevertheless, the results of our study are relevant when one wants to understand the challenges faced in a universal access public health care system and the limitations of medical resources producing prolonged waiting times for operations as seen in several countries. Discussions about the existence of queues are important for society, because they help direct authorities’ efforts to reduce overall mortality by reducing the delay for procedures and effectively prioritizing patients based on their profile.
CONCLUSIONS
Directing public health policies to shorten the waiting time for the procedure can reduce mortality rates among those on the waiting lists for CABG. Patients with left ventricular dysfunction should be prioritized to reduce the mortality rate of those on the waiting list.
SUPPLEMENTARY MATERIAL
Supplementary material is available at ICVTS online.
ACKNOWLEDGEMENTS
We would like to thank Alexandre Siciliano Colafranceschi, Ricardo Lima, Fernando Cruz and the crew of the Núcleo Interno de Regulação of INC, in particular Viviane Giordano, Ciro Macedo and Fernanda Porto. Our gratitude goes to Angela Cascão, from the Mortality Information Service of the State of Rio de Janeiro. We would also like to thank Hattie Cobb for her editorial services.
Conflict of interest: none declared.
