


Abstract
We herein aimed to compare acute 30-day outcomes of latest-generation self-expandable and balloon-expandable transcatheter heart valves.
From 2012 through 2016, 104 consecutive patients (study group, 69.2% female, 81.7 ± 5.5 years, logEuroSCORE I 15.9 ± 9.3%) received transfemoral transcatheter aortic valve implantation using the Symetis ACURATE neo® transcatheter heart valve. A control group of patients after transfemoral transcatheter aortic valve implantation with the Edwards Sapien 3™ transcatheter heart valve was retrieved from our database and matched to the study group. Data were retrospectively analysed according to updated Valve Academic Research Consortium definitions.
Device success was 94.2% (98 of 104) and 98.1% (102 of 104) in study and control groups, respectively (P = 0.157). All-cause 30-day mortality was 3.9 (4 of 104) vs 0.9% (1 of 104) (P = 0.317). Resultant transvalvular peak/mean gradients and effective orifice area were 14.2 ± 5.7 vs 22.6 ± 6.8 mmHg (P < 0.001)/7.3 ± 2.8 vs 11.8 ± 3.5 mmHg (P < 0.001) and 2.0 ± 0.4 vs 1.7 ± 0.4 cm2 (P = 0.063). Paravalvular leakage ≥moderate was observed in 4.8% (5 of 104) and 1.9% (2 of 104) (P = 0.257). Rate of permanent pacemaker implantation was 10.6% (11 of 104) vs 16.4% (17 of 104) (P = 0.239).
Next-generation self-expandable transcatheter heart valves preserve superiority in terms of post-interventional haemodynamics without presenting former drawbacks: rate of postoperative permanent pacemaker implantation and severity of residual paravalvular leakage were similar to balloon-expandable transcatheter heart valves.
INTRODUCTION
Since the first transcatheter aortic valve implantation (TAVI) in 2002, extensive interventional and clinical experience has been published and important technical improvements regarding transcatheter valve systems were achieved [1–3]. Benefit deriving from TAVI procedures for patients who are ineligible or at high risk for surgical aortic valve replacement (SAVR) was shown, and currently indications are extended to patients at intermediate risk and to valve-in-valve procedures [4–6]. Over the last decade, mainly 2 techniques of transcatheter heart valve (THV) expansion into the aortic annulus gave evidence of adequate haemodynamic and clinical results: the balloon-expandable (BE) and the self-expandable (SE) approach [7, 8]. Traditionally, first-generation SE-THVs are considered to be associated with more frequent post-interventional need for permanent pacemaker (PPM) implantation and less frequent device success due to residual paravalvular leakage (PVL) compared to BE-THV [9, 10]. Rates of PPM implantation subsequent to TAVI with first-generation THV varied between 6% for BE and 26% for SE devices. Rates of PVL ≥moderate with first-generation THV were as high as 13% for BE-THV and 18% for SE-THV with well-documented adverse impact on survival of PVL ≥moderate [11, 12]. Furthermore, first-generation BE-THVs are considered to be associated with higher post-procedural pressure gradients and smaller effective orifice areas (EOAs) compared with SE-THV [13].
Current evidence suggests that novel second-generation SE-THV achieve important advances regarding incidence of residual PVL and rate of PPM implantation. Novel BE-THV have proved to substantially lower the rate of PVL compared with first-generation BE-THV [14, 15]. To date, no study exists comparing the latest-generation SE-THV and BE-THV. Therefore, there is a lack of evidence whether the described drawbacks of previous THV technologies still apply.
We herein present a case-matched analysis of acute 30-day outcomes using the SE Symetis Acurate Neo TF™ (Symetis SA, Ecublens, Switzerland) aortic valve and the BE Edwards Sapien 3™ (Edwards Lifesciences Co., Irvine, CA, USA) THV.
MATERIALS AND METHODS
Patients
A consecutive series of 104 patients received transfemoral (TF)-TAVI using the Symetis Acurate Neo TF™ for treatment of severe symptomatic calcified aortic stenosis (study group) between 2012 and 2016. Allocation of patients to TAVI followed current international recommendations after consensus of the local dedicated heart team [16]. Patients unsuitable for a retrograde TF approach were excluded from analysis. For comparative assessment, a matched control group of 104 patients treated by TF-TAVI using the Edwards Sapien 3™ THV during the same time frame (2014 to 2016) was retrieved from our dedicated hospital database containing a total of 1326 TAVI patients (210 Sapien 3 patients). All valve-in-valve procedures were excluded from this analysis. Written informed consent was obtained from all patients prior to the procedure [17].
Diagnostic workup and study procedure
Diagnostics and procedures followed institutional routine as previously described [17]: all patients received preoperative transthoracic and transoesophageal echocardiographies for evaluation of cardiac functional status. Furthermore, diagnostic workup included contrast-enhanced, electrocardiogram-gated multislice computed tomography (MSCT). Data sets were analysed using the 3mensio Medical Imaging Software (3mensio, Medical Imaging, Bilthoven, Netherlands) for calculation of native aortic annulus dimensions and determination of adequate THV size as well as assessment of aortic root anatomy and morphology (e.g. distribution and severity of valvular calcification, aortic root dimensions or height of coronary ostia take-off), prediction of optimal c-arm angulation and assessment of aorto-iliac and peripheral vascular status. Furthermore, for comparison of anatomical characteristics, all MSCTs of both groups were retrospectively analysed regarding grade of calcification, calcium spurs and aortic annulus size. For optimal comparability, all analyses were performed by one examiner.
TAVI procedures were performed under general anaesthesia or conscious sedation in a specially equipped hybrid operating suite by a dedicated team of cardiologists and cardiac surgeons. Percutaneous vascular access was gained using the Prostar vascular closure system (Abbott Vascular, Santa Clara, CA, USA). A temporary, transvenous pacing lead was placed into the right ventricle via the jugular vein and an aortic root pigtail catheter was placed from the groin. Retrograde passage of the stenotic aortic valve was followed by placement of a preshaped, stiff guidewire in the left ventricular apex. THV advancement and deployment procedures followed institutional standard protocols for the ACURATE neo® and Edwards Sapien 3™ THV.
No differences in decision-making for pre- and post-ballooning of the respective valves were observed since all procedures included in the study were performed by a core team. THV function was assessed by transoesophageal echocardiography and aortic root angiography. Balloon post-dilatation was performed when PVL was more than trace.
Statistics
Baseline, intraprocedural and acute follow-up data up to 30 days were prospectively collected and entered into a dedicated standardized database and retrospectively analysed. All clinical end-points up to 30 days were adjudicated in accordance with the updated standardized Valve Academic Research Consortium definitions [18]. Data are presented as absolute numbers and percentages for categorical variables and mean values and standard deviation for continuous variables unless stated otherwise. To assess the distribution of continuous variables, we generated histograms of each variable. None of these plots showed multiple peaks.
To evaluate the effect of a treatment in a non-randomized setting, 1:1 matching (drawing without replacement) was conducted by logistic regression and nearest neighbour matching as the measure of proximity. Matching pairs of all cases from the treatment group were identified for the following 17 variables: age, gender, logistic European System for Cardiac Operative Risk Evaluation I (logEuroSCORE I), Society of Thoracic Surgeons Score, malignant disease, arterial hypertension, diabetes, previous sternotomy, coronary artery disease, peripheral artery disease, chronic obstructive pulmonary disease >Gold II, pulmonary hypertension >60 mmHg, previous stroke, New York Heart Association functional class, creatinine at baseline, sinus rhythm/atrial fibrillation and left ventricular ejection fraction. All computations were carried out by the statistical software R and the R-package MatchIt. Due to the dependence structure of the matched pairs data, we used paired t-tests the for continuous data and McNemar’s tests for categorical data. A level of significance was set to 2-tailed P < 0.05 [17, 19, 20].
RESULTS
Baseline demographics and matching results
A total of 104 consecutive patients (study group) received TF-TAVI using the Symetis Acurate Neo TF™ (69.2% female, 81.7 ± 5.5 years, logEuroSCORE I 15.9 ± 9.3%). Matching yielded a control group of 104 patients receiving TF-TAVI with the Edwards Sapien 3™ THV (65.4% female, 81.2 ± 6.2 years, logEuroSCORE I 13.7 ± 9.0%) who were similar to the study group with regard to 17 baseline parameters. No significant intergroup differences were present after matching. Detailed patient demographics are summarized in Table 1.
Baseline demographics
| Symetis (n = 104) | Sapien 3 (n = 104) | Δ | P-value | |
|---|---|---|---|---|
| Age, years | 81.7 ± 5.5 | 81.2 ± 6.2 | −0.2 | 0.772 |
| Female gender, % (n) | 69.2 (72) | 65.4 (68) | 3.8 | 0.555 |
| BMI, kg/m2 | 27.1 ± 5.1 | 26.8 ± 5.0 | −0.2 | 0.789 |
| logEuroSCORE I, % | 15.9 ± 9.3 | 13.7 ± 9.0 | 1.3 | 0.351 |
| STS PROM, % | 5.8 ± 3.8 | 5.4 ± 3.6 | 0.6 | 0.300 |
| Diabetes mellitus, % (n) | 27.9 (29) | 26 (27) | 1.9 | 0.493 |
| Arterial hypertension, % (n) | 85.6 (89) | 93.3 (97) | −7.7 | 0.670 |
| Stroke, % (n) | 14.4 (15) | 11.5 (12) | 2.9 | 0.835 |
| Coronary artery disease, % (n) | 59.6 (62) | 57.7 (60) | 1.9 | 0.758 |
| Previous sternotomy, % (n) | 9.6 (10) | 5.8 (6) | 3.8 | 0.317 |
| Extracardiac atheropathya, % (n) | 16.3 (17) | 13.5 (14) | 2.9 | 0.178 |
| Arrhythmia, % (n) | 34.6 (36) | 32.7 (34) | 2.6 | 0.170 |
| COPDa >Gold II, % (n) | 17.3 (18) | 20.2 (21) | −2.9 | 0.117 |
| Creatinine, mg/dl | 1.2 ± 0.7 | 1.3 ± 1.0 | −0.1 | 0.562 |
| Pulmonary hypertensiona >60 mmHg, % (n) | 13.5 (14) | 12.5 (13) | 3.1 | 0.655 |
| LVEF ≤44%, % (n) | 26.0 (27) | 22.1 (23) | 3.8 | 0.105 |
| NYHA ≥III, % (n) | 86.5 (90) | 88.5 (92) | −1.9 | 0.655 |
Extracardiac atheropathy, COPD and pulmonary hypertension according to EuroSCORE definitions.
BMI: body mass index; logEuroSCORE: logistic European System for Cardiac Operative Risk Evaluation; STS: Society of Thoracic Surgeons; COPD: chronic obstructive pulmonary disease; LVEF: left ventricular ejection fraction; NYHA: New York Heart Association.
Multislice computed tomography data
Calcium loads did not differ between both groups. This applies for the annular and subannular zone as well as for the right-, left- and non-coronary cusp. Aortic annulus size presented significant differences for area derived aortic annulus diameter (23.9 ± 2.8 vs 24.8 ± 2.6 mm; P = 0.02) and perimeter-derived aortic annulus diameter (24.5 ± 2.5 vs 25.3 ± 2.6 mm; P = 0.02). Accordingly, the cover index differed between the study group and the control group, with rather oversizing in the study group and undersizing in the control group (1.5 ± 6.6 vs −0.9 ± 6.4; P = 0.01).
Detailed MSCT data are presented in Table 2.
Preprocedural MSCT imaging and calcification patternsa
| Symetis (n = 104) | Sapien 3 (n = 104) | P-value | |
|---|---|---|---|
| Calcium load Zone 1b, mm³ | |||
| Right coronary cusp | 163.3 ± 161.6 | 159.9 ± 149.4 | 0.87 |
| Left coronary cusp | 174.8 ± 166.7 | 191.5 ± 158.7 | 0.46 |
| Non-coronary cusp | 257.9 ± 222.4 | 289.4 ± 238.5 | 0.36 |
| Total calcium load Zone 1 | 596.1 ± 481.4 | 634.4 ± 464.9 | 0.56 |
| Calcium load Zone 2c total, mm³ | 59.1 ± 106.2 | 51.6 ± 103.6 | 0.61 |
| Calcium spur in Zone 2, % (n) | 23.1 (24) | 14.4 (15) | 0.15 |
| Sinotubular junction length, mm | 21.0 ± 2.7 | 21.9 ± 3.3 | 0.03 |
| Distance to RCA, mm | 15.1 ± 3.6 | 15.9 ± 2.9 | 0.07 |
| Distance to LCA, mm | 14.1 ± 3.1 | 14.3 ± 3.2 | 0.65 |
| Area of AA, mm2 | 461.9 ± 97.4 | 486.6 ± 107.9 | 0.08 |
| Area derived AA diameterd, mm | 23.9 ± 2.8 | 24.8 ± 2.6 | 0.02 |
| Perimeter of AA, mm | 77.0 ± 7.9 | 79.1 ± 9.5 | 0.08 |
| Perimeter derived AA diametere, mm | 24.5 ± 2.5 | 25.3 ± 2.6 | 0.02 |
| Cover indexf | 1.5 ± 6.6 | −0.9 ± 6.4 | 0.01 |
Treshold 500–600 HU.
From AA to coronary ostia.
subannular, from AA 10 mm in left ventricular outflow tract.
Based on CTeff = 2 × √(circumferential area/π).
Based on CTeff = P/π.
Based on [(nominal THV diameter − measured diameter)/nominal THV diameter] × 100.
MSCT: multislice computed tomography; RCA: right coronary artery; LCA: left coronary artery; AA: aortic annulus.
Periprocedural data
There were no significant differences between study and control groups regarding baseline haemodynamic and periprocedural parameters. General anaesthesia (study group versus control group: 55/104; 52.9% vs 68/104; 65.4%; P = 0.063) or conscious sedation (49/104; 47.1% vs 36/104; 34.6%; P = 0.063) was utilized for THV procedures.
Device success according to Valve Academic Research Consortium definitions was achieved in 94.2% (98/104) vs 98.1% (102/104) in study and control groups, respectively (P = 0.157). Reasons for failure to reach this composite end-point in the study group were one conversion to open-heart surgery due to device migration, one annular rupture with intraprocedural death and four cases of moderate PVL including 2 valve-in-valve procedures, one with a CoreValve and one with a Sapien 3, with good procedural outcome. In the control group, intervention was classified as unsuccessful for 2 patients with post-procedural PVL ≥2.
Procedure time (94.0 ± 46.9 vs 94.8 ± 38.0 min; P = 0.897), fluoroscopy time (19.3 ± 9.4 vs 19.4 ± 9.1 min; P = 0.887) and the amount of contrast agent used (162.6 ± 70.3 vs 154.8 ± 73.0 ml; P = 0.428) showed no significant differences. In the study group, significantly more balloon predilatation (93/103; 90.3% vs 56/104; 53.8%; P < 0.001) and post-dilatation (49/103; 47.6% vs 21/104; 20.2%; P < 0.001) due to residual PVL was performed.
Detailed periprocedural data are summarized in Table 3.
Periprocedural data
| Symetis (n = 104) | Sapien 3 (n = 104) | Δ | P-value | |
|---|---|---|---|---|
| Baseline EOA, cm2 | 0.8 ± 0.2 | 0.8 ± 0.2 | −0.0 | 0.651 |
| Baseline peak gradient, mmHg | 59.6 ± 24.5 | 63.3 ± 25.0 | −3.8 | 0.269 |
| Baseline mean gradient, mmHg | 35.9 ± 16.6 | 37.6 ± 16.7 | −1.7 | 0.443 |
| Procedure timea, min | 94.0 ± 46.9 | 94.8 ± 38.0 | −0.8 | 0.897 |
| Fluoroscopy time, min | 19.3 ± 9.4 | 19.4 ± 9.1 | −0.2 | 0.887 |
| Contrast agent, ml | 162.6 ± 70.3 | 154.8 ± 73.0 | 7.8 | 0.428 |
| Valve sizeb, % (n) | ||||
| S/23 mm | 35.6 (37) | 40.4 (42) | −4.8 | 0.456 |
| M/26 mm | 38.5 (40) | 49.0 (51) | −10.6 | 0.138 |
| L/29 mm | 25.9 (27) | 10.6 (11) | 15.4 | 0.005 |
| Predilatation, % (n) | 90.3 (93)c | 53.8 (56) | 36.4 | <0.001 |
| Post-dilatation, % (n) | 47.6 (49)c | 20.2 (21) | 27.4 | <0.001 |
| Anaesthesia, % (n) | ||||
| General anaesthesia | 52.9 (55) | 65.4 (68) | −12.5 | 0.063 |
| Conscious sedation | 47.1 (49) | 34.6 (36) | 12.5 | 0.063 |
Median values to account for outliers.
Symetis: size S: annulus diameter (AD) 21–23 mm, size M: AD 23–25 mm, size L: AD 25–27 mm; Sapien 3: 23 mm: AD 20.7–23.4 mm, 26 mm: AD 23.4–26.4 mm, 29 mm: AD 26.2– 29.5 mm.
One missing case.
EOA: effective orifice area; LVOT: left ventricular outflow tract.
Echocardiographic outcome data
In the study group, peak and mean transvalvular gradients as determined by TTE prior to discharge decreased from 59.6 ± 24.5 to 14.2 ± 5.7 mmHg and 35.9 ± 16.6 to 7.3 ± 2.8 mmHg (both P < 0.01). EOA increased from 0.8 ± 0.2 to 2.0 ± 0.4 cm2 (P < 0.01) compared to baseline values. Corresponding data in the control group were decrease of peak and mean transvalvular gradients from 63.3 ± 25.0 to 22.6 ± 6.8 mmHg and 37.6 ± 16.7 to 11.8 ± 3.5 mmHg (both P < 0.01), increase of EOA from 0.8 ± 0.2 to 1.7 ± 0.4 cm2 (P < 0.01). When comparing peak/mean transvalvular gradients between both groups, values were significantly lower in the study group. Regarding resultant EOAs, no significant differences were found between study and control groups (Table 4, Figs 1 and 2). PVL ≥moderate was present in 5 of 104 (4.8%) cases in the study group and in 2 of 104 (1.9%) cases in the control group (P = 0.257) (Fig. 3).
Clinical outcome and echocardiographic results at discharge
| Symetis (n = 104) | Sapien 3 (n = 104) | Δ | P-value | |
|---|---|---|---|---|
| All-cause mortality (30 days), % (n) | 3.9 (4) | 0.9 (1) | 2.8 | 0.317 |
| Cardiovascular or unknown, % (n) | 3.9 (4) | 0.9 (1) | 2.8 | 0.317 |
| Stroke (disabling), % (n) | 1.9 (2) | 1.9 (2) | 0.0 | 1.000 |
| Myocardial infarction, % (n) | 1.9 (2) | 0.9 (1) | 0.9 | 0.564 |
| Bleeding (major/life threatening), % (n) | 3.9 (4) | 8.7 (9) | −4.8 | 0.166 |
| Major vascular complications, % (n) | 1.9 (2) | 4.8 (5) | −2.9 | 0.257 |
| Acute kidney injury (AKINa 2, 3), % (n) | 2.9 (3) | 1.9 (2) | 0.9 | 0.655 |
| Permanent pacemaker implantationb,% (n) | 10.6 (11) | 16.4 (17) | −5.7 | 0.239 |
| Device successc, % (n) | 94.2 (98) | 98.1 (102) | −3.8 | 0.157 |
| Early safetyd, % (n) | 85.6 (89) | 84.6 (88) | 1.0 | 0.847 |
| Intensive care unit stay, days | 1.8 ± 2.1 | 1.9 ± 1.5 | −0.2 | 0.397 |
| In hospital stay, days | 9.9 ± 5.9 | 10.1 ± 5.9 | −0.3 | 0.725 |
| EOAe, cm2 | 2.0 ± 0.4 | 1.7 ± 0.4 | 0.3 | 0.063 |
| Peak gradientf, mmHg | 14.2 ± 5.7 | 22.6 ± 6.8g | −8.4 | <0.001 |
| Mean gradientf, mmHg | 7.3 ± 2.8 | 11.8 ± 3.5g | −4.6 | <0.001 |
| Paravalvular leakage ≥ moderate, % (n) | 4.8 (5) | 1.9 (2) | 3.1 | 0.257 |
AKIN: Acute Kidney Injury Network; VARC-2 definitions.
Permanent pacemaker implantation due to atrioventricular block Grade 3 or rapid progressive left bundle branch block.
Device success: absence of procedural mortality, correct positioning of a single prosthetic heart valve into the proper anatomical position, intended performance of the prosthetic heart valve (no prosthesis–patient mismatch and mean aortic valve gradient <20 mmHg or peak velocity <3 m/s and no moderate or severe prosthetic valve regurgitation).
Early safety at 30 days: all-cause mortality (at 30 days), all stroke (disabling and non-disabling), life-threatening bleeding, acute kidney injury Stage 2 or 3 (including renal replacement therapy), coronary artery obstruction requiring intervention, major vascular complication, valve-related dysfunction requiring repeat procedure (BAV, TAVI or SAVR).
Intraprocedural TOE.
TTE at discharge.
Two missing cases.
EOA: effective orifice area; BAV: balloon aortic valvuloplasty; TAVI: transcatheter aortic valve implantation; TTE: transthoracic echocardiography; SAVR: surgical aortic valve replacement; TOE: transoesophageal echocardiography.
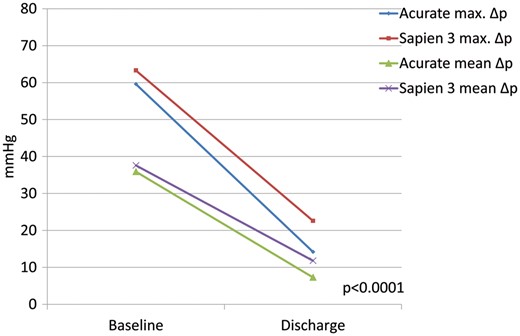
Pre- and postoperative values of study and control group for transvalvular maximum and mean pressure gradients (P-value for maximum/mean gradients of study against control group at discharge).
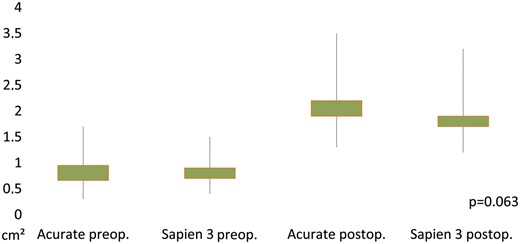
Pre- and postoperative values of study and control group for effective orifice area (P-value for effective orifice area of study against control group at discharge). preop.: preoperative; postop.: postoperative.
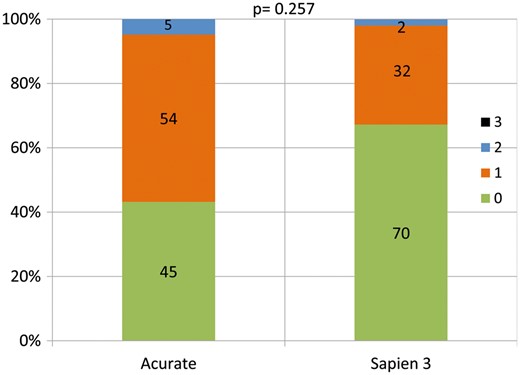
Distribution of post-interventional severity of paravalvular leakage in study and control group (P-value for rate of paravalvular leakage ≥Grade II of study against control group at discharge).
Clinical outcome data
All-cause 30-day mortality was 3.9% (4 of 104) in the study group and 0.9% (1 of 104) in the control group (P = 0.317). In the study group, 1 patient died due to intraprocedural annular rupture following balloon post-dilatation and 3 patients due to post-procedural multiorgan failure. In the control group, 1 patient died from sudden-onset electromechanical dissociation with unsuccessful cardiopulmonary resuscitation on postoperative Day 5. Regarding Valve Academic Research Consortium-adjudicated clinical end-points stroke (2/104 vs 2/104; P = 1.0), myocardial infarction (2/104 vs 1/104; P = 0.564) and acute kidney injury (3/104 vs 2/104; P = 0.655), no significant differences were found between the 2 groups.
Also regarding major/life-threatening bleeding complications (3.9% vs 8.7%; P = 0.166), post-procedural pacemaker implantation rates (10.6% vs 16.4%; P = 0.239) and major access site complications (2/104 vs 5/104; P = 0.257), no significant differences were found. Detailed clinical and echocardiographic outcome data are summarized in Table 4.
DISCUSSION
Main findings
In this comparative study of latest-generation SE-THV and BE-THV fist evidence was found that ‘traditional’ drawbacks of first-generation TAVI systems may be no longer applicable in current systems. Outcomes regarding PPM implantation rates and severity of residual PVL as well as early safety were similar between SE-THV and BE-THV systems in this study. Post-interventional transvalvular gradients showed superiority of the utilized SE-THV, even if used in smaller aortic annuli.
Currently, indications for TAVI procedures are extended to intermediate-risk patients and the Placement of AoRtic TraNscathetER Valves (PARTNER) II trial presented similar outcomes in intermediate-risk patients after TAVI compared with surgical aortic valve replacement regarding death and disabling stroke. Furthermore, superiority of TAVI in these patients was shown for rates of acute kidney injury, sever bleeding and new-onset atrial fibrillation. Nevertheless, surgical aortic valve replacement still results in lower rates of PVL ≥moderate and postoperative PPM implantation [8, 21]. Since TAVI can be expected to become treatment of choice for intermediate-risk patients in the mid-term, and already is in some European countries [17], it is a necessity to achieve the same excellent results that are established in surgical aortic valve replacement. Since high rates of severe complications during and after TAVI procedures like annular rupture, device malpositioning and/or embolization and coronary obstruction seem to have been overcome, a new class of complications like postoperative PPM and PVL rates seems to have come into focus [22]. To improve the outcomes regarding these complications, rigorous evaluation of clinical results from observational series and national registries for THV systems are required. In this observational comparative series, we found that the ACURATE neo® shows similar results regarding PPM implantation rates and PVL compared to next-generation BE-THV and a significant reduction compared to first-generation SE-THV.
A substudy of the PARTNER I trial in 2015 presented a PPM implantation rate for the first-generation BE-THV Sapien XT of 8.8% and an association of post-interventional PPM implantation with longer duration of hospital stay and higher rates of rehospitalization and mortality [23]. For the first-generation SE Core Valve THV PPM implantation rates of 19.8% at 30 days and 22.3% at 1 year were reported [8]. Also PVL ≥moderate was more frequent in first-generation SE-THV with 18.3% for the CoreValve THV and 9.1% for the Sapien XT [9, 24]. Those results led to a certain reluctance for the implantation of first-generation SE-THV, except in special anatomical scenarios in which THV with supra-annular valve function may offer superior haemodynamic outcomes, e.g. in small aortic annuli. With the herein presented results, this strategy has to be reconsidered.
PPM implantation rate of 10.6% is exceptionally low for an SE-THV compared to historical data with the same class of THV and confirms results from previous reports evaluating this type of THV [14]. Evidence of an increase in PPM rates for the latest-generation BE-THV compared to the previous iteration is confirmed by our findings, even if the THV was implanted rather high [25]. Reasons for the comparably low PPM rate may be the relatively high device position with only a minimum of stent material extending into the left ventricular outflow tract, therefore not affecting the conduction system. Especially in light of the possible long-term consequences of PPM, which have to be avoided in intermediate-risk patients with a reasonable life expectancy, like frequent device exchanges for battery exhaustion, device/lead infection or pacemaker-induced cardiomyopathy, these outcomes are promising.
With a PVL ≥moderate rate of 5.0%, PVL rates of SE-THV are significantly decreased in this study. It has to be emphasized that for the SE-THV procedures significantly more pre- and post-ballooning was performed and that significant more mild PVL was observed (54/104 vs 32/104 patients). Pre-ballooning is our standard operating procedure for the vast majority of patients treated with this type of SE-THV, except for cases with minimal valvular calcification. In contrast, pre-ballooning with the BE-THV in the control group was only performed in cases with heavily calcified valves. Moreover, the Symetis valve was used in smaller aortic annuli, which may lead to a better sealing behaviour compared to larger annuli, which were found in the Sapien 3 group. Even if mild PVL does not impair clinical outcomes, close echocardiographic follow-up examination should be mandatory to detect early deterioration of PVL in SE-THV. Also, post-ballooning was performed more frequently in the study group, mainly for residual significant PVL. This is a procedural characteristic known from other series with comparative investigation of SE versus BE-THV [9]. However, compared to former generations of SE-THV, the post-dilatation rate observed in the present analysis compares favourably. The reasons for this remain elusive at present but may be explained by patient selection, increased physician experience compared to historical series of SE-THV, optimized THV sizing algorithms, more appropriate choice of size and type of pre-dilatation balloons and enhanced technical properties of this compared to former iterations of SE-THV. Clinically, however, the increased need for both pre- and post-ballooning in the study group did not result in inferior outcomes compared with the control group. Compared to other registries, the proportion of women in the study and control group is high. This is due to the fact that the Symetis THV has been implanted in rather small aortic annuli (see Table 2), which more frequently are found in women. This institutional policy follows the idea that self-expanding THV can protect against high post-procedural transvalvular pressure gradients and disadvantageous EOA in small aortic annuli because of stent absence. Recent evidence suggests this principle to be reasonable [26].
Besides the relief from former drawbacks of SE-THV, we found that haemodynamic superiority in terms of post-interventional transvalvular pressure gradient is preserved without resulting in significant better EOAs. Equal to all new TAVI devices data of long-term durability have to be bided. For the Symetis ACURATE neo® THV, in particular, because the valve tissue was changed from a porcine bioprosthesis (used in the TA device) to a porcine pericardium valve.
Limitations
Typical limitations for a retrospective, single-centre study with limited patient numbers apply [17]: patients were not randomized to the respective treatment groups and even though analysis of baseline patient characteristics did not reveal statistically significant intergroup differences following careful matching, results may have been biased by hidden confounders. Even if severity of aortic annuli calcification was similar between both groups, aortic annulus size differed which may lead to bias regarding post-procedural PVL. Furthermore, MSCT parameters were not included in the matching process. Mortality and device success rates are low in this study, leading to a lack of power regarding these variables. Therefore, the results should be interpreted with caution and long-term follow-up should be awaited. However, patients in the study and control groups were treated during the same period. Thus, the impact of learning curves should be limited.
CONCLUSIONS
In this study, next-generation SE-THV presented superiority in terms of post-interventional haemodynamics compared to next-generation BE-THV, already known from first-generation TAVI systems, without presenting former drawbacks: rate of postoperative PPM implantation and severity of residual PVL were similar to BE-THV. These results will have to be confirmed in larger patient numbers for further clinical evaluation and before general recommendations can be made. Furthermore, mortality and device success rates have to be interpreted carefully, given the sample size and follow-up time of 30 days.
Conflict of interest: Ulrich Schäfer is a proctor for Symetis SA and Medtronic, is a consultant to Medtronic and Symetis SA and has received lecture fees from Medtronic. Lenard Conradi is a proctor for Symetis SA, Medtronic and JenaValve and proctor, advisory board member and consultant for Edwards Lifesciences. Moritz Seiffert has received travel compensation and speaker honoraria from Symetis SA, JenaValve and Edwards Lifesciences. Andreas Schaefer has received travel compensation from Symetis SA. All others authors have nothing to disclose.
