


Abstract
Our goal was to investigate whether pleural adhesions identified during an operation can induce adverse events. We investigated the outcome of major lung resection in patients with pleural adhesions encountered on entry into the pleural cavity.
We conducted a retrospective analysis of 144 patients undergoing major lung resection over a period of 9 months. Recorded data included demographics, comorbidities, surgical data, fluid volume drainage (on postoperative days [POD] 1 and 2 and in total), the overall and pleural space-associated morbidity (empyema, prolonged air leak or drainage, space issues), 30-day and late mortality rates. Patients were grouped according to the presence or not of adhesions observed when we entered the chest.
Differences between patients without versus patients with adhesions were recorded for operative time (138 vs 169.3 min, P < 0.02), postoperative drainage on POD1 and POD2 (328.6 vs 478.5 ml, P < 0.01 and 214 vs 378 ml, P < 0.01 respectively), duration of air leak (1 vs 2 days, P = 0.03), duration of chest tube stay (2 vs 4 days, P < 0.01) and pleural morbidity (21.1% vs 38.8%, P = 0.02). There were no differences recorded in the 2 groups on conversion rates (2.5% vs 14.3%, P = 0.46), 30-day (1.1% vs 4.1%, P = .73) and late deaths (log-rank, P = 0.70). Pleural morbidity differed if the chest tube was removed on or earlier than POD2 (57.9% vs 36.9%, P = 0.02). We also calculated differences between those patients with adhesions involving the lower chest (55.1%) versus the rest of the group and specifically drainage on POD1 and POD2 (540.9 vs 372.1 ml, P < 0.01 and 392.5 vs 261 ml, P = 0.02, respectively) and pleural morbidity (46.4% vs 28.6%, P < 0.01). Logistic regression identified that firm, extensive adhesions, present in the lower third of the pleural cavity, are important predictors of pleural morbidity.
Patients undergoing major lung resection who have pleural adhesions have an increased incidence of adverse surgical outcomes and higher pleural morbidity.
INTRODUCTION
Under normal conditions, the pleural mesothelium exhibits the ability to recycle fluid through several mechanisms [1, 2]. During inflammation, this ability is lost, leading to the accumulation of pleural fluid [3, 4].
Formation of adhesions is usually the end result of an inflammatory process [5]. Evidence indicates that the presence of adhesions interferes with the postoperative recycling of fluid [6], leading to the decreased ability of the pleura to recycle fluid.
The presence of pleural adhesions adds a technical challenge and increases the risk of conversion to open surgery [7–9]. It correlates with bleeding and prolonged air leak [8, 10–12]. Apart from these observations, it is still unclear whether adhesions interfere with the recovery of operated patients.
The aim of the present study was to compare the outcomes of patients undergoing major lung resections with and without the presence of pleural adhesions observed intraoperatively.
PATIENTS AND METHODS
Study design
We reviewed retrospectively the operative notes from 144 consecutive patients who underwent a major lung resection at our institute (without previous operative procedures in the chest) over a period of 9 months (August 2014–April 2015) associated with the presence of pleural adhesions. Various outcome measures were compared between the patients with and without pleural adhesions. Results from this comparison triggered further investigations into differences in the topography of the adhesions and the timing of the removal of the intercostal chest drain (ICD).
Preoperative management of patients
Patients were referred to our department following discussions at our institute’s multidisciplinary team meeting. A chest computed tomography scan not older than 6 weeks and a positron emission tomography scan were obtained in all patients. Functional operability was determined according to the European guidelines [5]. Additional functional testing such as a cardiopulmonary exercise test or a stair-climbing assessment was performed as needed. Performance status was determined for all patients after assessment of a full medical history and clinical evaluation.
Operational details
Five board qualified general thoracic surgeons who perform an acceptable number of anatomical lung resections per year performed all operations. All video-assisted thoracoscopic surgery (VATS) cases were performed with a bi- or triportal approach.
Postoperative management and follow-up of patients
All patients were managed in a dedicated thoracic ward according to standardized protocols of care including early mobilization, venous thrombosis prophylaxis and chest physiotherapy.
Postoperative pain was controlled with the continuous infusion of local anaesthetics through paravertebral catheters. Additional systemic analgesia was administered to achieve a numeric pain score less than 3 (scale range 0 [no pain] to 10 [unbearable pain]).
A single chest drain was left in situ after all lung resections, connected to a digital drainage system with a standardized removal protocol at <400 ml/day of fluid drainage and <20 ml/min air leak for at least 12 h. Standard postoperative and discharge guidelines were applied to all patients.
Our department’s follow-up protocol included postoperative outpatient consultations at 6 weeks, every 6 months for the first 2 years and annually thereafter for 5 years (depending on the date of the operation and the disease).
Patient data
The parameters investigated, apart from the demographics, included comorbidities smoking habits, performance status, operative data (operative time, length of staples used to complete the fissure, extent and side of resection, VATS or open approach), conversion rates, morbidities, air leak duration, drainage characteristics (fluid drainage at postoperative day [POD] 1 and POD2), duration of insertion of the ICD, number and time after the initial operation of reoperations, length of stay (LOS) in the hospital and the mortality rate (30-day and late deaths).
Overall morbidity was categorized into respiratory (including atelectasis, pneumonia, respiratory failure or acute respiratory distress syndrome), cardiac (including atrial fibrillation, hypotension requiring vasoconstrictors, myocardial infarction or heart failure), pleural (including prolonged air leak, pleural effusion drainage ≥400 ml/day, empyema, presence of persistent pleural pocket or chylothorax), surgical (including technical surgical adverse events such as postoperative bleeding, lung infarction or lung herniation) and variable complications (including all the rest of the types of morbidities i.e. renal or gastrointestinal issues). Thirty-day mortality included deaths during the operation.
Adhesion data
Pleural adhesions were assessed from the operative notes according to the extent of involvement of each lobe surface calculated as a percentage of the total pleural cavity. All patients with adhesions were included in the study. The topography of the adhesions (involving or not involving parts of the lower pleural cavity) and the severity of the adhesions (loose or firm and vascular) were also noted.
Grouping of patients
Patients were divided into 2 main groups with or without pleural adhesions.
Study permission
The study was reviewed and approved by the Research and Innovation Department at Leeds Teaching Hospitals NHS Trust, which waived the need of review by a NHS Research Ethics Committee.
Statistical analysis
Statistical analysis was performed with SPSS version 22.0 (Chicago, IL, USA).
All numerical data were investigated for normality of distribution with the Shapiro–Wilk normality test (normally distributed when P > 0.05) and Q–Q plots (acceptable figures for normality of distributed) and were presented as mean ± standard deviation. Skewed data were presented as the median (lower to higher value). Categorical data were presented as percentages.
Statistical significance was determined with the Student t-test, the Mann–Whitney test (when the P-value with the Levene test was <0.05 and not normally distributed according to previous normality testing), the chi-square test (for 2 × 2 tables: when there were no cells of expected value <5 were calculated, higher than 2 × 2 tables) and the Fisher exact tests (when cells had an expected value of <5). The statistical significant level was set to a P-value < 0.05.
Bivariate correlations were generated with Pearson’s test and were reported as an r value with 95% confidence intervals (CI) apart from the P-value, after applying the bootstrap test at 1000 samples. A typical logistic regression analysis after confirming good fit of data was performed to determine predictors (independent variables) of pleural morbidity (dependent variable based on the previous analysis). Log-rank was used to investigate differences in the Kaplan–Meier survival curves. The last date investigated for survival was 20 May 2016.
RESULTS
Main characteristics
During the study period, a major lung resection was performed on 95 (66%) patients without adhesions and 49 (34%) patients with adhesions. There were 62 male patients (43.1%) and 102 smokers or ex-smokers (70.8%). A performance status of 0 and 1 was recorded in 133 (91.3%) patients. A lobectomy was performed in 134 patients (93.1%), a pneumonectomy in 3 (2.1%) and a bilobectomy in 7 (4.9%) patients. A right-sided operation was performed in 80 (55.6%) patients. VATS was the main approach (114 patients, 79.2%) with a conversion rate of 6.14% (for the study period) and of no attribution to the presence of adhesions.
In 36 (73.5%) patients, the adhesions were firm; in 30 patients (61.2%) these were divided with an energy device or diathermy. Extrapleural dissection was necessary in 5 cases. The mean percentage of area occupied by adhesions was 43.47 ± 20.5 (lowest value: 20%, highest value: 90%).
Nine patients were excluded from the study because of incomplete data on the presence of adhesions. None of the patients required intraoperative or postoperative blood transfusions.
Comparison of the 2 groups
The 2 groups were similar in terms of age, co-morbidities, preoperative pulmonary function, performance status, smoking habit, disease stage and body mass index (Table 1). The approach, the extent and the type of the resections were also similar between the 2 groups (Table 1).
Patient and operative characteristics based on the presence of adhesions when the pleural cavity is first entered
| No adhesions present (n = 95) | Presence of adhesions (n = 49) | P-value | |
|---|---|---|---|
| Age in years (mean ± SD) | 69.2 ± 9.2 | 69.6 ± 10.1 | 0.838a |
| Gender (n, %) | |||
| Male | 33 (34.7) | 29 (59.2) | 0.126b |
| Female | 62 (65.3) | 20 (40.8) | |
| Pulmonary function (mean ± SD) | |||
| FEV1 | 87.9 ± 26.9 | 80.5 ± 30.5 | 0.103a |
| DLCO | 66.9 ± 26.6 | 60.9 ± 24.4 | 0.178a |
| ASA status (median, lower–higher) | 2 (1–3) | 2 (1–3) | 0.998c |
| Smoking habit (n, %) | |||
| Smokers/ex-smokers | 66 (69.5) | 36 (73.5) | 0.383b |
| Non-smokers | 29 (30.5) | 13 (26.5) | |
| Disease stage (n, %) | |||
| I | 33 (34.7) | 19 (38.8) | 0.510b |
| II | 35 (36.8) | 24 (49) | |
| >II | 8 (8.4) | 2 (4.1) | |
| Metastatic, benign | 19 (28.4) | 4 (8.2) | |
| Comorbidities (n, %) | |||
| Respiratory | 62 (65.3) | 32 (65.3) | 0.266b |
| Cardiac | 13 (13.7) | 8 (16.3) | |
| Other | 20 (21.1) | 9 (18.4) | |
| BMI in kg/m2 (mean ± SD) | 30.2 ± 15.4 | 28.9 ± 14.2 | 0.985a |
| VATS approach (n, %) | 79 (83.2) | 35 (71.4) | 0.130b |
| Extend of resection (n, %) | |||
| Lobectomy | 86 | 48 | 0.186b |
| Pneumonectomy | 3 | 0 | |
| Bilobectomy | 6 | 1 | |
| Lobectomy type (n, %) | |||
| Upper | 53 (55.8) | 30 (61.2) | 0.838b |
| Lower | 31 (32.6) | 16 (32.6) | |
| Middle | 2 (2.1) | 2 (4.1) | |
Student t-test.
Chi-square test.
Mann–Whitney test.
SD: standard deviation; FEV1: forced expiratory volume in the first second; DLCO: diffusing capacity of the lungs for carbon monoxide; ASA: American Society of Anesthesiologists; BMI: body mass index; VATS: video-assisted thoracoscopic surgery.
The duration of the operation, as expected, was longer in the group with adhesions (P < 0.01), and more staples were used overall (P < 0.01) in this group (Table 2).
Surgical data and outcomes according to the presence of adhesions when the pleural cavity is first entered
| No adhesions present (n = 95) | Presence of adhesions (n = 49) | P-value | |
|---|---|---|---|
| Operative time, min (mean ± SD) | 138 ± 54.6 | 169.3 ± 61.2 | <0.001a |
| Staple length, mm (mean ± SD) | 145.5 ± 95 | 174 ± 61.2 | <0.001a |
| Drainage POD1, ml (mean ± SD) | 328.6 ± 220.7 | 478.5 ± 232.8 | <0.001a |
| Drainage POD2, ml (mean ± SD) | 214.6 ± 167.8 | 338.5 ± 212.3 | <0.001a |
| ICD insertion, days (median, lower–higher) | 2 (0–15) | 4 (0–26) | <0.001b |
| Air leak duration, days (median, lower–higher) | 1 (0–15) | 2 (0–26) | 0.026b |
| Conversions (n, %VATS) | 2 (2.5) | 5 (14.3) | 0.461c |
| Reoperations (n, %) | 8 (8.4) | 9 (18.4) | 0.052d |
| Time after initial operation in days (median, lowest–highest) | 17 (5–30) | 13.5 (2–90) | 0.541b |
| LOS in hospital (median, lower–higher) | 5 (3–24) | 7 (4–23) | 0.003b |
| Morbidity (n, %) | |||
| Overall | 43 (45.3) | 25 (51.0) | 0.599d |
| Pleural | 20 (21.1) | 19 (38.8) | 0.016d |
| Effusion/empyema | 4 | 10 | 0.038d |
| Prolonged air leak | 14 | 8 | |
| Space/chylothorax | 2 | 1 | |
| 30-Day mortality rate (n, %) | 1 (1.1) | 2 (4.1) | 0.733c |
Student t-test.
Mann–Whitney test.
Fisher exact test.
Chi-square test.
SD: standard deviation; POD: postoperative day; ICD: intercostal chest drain; VATS: video-assisted thoracoscopic surgery; LOS: length of stay.
Surgical data and outcomes according to the topography of adhesions in the pleural cavity
| Not involving lower parts (n = 21) | Involving lower parts (n = 28) | P-value | |
|---|---|---|---|
| Operative time, min (mean ± SD) | 156.4 ± 49.2 | 178.2 ± 68.6 | 0.223a |
| Stapler length, mm (mean ± SD) | 202.4 ± 100.7 | 188.4 ± 105.2 | 0.177a |
| Drainage on POD1, ml (mean ± SD) | 372.1 ± 168.1 | 540.9 ± 250.3 | 0.007a |
| Drainage on POD2, ml (mean ± SD) | 261.8 ± 137.2 | 392.5 ± 239.8 | 0.018a |
| ICD insertion, days (median, lower–higher) | 3 (2–21) | 3 (2–26) | 0.778b |
| Air leak duration in days (median, lower–higher) | 2 (0–21) | 2 (0–26) | 0.564b |
| Conversions (n, %VATS) | 1 (5.5) | 4 (23.5) | 0.031c |
| Reoperations (n, %) | 4 (19) | 5 (17.9) | 0.600c |
| Time after initial operation in days (median, lowest–highest) | 47 (17–90) | 5 (2–45) | 0.061b |
| LOS in hospital (median, lower–higher) | 6 (4–22) | 7 (4–23) | 0.299b |
| Morbidity (n, %) | |||
| Overall | 11 (52.4) | 14 (50) | 0.599d |
| Pleural | 6 (28.6) | 13 (46.4) | 0.005d |
| Effusion/empyema | 1 | 9 | 0.055d |
| Prolonged air leak | 5 | 3 | |
| Space/chylothorax | 0 | 1 | |
| 30-Day mortality rate (n, %) | 1 (4.8) | 1 (3.6) | 0.571c |
Student t-test.
Mann–Whitney test.
Fisher exact test.
Chi-square test.
SD: standard deviation; POD: postoperative day; ICD: intercostal chest drain; VATS: video-assisted thoracoscopic surgery; LOS: length of stay.
The amount of fluid drainage was higher in the group with adhesions on POD1 (P < 0.01) and POD2 (P < 0.01). The duration of the air leak was also longer in the group with adhesions (P = 0.03), and the ICD was removed after a longer period of time in the group with adhesions (P < 0.01).
The overall morbidity was similar between the 2 groups; however, more pleural complications were noted in the group with adhesions (P = 0.02). High fluid drainage was the main cause of pleural-related morbidity in this group, whereas a prolonged air leak was the reason in the group without adhesions (P = 0.04).
More reoperations in total were observed in the group with adhesions (P = 0.052). The main reason for this finding was the presence of persistent pleural space (3 cases) with or without suspected pleural space infection; 1 case required reoperation for postoperative bleeding; 1 for chylothorax; 1 for lung infarction and 1 for a prolonged air leak. In the non-adhesion group, reoperations were necessary in 4 cases with remaining pleural pockets with or without suspected pleural infection: 1 case with prolonged air leak, 2 cases with postoperative bleeding and 1 case with lung herniation. No bronchopleural fistulas were noted. The timing of reoperations was similar in the 2 groups (Table 2).
Despite the fact that a significant conversion rate was noted in the group with adhesions (14%), the conversion rate between the 2 groups was similar (P = 0.46). Conversions included 3 cases of bleeding and 2 cases of inability to excise the tumour completely in the non-adhesion group. The same causes necessitated conversions in the adhesion group. No conversion was necessary due to the presence of adhesions.
The in-hospital LOS was longer in the group with adhesions (P < 0.01).
There was no difference in the 30-day mortality rate (P = 0.73). Two patients with adhesions died of chest infections whereas 1 patient in the non-adhesion group died of acute respiratory distress syndrome.
Bivariate correlations showed a positive correlation between the presence of adhesions and effusion on POD1 (0.280, P < 0.01, CI: 0.139–0.428) and POD2 (0.287, P < 0.01, CI: 0.134–0.429), the duration of air leaks (0.186, P < 0.01, CI: 0.077–0.429), length of time the ICD was inserted (0.270, P < 0.01, CI: 0.120–0.419) and pleural complications (0.186, P = 0.03, CI: 0.017–0.350).
Outcome according to the topography of the adhesions
In the group with adhesions, the amount of fluid drainage was higher on POD1 (P < 0.01) and POD2 (P = 0.01) when the adhesions involved the lower part of the pleural cavity (Table 3).
The overall morbidity was similar between the 2 groups; however, more pleural complications were noted when the adhesions involved the lower pleural cavity (P < 0.01). Again, the pleural morbidity was expressed as prolonged pleural effusion drainage rather than a prolonged air leak (P = 0.055).
In this subgroup, more conversions were noted (23.5% vs 5.5%, P = 0.03). The necessity for reoperation was similar between the 2 groups, but in the group in which the lower pleural cavity was affected, the operation was performed in a more expeditious manner.
In-hospital LOS and the 30-day mortality rates were similar, irrespective of the topography of the adhesion.
Bivariate correlations showed a positive correlation between the presence of adhesions over the lower pleural cavity and effusion on POD1 (0.363, P < 0.01, CI: 0.109–0.551), POD2 (0.316, P = 0.03, CI: 0.103–0.503) and the length of time the ICD was inserted (0.359, P = 0.02, CI: 0.207–0.319).
Timing of ICD removal on the outcome of patients with adhesions
Based on the aforementioned findings, further analysis was performed to identify the appropriate timing for removal of the ICD from these patients. For this reason, we initially performed a receiver operating characteristic analysis in the group with adhesions. The target point was the pleural morbidity, and the predictor test was the length of time the ICD was in place (area under the curve = 0.788) (CI: 0.611–0.924, P = 0.002). A cut-off point of 2.5 days for ICD removal was calculated to have 78% sensitivity and 75% specificity for prediction of pleural morbidity.
Further analysis (Table 4
Outcome of patients according to timing of removal of intercostal chest drain
| ≤2.5 days (n = 19) | >2.5 days (n = 30) | P-value | |
|---|---|---|---|
| Morbidity (n, %) | |||
| Overall | 14 (73.7) | 11 (36.7) | 0.030a |
| Pleural | 11 (57.9) | 8 (26.7) | 0.040a |
| Reoperations (n, %) | 4 (21.1) | 5 (16.7) | 0.221b |
| LOS in hospital, days (median, lower–higher) | 7 (4–23) | 5 (4–22) | 0.035c |
| 30-Day mortality rate (n, %) | 1 (5.2) | 1 (3.3) | 0.683b |
Chi-square test.
Fisher exact test.
Mann–Whitney test.
LOS: length of stay.
Independent predictors of pleural morbidity in patients with adhesions
The type of adhesion (firm) was the most important predictor (P = 0.019, Exp(B) = 4.353, 95% CI 1.686–27.633) followed by the topography (involving the lower chest) of the adhesions (P = 00.043, Exp(B) = 1.439, 95% CI 1.009–6.700) and the extent (%) of the adhesions in the chest (P = 0.037, Exp(B) = 1.008, 95% CI 1.002–1.037) in the model with a Cox and Snell R2 = 0.59, Nagelkerke R2 = 0.65 and the Hosmer and Lemeshow test P = 0.76.
Survival
Survivorship was not affected by the presence of adhesions (Fig. 1). Late deaths were attributed to the progression of the cancer. In 1 case, the patient committed suicide 6 months after the operation.
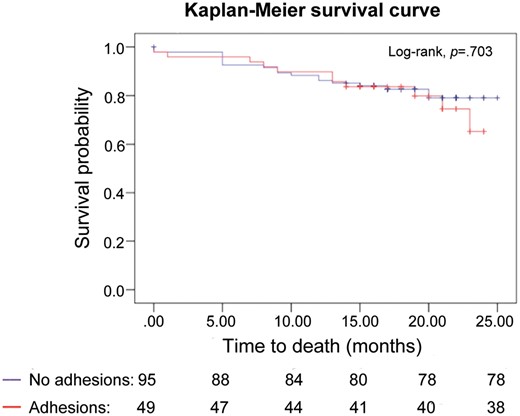
Kaplan–Meier survival curves of patients with and without adhesions when the pleural cavity is first entered.
DISCUSSION
The main finding of our present study is that the presence of pleural adhesions during major lung resections may predict increased pleural fluid drainage on POD1 and POD2, air leak duration, ICD insertion, in-hospital LOS and pleural morbidity. Early chest tube removal (<POD2) in these patients should be carefully reconsidered.
Additionally, apart from the expected prolonged operating time, more reoperations are necessary, although conversion rates are statistically similar and the conversions are performed irrespective of the presence of adhesions.
In our study, a large number of patients with adhesions were operated on, suggesting that adhesions are not an uncommon finding. The operative outcome was worse if adhesions involved the lower pleural cavity, with increased pleural complications, greater amount of pleural fluid drainage and longer ICD insertion. Based on the regression model, extensive, firm adhesions occupying the lower chest are predictive of increased pleural morbidity.
It is widely perceived that when pleural adhesions are encountered when the surgeon enters the chest, the surgeon should be prepared for a technically more demanding operation. Dense pleural adhesions have been considered an absolute contraindication to VATS lobectomy [8, 13, 14], although this concern has been questioned as expertise with VATS procedures has increased [7, 15]. In our study, no conversions were performed because of adhesions, suggesting the technical feasibility of a VATS lobectomy in their presence.
Caution is urged by the authors of published series of patients found with adhesions during thoracoscopic lobectomies mainly due to the increased possibility of bleeding or prolonged air leak or to the increased rate of conversion in this group of patients [10–12, 16]. Traditionally, the operative time is expected to be longer [7]. Minimal data on the outcome of patients, linking adhesions with adverse events either intraoperatively or postoperatively after conversion to thoracotomy, have been reported, without focusing on patients with adhesions per se [7, 9, 13].
The findings of this study confirm those of previously published studies on the functional processes within the pleural space at the clinical practice level. According to these findings, the mesothelial pleural cells exhibit the ability to recycle fluid through active cellular transportation. This ability is limited by the presence of adhesions [6]. Therefore, we have proved at the clinical level that patients with adhesions have decreased pleural fluid perfusion and consequently will experience increased fluid drainage, prolonged ICD insertion time and morbidity. The risk is further increased in those in whom the adhesions occupy the lower parts of the pleural cavity [17].
Another finding of our study was the increased number of staples required to complete the fissure in patients with adhesions. Common sense dictates that the fissures in these patients are less discrete because the inflammatory response responsible for the adhesions does not spare the visceral pleura within the fissure.
Adhesions range from single films of connective tissue easily and bluntly transected to thick ridges of fibrous tissue with vessels and nerves needing sharp dissection and ligation. It has not been studied whether different types of adhesions in the pleural cavity correlate with the severity and extent of the inflammatory insult that occurred. The extent and the macroscopic appearance were previously used to classify peritoneal adhesions in an effort to provide a common language among surgeons [18, 19]. However, these classification systems have not been widely implemented, and surgeons still report adhesions according to their experience and capability. This practice, unfortunately, applies to pleural adhesions as well. Therefore, we have not yet produced a sound grading system for adhesions with clinical significance. A system that will alert surgeons and patients to possible postoperative events and provide tailor-made postoperative management in this group of patients is needed.
Limitations
This study has several limitations. First, it is a single-institution study. Second, all adhesions were reported on the basis of a subjective calculation of the area of coverage as mentioned in the operative notes. Third, the grouping was based on the assumption that different diseases affect the pleural cavity diffusely [20]. Finally, our cohort was relatively small; a larger multi-institutional study is needed.
CONCLUSION
In conclusion, the presence of pleural adhesions in patients undergoing major lung resection can be used to predict postoperative complications, especially adhesions involving the lower part of the pleural cavity. Early removal of chest drains in these patients should be discouraged. Our study calls for an internationally accepted description and grading system from the community of thoracic surgeons of pleural adhesions found during the operation. Such a system would provide a model for predicting postoperative complications and encourage the tailor-made postoperative management of patients with pleural adhesions.
Conflict of interest: none declared.
REFERENCES
APPENDIX. CONFERENCE DISCUSSION
Dr E. Internullo(Bristol, UK): You said your patients were classified as having or not having adhesions. How many ‘adhesions’ were adhesions? If I see just 1 cm2 of upper lobe attached to one rib and I just take it down, I might really forget the patient had any adhesions.
Dr Kouritas: Looking in the literature it is mentioned that more than 30% of adhesions of the overall area of the inner part of the chest should be considered as adhesions. However, in the whole cohort of the study, I do have data on patients having less surface coverage with adhesions, for example 10%, which suggests that if you have an inflammatory incidence in the chest cavity then that could be a problem. So that also needs to be addressed. But in this case it was >20%.
Dr R. Aparicio(Santiago, Chile): And would the strength of the adhesion make any difference? I mean those that you can just release easily down as opposed to you having to cut.
Dr Kouritas: We have looked at this as well, and we have also looked at whether you need to just take the lung down with a ‘peanut’ or use an energy device, and apparently there is a difference, but there was no time or space to present it here. Maybe in a second paper.
Author notes
†Presented at the 24th European Conference on General Thoracic Surgery, Naples, Italy, 29 May–1 June 2016.
