


Abstract
OBJECTIVES: Patient frailty is increasingly recognised as contributing to adverse postoperative outcomes in cardiothoracic surgery. The goal of this review is to evaluate the predictive ability of frailty scoring systems and their limitations in risk assessment of patients undergoing cardiac surgery.
METHODS: Frailty studies were identified by searching electronic databases. Studies in which the measuring instrument was defined as a multidimensional tool focusing on a population undergoing cardiac operations were included. The focus was on the predictive ability of frailty in this population and a comparison with conventional risk scoring systems. Unfortunately, the lack of a significant number of studies with the same postoperative outcome precluded a formal meta-analysis.
RESULTS: Of 783 studies identified in our initial search, 6 fulfilled our inclusion criteria. Frailty was identified as a predictor of mortality, morbidity and/or prolonged hospital stay in patients undergoing cardiac surgery. Our systematic review revealed the increased application of frailty scores compared to standardized risk stratification scores in cardiothoracic patients. In approximately 50% of these studies, frailty scores continued to be predictive even after adjusting for the conventional risk scoring systems.
CONCLUSIONS: The assessment of frailty may enhance the preoperative workup and offer an optimized risk stratification measure in patients undergoing cardiothoracic procedures even though the reporting standards of calibration and classification measures have been relatively poor.
INTRODUCTION
Over the last decade, an increasing proportion of patients undergoing cardiac surgery are of advanced age. Frailty is present in approximately 15% of people over 75 years; this rate further increases to 40% in 85-year-old patients [1]. Frailty can be defined as a biological syndrome of reduced reserve and resistance to stressors, resulting from cumulative declines across several physiological systems leading eventually to a higher potential for adverse outcomes [2].
Different risk scoring systems have been devised for predicting mortality and morbidity. The most commonly used ones are the logistic European risk evaluation (EuroSCORE I and EuroSCORE II) [3, 4] for cardiac procedures and the Society of Thoracic Surgeons (STS) score for thoracic procedures [5]. These predictive models, however, do not include frailty. Consequently, EuroSCORE II tends to overrate preoperative risk in healthy elderly patients, whereas STS underrates the risk posed by surgery in higher risk frail patients with similar morbidities [6].
It is widely understood that frail patients have reduced physical reserves for tolerating a major operation, which may increase the possibility of a greater occurrence of postoperative complications. This possibility has necessitated the development and introduction of tools designed to measure frailty in clinical practice, but frailty has not been incorporated routinely in the assessment of surgical patients during the preoperative or postoperative period. Several factors contribute to the absence of consensus as to which method should be used to measure frailty: the lack of a clear, universally accepted definition of frailty hinders precise identification and measurement; the objectives of a frailty measurement may differ and include assessments, screening, case finding or predicting patient prognosis; and the instruments used to measure frailty differ, depending on the objectives [7].
Our aim was to (1) review the strength of association between frailty-measuring tools and postoperative outcomes of patients undergoing cardiac surgery; (2) identify which measures of predictive accuracy are used to assess these outcomes; (3) assess how frailty scores compare to existing risk scores such as EuroSCORE and the STS score; and (4) examine for any variation between frailty and risk scoring tools, to identify which tool is most accurate in predicting postoperative outcomes.
MATERIALS AND METHODS
Literature search strategy
Data were obtained from EMBASE, CINAHL, MEDLINE, Cochrane, PubMed and other Web-based science electronic databases for the period January 1980 to January 2015. The following search terms were used to retrieve potential published articles from MEDLINE: ‘Frailty’ OR ‘Frail’ OR ‘Elderly’ AND ‘Cardiac surgery’ OR ‘Cardiothoracic surgery’, AND ‘Risk’ OR ‘Risk score’ OR ‘Risk stratification’ OR ‘outcome’. No limits were used in the search apart from the time frame defined above. The citations of all eligible studies were checked for identification of additional studies to be included in the review.
Study inclusion and exclusion criteria
Selection criteria included (1) studies defining their measuring instrument of frailty as a multidimensional tool and not just physical status deterioration, i.e. hand grip, walking; (2) studies based on a patient population undergoing cardiac operations; (3) studies investigating the predictive effect sizes of association of frailty measures to different postoperative outcomes. The outcomes of interest were 30-day, in-hospital and 1-year mortality rates; mid-term survival rates; composite outcomes; prolonged length of stay; and time to institutional discharge. Studies were excluded if they (1) included a frail population undergoing other cardiovascular interventions (i.e. transcatheter aortic heart valve procedure percutaneous coronary intervention); (2) did not examine one of the defined outcomes of interest; and (3) did not include prediction models for frailty.
RESULTS
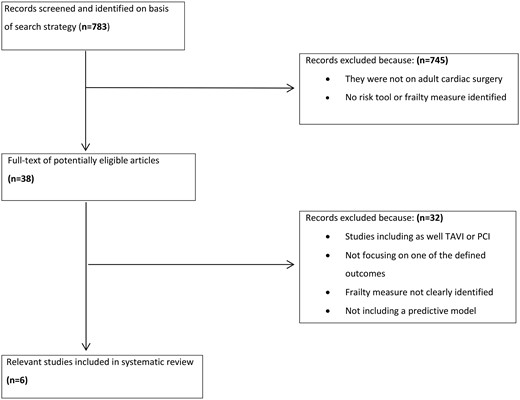
Flow diagram of study selection.
Frailty tools utilised in cardiothoracic surgery
| Tools/measure | Frailty characteristics | Frail versus non-frail cutoff value |
|---|---|---|
| Gait speed | Measures ability to walk 5 m at a comfortable pace × 3, averaged | Slow: >6 s, very slow: >7–8 s, extremely slow: >>10 s |
| The Katz index of activities of daily living | Measures ability to perform activities of daily living (bathing, dressing, transferring, walking, toileting, and feeding) independently | An abnormal score was defined as dependence in one or more activities of daily living |
| The Mini–Cog | Measures cognition using paired three-item recall and clock-draw tasks | An abnormal cognition was defined as a Mini-Cog score ≤3 |
| The Charlson index | Measures burden of disease by summing 19 categories of co-morbidities weighted on their risk of 1-year mortality | An abnormal chronic disease burden was defined as a Charlson score ≤3 |
| Anaemia | Measures anaemia of chronic disease and disease burden | Anaemia was defined as haematocrit <35% |
| Geriatric syndrome of falls | Measures self-reports of how many times the individual has fallen in the 6 months prior to surgery | A positive score of falls was defined as ≥ 1 fall in the 6 months prior to the operation |
| CAF | Combines values from Fried + CFS + disability + balance + blood | CAF score ≤11 |
| FORECAST | Measures ability to rise from a chair ×3, subjective reported weakness, stair climb, CFS, serum creatinine level | FORECAST score ≤5 |
| Timed Up and Go test | Measures the time needed to stand up from a chair, walk 10 ft, return to the chair, and sit | An abnormal score was defined as ≥ 15 s |
CAF: comprehensive assessment of frailty; CFS: Clinical Frailty Scale; FORECAST: Frailty predicts death One yeaR after Elective Cardiac Surgery Test.
Synopsis of current literature on frailty
| Source | N | Gender M/F | Age mean (SD) years | Frailty measure | Description | Primary study outcomes | Main outcome |
|---|---|---|---|---|---|---|---|
| Odds ratio/confidence interval | |||||||
| Sundermann et al. 2014 [9] | 450 | 227/223 | 79 ± 4 | CAF | 6-domain questionnaire | 30-day mortality, 1-year mortality | 30-day mortality OR: 1.10 (95% CI: 1.06–1.20) |
| 1-year mortality OR: 1.10 (95% CI: 1.06–1.10) | |||||||
| 1-year mortality independent of age OR: 1.091 (95% CI: 1.049–1.135) | |||||||
| When added to known EuroSCORE, 1-year mortality OR: 1.089 (95% CI: 1.045–1.135) | |||||||
| When added to known STS score, 1-year mortality OR: 1.087 (95% CI: 1.037–1.139) | |||||||
| Sundermann et al. 2014 [9] | 450 | 227/223 | 79 ± 4 | FORECAST | 5-domain questionnaire | 30-day mortality, 1-year mortality | 30-day mortality OR: 1.30 (95% CI: 1.20–1.50) |
| 1-year mortality OR: 1.30 (95% CI: 1.20–1.40) | |||||||
| 1-year mortality independent of age OR: 1.265 (95% CI: 1.143–1.401) | |||||||
| When added to known EuroSCORE, 1-year mortality OR: 1.271 (95% CI: 1.141–1.415) | |||||||
| When added to known STS score, 1-year mortality OR: 1.264 (95% CI: 1.116–1.431) | |||||||
| Lee et al. 2010 [8] | 3826 | 2828/998 | 65 ± 10 | Katz index of ADL/ambulation independence/dementia diagnosis | 5-domain questionnaire | In-hospital mortality and discharge to an institution | Adjusted in-hospital mortality OR: 1.80 (95% CI: 1.10–3.00) |
| Adjusted reduced mid-term survival HR 1.50 (95% CI: 1.10–2.20) | |||||||
| Adjusted prediction for institutional discharge OR: 6.30 (95% CI: 4.20–9.40 | |||||||
| Afilalo et al. 2012 [6] | 152 | 100/52 | 75.9 ± 4.4 | Gait speed | 5-m gait speed for more than 6 s | In-hospital mortality or major morbidity | Mortality or major morbidity OR: 2.63 (95% CI: 1.17–5.90) |
| When added to STS-PROM, mortality or major morbidity OR: 2.53 (95% CI: 1.15–5.52) | |||||||
| When added to the Parsonnet score, mortality or major morbidity OR: 2.28 (95% CI: 1.02–5.21) | |||||||
| Afilalo et al. 2012 [6] | 152 | 100/52 | 75.9 ± 4.4 | Nagi scale | 7 items | In-hospital mortality or major morbidity | Mortality or major morbidity OR:1.28 (95% CI: 1.06–1.54) |
| When added to STS-PROM, mortality or major morbidity OR: 2.66 (95% CI: 1.18–5.96) | |||||||
| When added to the Parsonnet score, mortality or major morbidity OR: 2.17 (95% CI: 0.93–5.04) | |||||||
| Afilalo et al. 2010 [10] | 131 | 87/44 | 75.8 ± 4.4 | Gait speed | 5-m gait speed for more than 6 s | In-hospital mortality or major morbidity | Adjusted mortality or major morbidity OR: 3.17 (95% CI: 1.7–2.59) |
| Mortality or major morbidity after adjusting for STS risk score OR: 3.05 (95% CI: 1.23–7.54) | |||||||
| Adjusted prolonged postoperative length of stay OR: 2.32 (95% CI: 0.95–5.67) | |||||||
| Adjusted discharge to a healthcare facility OR: 3.19 (95% CI: 1.40–8.41) | |||||||
| Robinson et al. 2013 [12] | 129 | 73 ± 6 | Katz index, Timed Up and Go test, Charlson index, Mini-Cog, albumin, anaemia, and fall | 7 different frailty tools | Complications | Increase in complications for every 1 year increase in age OR: 1.015 (95% CI: 0.943–1.092) | |
| Likelihood for frail people to have a complication OR: 6.697 (95% CI: 2.565–17.483) | |||||||
| Afilalo et al. 2011 [11] | 131 | 86/45 | 75.8 ± 4.4 | Fried scale, functional comorbidity, OARS instrumental ADL scales and Katz index of ADL | 5 items | Mortality and major morbidity | When adjusted for STS risk score, mortality or major morbidity OR: 3.14 (95% CI: 1.02–9.68) |
ADL: activity of daily living; CAF: comprehensive assessment of frailty; CI: confidence interval; FORECAST: Frailty predicts death One yeaR after Elective Cardiac Surgery test; OARS: Older American Resources and Services; OR: odds ratio; STS: Society of Thoracic Surgeons; STS-PROM: STS predicted risk of mortality.
Mortality rates
Two studies investigated the relationship between frailty and mortality [8, 9] using 3 different frailty measures [CAF, Comprehensive Assessment of Frailty; FORECAST, Frailty predicts death One yeaR after Elective Cardiac Surgery Test; Katz index of activities of daily living (ADL)] to assess (1) 30-day or in-hospital and (2) 1-year mortality rates.
30-Day or in-hospital mortality rate
The unadjusted OR of CAF for predicting 30-day mortality in frail versus non-frail patients was 1.10 (95% CI: 1.06–1.20); this result was similar to that of FORECAST, which demonstrated an OR of 1.30 (95% CI: 1.20–1.50) [9]. The Katz index of ADL was related to in-hospital mortality and reduced mid-term survival adjusted to various factors (age, sex, diabetes, chronic obstructive pulmonary disease), with ORs and HRs of 1.80 (95% CI: 1.10–3.00) and 1.50 (95% CI: 1.10–2.20), respectively [8].
1-Year mortality rate
The unadjusted OR of CAF for predicting 1-year mortality rates in frail vs non-frail patients was 1.10 (95% CI: 1.06–1.10); this number became 1.089 (95% CI: 1.045–1.135) when adjusted for EuroSCORE and 1.087 (95% CI: 1.037–1.139) when adjusted for STS score [9]. The unadjusted OR for FORECAST was 1.30 (95% CI: 1.20–1.40); this value became 1.271 (95% CI: 1.141–1.415) when adjusted for EuroSCORE and 1.26 (95% CI: 1.12–1.43) when adjusted for STS [9].
Composite outcome
Three studies reported the relationship between frailty and the combined outcome of major morbidity or mortality rates [6, 10, 11]. Tools used for this assessment included the gait speed score, the Nagi scale and the Fried scale, functional comorbidity, Older Americans Resources and Services (OARS) Activities of Daily Living scale and the Katz index of ADL.
Slow gait speed (≥6 s) demonstrated an unadjusted OR of 2.63 (95% CI: 1.17–5.90) for this composite outcome, which, when adjusted for STS predicted risk of mortality (STS-PROM), became 2.53 (95% CI: 1.15–5.52) and when adjusted for the Parsonnet score, became 2.28 (95% CI: 1.02–5.21) [6].
The Nagi scale (≥3 impairments) demonstrated an unadjusted OR of 1.28 (95% CI: 1.06–1.54), which when adjusted for STS-PROM, became 2.66 (95% CI: 1.18–5.96) and when adjusted for the Parsonnet score, became 2.17 (95% CI: 0.93–5.04) [6].
One more study from the same group used 5 items (Fried scale, functional comorbidity, OARS instrumental, ADL scales and the Katz index of ADL) to assess overall mortality and major morbidity, demonstrating an OR of 3.14 (95% CI: 1.02–9.68) when adjusted for the STS risk score [11]
Institutional discharge/length of stay
Two studies identified the value of the Katz index of ADL and gait speed for predicting discharge to a healthcare facility with an adjusted OR of 6.30 (95% CI: 4.20–9.40) and 3.19 (95% CI: 1.40–8.41), respectively [8, 10]. The study from Afilalo et al. [10] also highlighted the relationship between gait speed and prolonged length of hospital stay with an adjusted OR of 2.32 (95% CI: 0.95–5.67).
DISCUSSION
Frailty as a risk factor for adverse outcome in cardiac surgical patients has been recognized for many years [8]. It is known that frailty and the onset of dependency in ADLs are strongly related [8]. Consequently, existing measures such as the Katz index of ADLs were initially used as a frailty tool. Work by Lee et al. [8] demonstrated that frail patients were older, had an increased burden of disease and were more likely to undergo more complex operations than non-frail patients. The majority of the population included in this study underwent coronary artery bypass grafting (CABG). The weak or diminished reserve for mobilization and ambulation was found to predispose these patients to lung-related complications postoperatively, resulting in prolonged hospital stays. Blood transfusions, low cardiac output syndrome and sepsis were also more common in these patients. Consequently, frailty as measured by the Katz index of ADLs was thought to be a better predictor of institutional discharge (adjusted OR: 6.30) than of in-hospital mortality (adjusted OR: 1.80) or shortened mid-term survival (adjusted HR: 1.50) after adjusting for age, gender and other comorbidities. On the contrary, its discriminatory ability does not differ much for 2 of the outcomes considered: institutional discharge, AUC 0.83, 95% CI: 0.79–0.84 and in-hospital survival, AUC 0.81, 95% CI: 0.78–0.85. Similarly, Afilalo et al. [6] demonstrated that slow gait speed and older age are independent predictors of institutional discharge (adjusted OR: 3.19) in patients undergoing CABG or valve replacement or repair via a standard sternotomy approach.
Two studies reviewed here focused on the relationship between frailty and mortality using different assessment tools. Sundermann et al. [9] identified a slight increase in 30-day and in 1-year mortality rates with increasing degree of frailty (unadjusted ORs ranging between 1.10 and 1.30). They included patients who underwent CABG or a mitral valve repair or replacement or a transcatheter aortic heart valve procedure or a combined or other isolated valve procedure. Both the CAF and FORECAST tools used to measure frailty in this study continued to be predictive of mortality even after adjusting for age. This outcome remained true with the addition of EuroSCORE and STS scores to the model, although there was a slight reduction in the ORs. From all the procedures included in the study, only aortic valve replacement established a significant interaction with CAF and FORECAST scores. Although age showed a moderate correlation with both the STS score and the EuroSCORE, it has been weakly associated with the frailty scores. Lee et al. [8] had already shown this weak predictive relationship between frailty and mortality in a previous article.
The effect of frailty on mortality and morbidity has been reported in 3 studies by Afilalo et al. [6, 10, 11]. In the first study from 2010 [10], they showed that there is no actual association between gait speed and STS risk score, implying that these two independently cover different areas. This group included patients who either underwent coronary artery bypass and/or valve replacement or repair via a standard sternotomy approach. By preselecting 7 core risk factors (age, female gender, previous cardiac operation, low left ventricular ejection fraction, significant stenosis of left main coronary artery, non-elective surgery and type of surgical procedure) and adding slow gait speed, they created a predictive model. There was a very slight difference in the area under the curve when the model was run with or without the addition of the gait speed variable (0.81 vs 0.78 respectively); the Hosmer–Lemeshow Chi-square value was 5.70 vs 6.78, respectively. Slow gait speed, previous cardiac surgery and older age were independently predictive of the outcome. In a separate model created by this group, slow gait speed conferred a two- to three-fold increase in risk for any given level of STS predicted mortality or major morbidity compared with normal gait speed. When the model included only the STS risk score alone, the area under the curve was 0.70; with the addition of gait speed, it increased slightly to 0.74, indicating that gait speed may augment the information provided by the STS risk score. This result corresponded to the Hosmer–Lemeshow Chi-square test of 11.53 vs 10.29. Patients with slow gait speed were more likely to be women, to have shorter height, be diabetic and have at least one disability in their ADLs.
In the study from 2012, Afilalo et al. [6] investigated patients undergoing CABG and/or valvular surgery and created a model combining slow gait speed, the Parsonnet score and the Nagi scale that provided an area under the curve of 0.76. On one hand, slow gait speed alone yielded an area under the curve of 0.64, similar to that of the Nagi scale at 0.65. Likewise, when used alone, the Parsonnet score revealed a moderate discriminatory ability of 0.72. For a given level of predicted risk, slow gait speed was identified as an incremental predictor of mortality or major morbidity when adjusted for the STS-PROM or Parsonnet score (OR: 2.53 vs 2.28). On the other hand, the Nagi scale also provided an incremental value when adjusted to the above-mentioned risk scores (OR: 2.66 vs 2.17). In the third study by this group, frailty as measured by the Fried scale and other measures was singled out as an independent predictor of composite outcome (adjusted OR: 3.14) even after adjusting for the STS score [11].
Robinson et al. [12] identified a subgroup of patients who had a tendency for a slow response on the Timed Up and Go Test as having a significantly lower survival rate and exhibiting diminished performance in other geriatric characteristics suggestive of frailty (i.e. poor cognition). This group also showed that the higher the frailty scores of the patients were, the higher was the likelihood for postoperative complications following CABG or a valve procedure, with infection being the most common. The interaction between age and frailty was highlighted: For every one year increase in age, frail patients were 6.7 times more likely to have one or more complications compared to 3.3 times for the prefrail individuals. In terms of predictive accuracy, frailty as measured by the 7 different traits performed moderately (AUC: 0.711; 95% CI: 0.606–0.817).
Clinical prediction models may combine multiple predictors to assess their relative effects on how the models perform. In recent years, significant developments have been made towards a methodological framework for more robust development, validation and clinical usefulness of prediction models [13–15]. The performance of these models can be assessed by several methods and metrics. Traditional measures for binary and survival outcomes include the Brier score, the concordance (or c) statistic for discriminative ability (or area under the receiver operating characteristic [ROC] curve), and the goodness-of-fit statistics for calibration [16]. Our systematic review showed that these measures of performance are reported only occasionally, which makes it difficult to make conclusions about the effect on predictive accuracy of adding the variable of the frailty score to the established stratification tools.
Several new measures have recently been proposed that can be seen as refinements of discrimination measures, i.e. variants of the c-statistic for survival reclassification tables. It has been recommended that reporting discrimination and calibration is critical for prediction models and that reporting decision-analytic measures is imperative if the predictive model is going to be used for clinical decisions. Furthermore, quantifying the predictive ability of a model using the same data from which the model was developed will result in an optimistic estimate of performance, owing first to overfitting and second to the use of predictor selection strategies. Studies of new prediction models should, therefore, include some form of internal validation to quantify any risk of optimism in the predictive performance (such as calibration and discrimination) of the developed model. Overfitting, optimism and miscalibration should also be addressed and accounted for during model development by applying shrinkage or penalization procedures [17]. After a model has been developed, it is strongly recommended that its performance be evaluated using data from other participants. In case of poor performance, the model can be updated or adjusted on the basis of the validation data set. However, this sort of external validation of frailty scores is limited by the large variety of frailty scores tested and the fragmented information about different outcomes; therefore, more work is needed to address these important issues of validity.
CONCLUSION
This review highlights the limited evidence available about the ability of frailty scores to augment conventional risk stratification models in predicting morbidity and mortality outcomes after cardiac operations. A range of available frailty tools were found to be independent predictors of adverse outcomes and prolonged length of stay, emphasizing the importance of frailty in the ever-growing cohort of aging patients, but the statistical modelling of the published studies is inadequate to make conclusions about the predictive accuracy of calibration and classification measures.
Our study has the following limitations: (1) the definition of frail versus non-frail was not consistent. (2) There was variability in study design and none of them was randomized. (3) Power analysis was not stated clearly across studies. (4) The comparison between frailty and standard risk stratification scores was reported in only a few studies. (V) Data were not fully available for standard cardiothoracic outcomes in all studies. Additionally, many of these studies failed to report common end points, which limited formal meta-analysis of these outcomes, thereby limiting our interpretation of the best predictive value of each frailty tool. Study quality in terms of transparent reporting of prediction models in this field remains a shortcoming in selecting and applying frailty measures in cardiac surgery.
Future studies should consider whether an updated version of the EuroSCORE or STS score should include frailty as one of its variables. Additionally, we should strive to use a more targeted, multicenter approach, comparing frailty tools across standardized sets of outcomes that would allow us to determine which tool could best be used to provide a single, more homogeneous assessment of frailty.
Conflict of interest: none declared.
