


Abstract
OBJECTIVES: Postoperative atrial fibrillation (POAF) occurs frequently in patients after noncardiac thoracic surgery and has been associated with increased morbidity and risk of stroke. Recent studies have shown conflicting results on the role of neutrophil-lymphocyte ratio (NLR) and its association with the development of POAF after cardiac surgery. Our goal was to determine whether an association exists between NLR and the incidence of POAF after non-cardiac thoracic surgery.
METHODS: Using a database of 259 consecutive patients age 60 or older who had anatomic lung resection or oesophagectomy for oncologic resection, we compared preoperative, postanaesthesia care unit and postoperative day 1 NLR between patients who did and did not develop POAF during their hospitalization using Fisher’s exact test or logistic regression. We also compared NLR in patients who underwent minimally invasive resection versus open surgery.
RESULTS: POAF occurred in 50/259 (19%) of patients during their hospitalization. There were no significant differences in NLR between patients who did and did not develop POAF. In a secondary analysis of 180 patients who underwent open anatomic lung resection or oesophagectomy and 79 who underwent minimally invasive anatomic lung resection there was no difference in preoperative or immediate postoperative NLR, or an interaction in terms of odds of developing POAF.
CONCLUSIONS: In contrast to cardiac surgery, in patients undergoing major non-cardiac thoracic surgery, we had no evidence to show that either preoperative or early postoperative NLR was associated with the development of POAF.
INTRODUCTION
Postoperative
†Presented at the 5th Annual Thoracic Symposium during the 38th Annual Meeting of the Society of Cardiovascular Anesthesiologists, San Diego, CA, USA. 1 April 2016. Abstract previously published in: Journal of Cardiothoracic and Vascular Anesthesia Volume 30, Supplement 1, May 2016, EACTA 2016 Abstracts.
The etiology of POAF is multifactorial and includes autonomic imbalance, as well as inflammatory and oxidative changes. The contribution of inflammatory mediators to POAF has been suggested by the high incidence of POAF within 3 days after cardiac surgery, and a corresponding elevation of postoperative C-reactive protein in 1 study, and white blood cell count in another [5, 6]. The neutrophil-lymphocyte ratio (NLR) has been suggested as a measure of systemic inflammation and has been discussed as a possible marker for the development of POAF. A recent study demonstrated that increased preoperative and postoperative NLR were associated with the occurrence of POAF after cardiac surgery [7]; however, another study has shown conflicting results [8]. Our goal was to determine whether an association exists between preoperative and postoperative NLR and the incidence of POAF after non-cardiac thoracic surgery.
MATERIALS AND METHODS
With approval of the Memorial Sloan Kettering Cancer Center institutional review board and waiver of informed consent, we retrospectively reviewed the charts of 259 consecutive patients, age 60 years or older, who underwent anatomic lung resection or oesophagectomy from April 2009 to May 2010. The patients in this study were a subset of a larger prior study [4], and all patients were undergoing surgery for oncologic resection. Using a weekly updated surgical database we compared preoperative, postanaesthesia care unit (PACU) and postoperative day 1 (POD1) NLR between patients who developed POAF and those who did not. The primary clinical endpoint was the onset of POAF lasting 5 min or longer if detected by telemetry or POAF of any duration if clinically significant and requiring intervention during their entire hospital stay. POAF was documented by 12-lead electrocardiography if the POAF developed after telemetry was discontinued. Patients were excluded if they were not in sinus rhythm prior to surgery; had a history of POAF, or if they were taking preoperative class 1 or 3 antiarrhythmic drugs. Patients taking preoperative beta-blockers for other medical indications were maintained on their home beta-blockers to prevent beta-blocker withdrawal. All patients were transferred to the thoracic surgical floor on the first POD after an overnight stay in the PACU, and all patients had an epidural catheter for postoperative analgesia.
No formal power analysis was done for this exploratory observational study. We planned to study ∼260 eligible patients, a sample comparable to our previous research in this patient population. This is also comparable to a study in cardiac surgery examining the association between NLR and POAF [7].
Patients were analyzed as an overall group or by procedure type: open anatomic lung resection or oesophagectomy (open surgery), versus minimally invasive anatomic lung resection (MIS). Some of the clinical characteristics for this cohort of patients have been previously published [4]. To compare clinical characteristics between patients with and without POAF, univariable analyses were conducted using Fisher’s exact test for categorical variables and logistic regression for continuous variables. The data are presented as the median (25th, 75th percentiles), unless otherwise indicated. The odds of POAF given preoperative, postoperative and POD1 NLR measurements were assessed using the logistic regression. A multivariable logistic regression model was generated to identify factors beyond PACU NLR, starting with those with P < 0.1 from the univariable comparisons between POAF and clinical characteristics. The value of NLR in discriminating patients with and without POAF was further investigated using receiving operating characteristics (ROC) curve analysis in a univariable logistic regression and captured by the area under the curve (AUC). AUC ranges from 0 to 1, where 1 represents perfect discrimination between patients who do and do not experience POAF, and 0.5 is likened to a coin toss. We tested the relationship between surgical approaches (open versus minimally invasive) and NLR measured at each time point (preoperative, PACU and POD1). Preoperative NLR was divided into quartiles and compared between patients who underwent minimally invasive resection versus open surgery using the Wilcoxon rank sum test on the continuous version of NLR. Statistical analysis was performed with Stata 13 (StataCorp, College Station, TX).
RESULTS
The clinical characteristics of this cohort are listed in Table 1. POAF occurred in 50/259 (19%) of patients. The patients who developed POAF were more likely to be older (P = 0.011), have a history of hypertension (P = 0.016), and an elevated BNP (P < 0.0001). The patients who did not develop POAF were more likely to have been treated with preoperative β-blockers (POAF 29%, no POAF 48%; P = 0.018). There were no significant differences between the POAF and no POAF groups for history of smoking, coronary artery disease and open versus minimally invasive surgical approach. Oncologic stage was not available for each patient, but patients with stage 2 or 3 disease were treated with neoadjuvant chemotherapy. There was no difference in the incidence of POAF between patients who received or did not receive chemotherapy (P = 0.3). Length of hospital stay was longer among those with POAF: median 8 vs 5 days (P < 0.0001).
Demographics and clinical characteristics
| POAF | No POAF | P-value | |
|---|---|---|---|
| (n = 50; 19%) | (n = 209; 81%) | ||
| Age | 71.0 (69.0, 78.0) | 69.0 (64.0, 74.0) | 0.011 |
| Gender | |||
| Female | 17 (34%) | 100 (48%) | 0.084 |
| Male | 33 (66%) | 109 (52%) | |
| BNP pg/ml | 48.5 (33.0, 97.0) | 24.0 (12.0, 51.0) | <0.0001 |
| BMI | 28.4 (25.0, 31.2) | 26.8 (24.1, 30.3) | 0.3 |
| Smoking | |||
| No | 8 (16%) | 33 (16%) | 1 |
| Yes | 42 (84%) | 176 (84%) | |
| Hypertension | |||
| No | 12 (24%) | 89 (43%) | 0.016 |
| Yes | 38 (76%) | 120 (57%) | |
| Coronary artery disease | |||
| No | 38 (76%) | 168 (80%) | 0.6 |
| Yes | 12 (24%) | 41 (20%) | |
| Chemotherapy | |||
| No | 33 (66%) | 155 (74%) | 0.3 |
| Yes | 17 (34%) | 54 (26%) | |
| Diabetes | |||
| No | 40 (80%) | 180 (86%) | 0.3 |
| Yes | 10 (20%) | 29 (14%) | |
| History of beta blocker | |||
| No | 26 (52%) | 148 (71%) | 0.018 |
| Yes | 24 (48%) | 61 (29%) | |
| History of calcium channel blocker | |||
| No | 44 (88%) | 196 (94%) | 0.2 |
| Yes | 6 (12%) | 13 (6.2%) | |
| History of statin | |||
| No | 32 (64%) | 127 (61%) | 0.7 |
| Yes | 18 (36%) | 82 (39%) | |
| Preoperative heart rate | 67.0 (62.0, 78.0) | 70.0 (62.0, 81.0) | 0.4 |
| Surgical approach | |||
| Open | 37 (74%) | 143 (68%) | 0.5 |
| VATS | 13 (26%) | 66 (32%) | |
| Operation | |||
| Oesophagectomy | 10 (20%) | 32 (15%) | 0.075 |
| Lobectomy | 31 (62%) | 152 (73%) | |
| Pneumonectomy | 5 (10%) | 5 (2.4%) | |
| Segmentectomy | 4 (8.0%) | 20 (10%) | |
| Operative site | |||
| Left | 20 (40%) | 78 (37%) | 0.7 |
| Right | 30 (60%) | 131 (63%) | |
| Surgical duration (min) | 241.0 (170.0, 317.0) | 201.0 (150.0, 260.0) | 0.015 |
| Beta blocker prophylaxis | |||
| No | 11 (22%) | 59 (28%) | 0.5 |
| Yes | 39 (78%) | 150 (72%) | |
| Calcium channel blocker prophylaxis | |||
| No | 40 (80%) | 163 (78%) | 0.8 |
| Yes | 10 (20%) | 46 (22%) | |
Data presented as median (25th, 75th percentile) or n (%).
POAF: postoperative atrial fibrillation; BNP: brain natriuretic peptide; BMI: body mass index; MIS: minimally invasive surgery; VATS: video assisted thoracoscopic surgery.
The relationship between NLR and POAF is shown in Table 2. The distribution of preoperative NLR was similar between the POAF and no POAF groups. The median preoperative NLR was 2.7 in the POAF group and 2.8 in the non-POAF group (P = 0.5). The NLR in PACU increased in both groups as expected after surgery and was 11.7 in the POAF group and 10.3 in the no POAF group (P = 0.4) (Fig. 1). ROC analysis for PACU NLR as a predictor of POAF revealed an AUC of 0.538 (95% CI 0.444–0.632), implying a low classification capability (Fig. 2). Univariable results showed that none of the NLR measured at any of the 3 time points (preoperative, PACU, POD1) were significantly associated with the odds of POAF (Table 2). Multivariable models indicated that predictors of POAF in this population were age odds ratio (OR) 1.10 95% CI (1.04–1.116), P = 0.0004; surgical duration OR 1.01 95% CI (1.00–1.01), P = 0.0005 but not PACU NLR, P = 0.7.
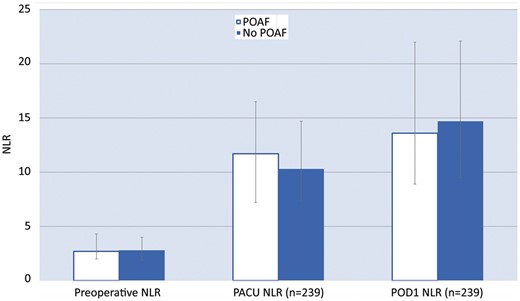
Preoperative, PACU and POD1 NLR in patients who did and did not develop POAF. NLR: neutrophil-lymphocyte ratio; PACU: postanaesthesia care unit; POD1: postoperative day 1; POAF: postoperative atrial fibrillation.

Receiver operating characteristic curve and area under the curve (95% CI) for PACU NLR. NLR: neutrophil-lymphocyte ratio; PACU: postanaesthesia care unit; AUC: area under curve.
Association between NLR and odds of POAF
| POAF (n = 50; 19%) | No POAF (n = 209; 81%) | OR | 95% CI | P-value | |
|---|---|---|---|---|---|
| Preoperative NLR | 2.7 (2.0, 4.3) | 2.8 (1.9, 4.0) | 0.95 | 0.80, 1.13 | 0.5 |
| PACU NLR (n = 239) | 11.7 (7.2, 16.5) | 10.3 (7.4, 14.7) | 1.02 | 0.98, 1.07 | 0.4 |
| POD1 NLR (n = 239) | 13.6 (8.9, 22.0) | 14.7 (9.5, 22.1) | 0.99 | 0.96, 1.03 | 0.7 |
Data presented as median (25th, 75th percentile).
POAF: postoperative atrial fibrillation; NLR: neutrophil-lymphocyte ratio; PACU: postanaesthesia care unit; POD1: postoperative day 1.
We then conducted a secondary analysis on the distribution of preoperative NLR and the association between NLR and incidence of POAF by procedure type: 180 (69%) of patients who underwent open anatomic lung resection or oesophagectomy and 79 (31%) of patients who underwent minimally invasive anatomic lung resection. The incidence of POAF was 13/79 (16%) in the MIS group, and 37/180 (21%) in the open surgery group. There was no significant difference in the distribution of NLR, measured preoperatively and POD1, between surgical approaches (open versus minimally invasive). However, PACU NLR was significantly higher for minimally invasive compared to open (median 11.1 vs 9.9, P = 0.019) (Table 3), although there was no significant interaction between the PACU NLR and procedure type in terms of the odds of POAF (P = 0.248).
Association between surgical approach and distribution of NLR quartiles
| Open (n = 180; 69%) | Minimally invasive (n = 79; 31%) | P-value | |
|---|---|---|---|
| Preoperative NLR quartile | 0.4 | ||
| <1.9 | 45 (25) | 19 (24) | |
| 1.9–2.75 | 43 (24) | 21 (27) | |
| 2.76–4.13 | 42 (23) | 24 (30) | |
| >4.14 | 50 (28) | 15 (19) | |
| PACU NLR quartile (n = 239) | 0.019 | ||
| <7.39 | 47 (28) | 12 (16) | |
| 7.39–10.43 | 42 (25) | 18 (24) | |
| 10.44–14.88 | 39 (24) | 21 (28) | |
| >14.89 | 37 (22) | 23 (31) | |
| POD1 NLR quartile (n = 239) | 0.2 | ||
| <9.22 | 39 (24) | 20 (27) | |
| 9.22–14.56 | 39 (24) | 21 (28) | |
| 14.57–21.9 | 40 (24) | 20 (27) | |
| >22 | 46 (28) | 14 (19) |
Data presented as n (%).
NLR: neutrophil-lymphocyte ratio; PACU: postanaesthesia care unit; POD1: postoperative day 1.
DISCUSSION
The main finding of this study was that neither preoperative nor early postoperative NLR were significantly associated with the development of POAF in patients undergoing major non-cardiac thoracic surgery. In a secondary analysis, the preoperative NLR was not significantly associated with the development of POAF when patients were separately investigated by either minimally invasive or open surgical approach. POAF occurred in 19% of patients in this cohort undergoing anatomic lung resection or oesophagectomy, and the incidence was similar for patients who underwent minimally invasive versus open resection. Independent risk factors for POAF in this cohort of patients were older age and increasing surgical duration.
An intense postsurgical inflammatory state has been suggested by the presence of elevated proinflammatory cytokines in the postoperative period [5, 9–12]. The NLR is a readily and routinely available marker for potential inflammation that has been used in a variety of neoplastic and cardiovascular disorders. The NLR has been used as a marker for disease activity in autoimmune conditions [13], and has shown prognostic significance for a variety of malignancies [14–16]. NLR has been investigated in oncology patients and a prospective study of NLR in 174 patients with gastric cancer showed that elevated NLR was associated with inferior survival [17]. A review of more than 30 000 oncology patients has shown that elevated NLR is associated with adverse overall survival in many solid tumours [18]. It is important to note that the NLR is a non-specific marker, and a prospective study examining 135 patients found that patients who developed lung cancer showed greater annual NLR changes than matched controls [19]. Thus, the NLR of patients in this study may have been affected by their oncologic disease.
The role of the postoperative inflammatory response in the development of POAF is unclear, and others have investigated the use of NLR to predict the development of postoperative arrhythmias. A prior prospective study of 275 patients undergoing coronary artery bypass grafting (CABG) showed that increased preoperative and POD2 NLR in CABG patients may be predictive of the development of POAF during their hospitalization [7]. Our incidence of POAF was comparable to that of this recent large study of patients undergoing CABG performed either with or without cardiopulmonary bypass [20]. A prospective study of 499 patients undergoing cardiac catheter ablation showed that NLR was predictive of atrial fibrillation recurrence [17]. However, our data is more consistent with a retrospective study of 523 patients undergoing CABG where neither preoperative nor postoperative NLR was associated with the development of POAF after cardiac surgery [8].
This study has several limitations. The patients included in this study were all 60 years old or older. This age group has a greater risk of developing POAF, but our results may not be generalizable to younger patients. All of the patients in this study were also oncology patients, and although this is applicable to most patients presenting for non-cardiac thoracic surgery, these results may not be generalizable to patients without malignancy. This study gathered laboratory data retrospectively, but the clinical data was gathered in a database in real time. Even though prior studies have demonstrated an association between POD2 NLR and the presence of POAF during hospitalization in CABG patients, the NLR in this study was only collected until POD1 and not beyond [7]. Of note, detecting an elevated NLR on POD2 is less likely to be valuable in providing pharmacologic POAF prophylaxis, and may not be valuable in this population since some patients are discharged early on POD1 following MIS lung resection.
In conclusion, in contrast to some reports of cardiac surgery patients, we found no association between NLR and POAF in a cohort of patients undergoing major non-cardiac thoracic surgery.
Funding
This work was supported by Departmental, and partially by NIH Core [Grant P30 CA008748].
Conflict of interest: none declared.
REFERENCES
