


Abstract
OBJECTIVES: The aim of this study was to investigate the mutual influence of valvular calcifications and transcatheter aortic valve stent geometry during and after implantation of a balloon-expandable SAPIEN®/SAPIEN XT® prostheses. Aortic valve calcification has been linked with adverse complications after transcatheter aortic valve implantation (TAVI). However, little is known about the fate of the calcifications after TAVI as well as its influence on transcatheter heart valve geometry.
METHODS: Thirty one patients underwent cardiac dual source computed tomography (DSCT) before and after a TAVI with the Edwards SAPIEN/SAPIEN XT® prostheses. Detailed DSCT image analysis was performed with Mimics® and 3Matic® (both Materialise, Leuven, Belgium).
RESULTS: Implanted stents reached an average degree of expansion of 84% and achieved good circularity despite the presence of fairly oval native annuli and a heterogeneous degree of valvular calcification. Both, the degree of stent expansion and the degree of stent eccentricity were inversely related to the degree of oversizing, but independent of the degree of valvular calcification and native annular ovality. Visualization of the position of calcific debris before and after TAVI showed that calcifications were shifted upwards and outwards as a consequence of the implantation procedure. The degree of stent eccentricity was related to residual aortic regurgitation grade ≥2.
CONCLUSIONS: The SAPIEN®/SAPIEN XT® prostheses achieved good degrees of stent expansion and circularity regardless of the morphology of the landing zone. Increased stent ovality was associated with an elevated risk for aortic regurgitation. The total calcification volume, degree of annular ovality and stent expansion were not associated with residual AR.
INTRODUCTION
In recent years, transcatheter aortic valve implantation (TAVI) has been established as an accepted alternative to surgical aortic valve replacement for treatment of severe aortic stenosis in patients exposed to an elevated surgical risk [1]. Unlike surgical aortic valve replacement, the calcified native cusps are left in situ and pushed aside by the stent of the transcatheter heart valve (THV).
Results after TAVI have improved steadily with growing experience, introduction of new devices, modification of implantation techniques and improvement of imaging modalities. Despite these tremendous advances, some TAVI-specific complications still persist. Particularly paravalvular leakage and new onset conduction disturbances are commonly seen [2]. Some risk factors for paravalvular leakage have been suggested, including implantation of a too small prosthesis and bulky calcific debris causing incomplete sealing of the annulus [3–6]. Similarly, new onset conduction disorders have been linked to native aortic valve calcification [7]. Taken together, the amount and distribution of valvular calcification seem to play an important role for proper THV deployment, function and consequently patient outcomes. However, the detailed interaction between the calcification and the THV is poorly understood. The aim of this study was to use innovative methods of image analysis to visualize effects and mechanisms of TAVI procedures and gain insight into the complex relationships determining outcomes.
METHODS
Study population
Eighty-three patients with symptomatic severe aortic stenosis who underwent TAVI at the University Hospitals of Erlangen and Gießen, Germany between 2009 and 2011 were identified. Patients were included in this study if they were treated with an Edwards SAPIEN® or SAPIEN XT® valve size 26 mm (n = 38). Of those, patients were excluded if pre- or post-procedural cardiac dual source computed tomography (DSCT) image quality was insufficient (n = 5) or more than one valve had to be implanted (n = 2). The final study population therefore comprised n = 31 patients.
Dual source computed tomography acquisition protocol
All patients underwent DSCT before and after the TAVI procedure. At one site, imaging was performed on a first-generation DSCT (Somatom Definition, Siemens Healthcare, Forchheim, Germany). Imaging prior to the TAVI procedure was performed by using an electrocardiogram (ECG)-gated spiral acquisition and ECG-gated dose modulation (35–70% of the RR-interval). The amount of contrast agent (Iopromide, Ultravist 370, Bayer Pharma AG, Berlin, Germany) was selected based on patient size. Imaging after TAVI was performed without contrast agent by using an ECG-gated spiral acquisition and ECG-gated dose modulation (70% of the RR-interval). At the other site, imaging was performed on a second-generation DSCT (Definition Flash, Siemens Healthcare, Forchheim, Germany). Contrast-enhanced imaging was performed in absence of contraindications.
Virtual reconstruction of the aortic annulus anatomy before and after transcatheter aortic valve implantation
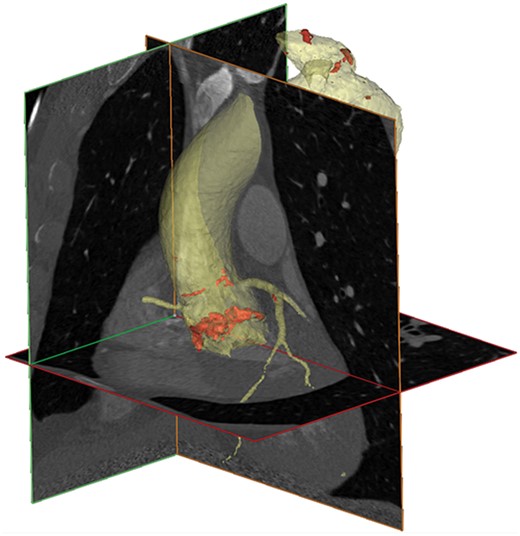
Virtual 3D reconstruction of the thoracic aorta including the aortic root based on DSCT using Mimics™. The aorta (yellow) and aortic valve calcium (red) were isolated in a semi-automated fashion.
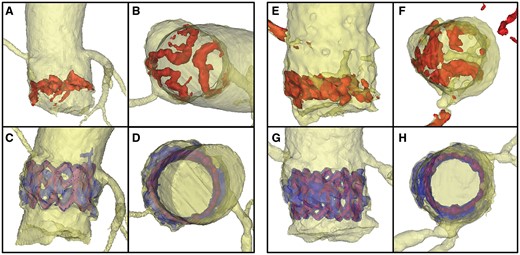
Aortic annuli of 2 patients with different amounts of calcification (left: Patient 1 with moderate calcification, right: Patient 2 with heavy calcification) before (top row) and after TAVI (bottom row). A, C, E, G: side view B, D, F, H: view from top. Pre-procedural calcium is dyed red, post-procedural blue. The THV stent is visualized in purple.
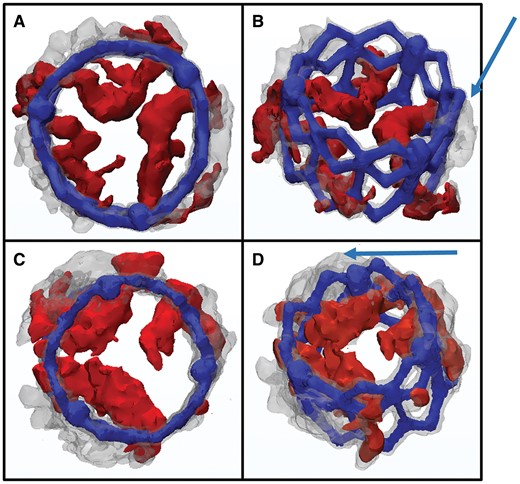
Pre- (red) and post-procedural (grey) reconstructions of the isolated stent are overlaid onto each other. The coronary arteries were used as landmarks to ensure proper alignment. A-B: Patient 1; C-D: Patient 2; A, C: view from top B, D: slightly tilted oblique view from top to visualize the 3D movement of the calcium. Arrows indicate the calcium shift upwards and sideways.
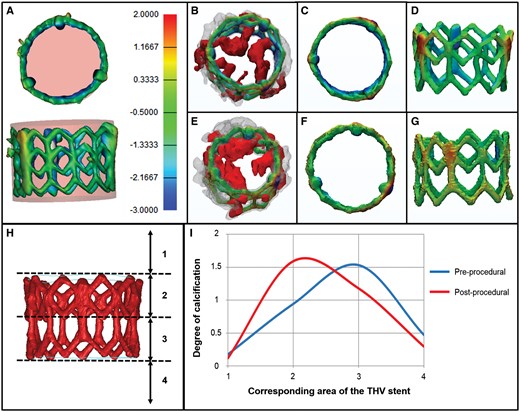
The degree of stent expansion was assessed with regards to the aortic valvular calcification. The isolated reconstruction of the stent was placed within a cylinder resembling the specific dimensions of a fully deployed stent (A, rose coloured). Stent frame segments exceeding the cylinder (over-expanded segments) are coloured yellow and red whereas segments lying inside the cylinder (under-expanded segments) are filled blue. Normally expanded areas are coloured green (B–G). Pre- and post-procedural reconstructions are overlaid onto each other, similar to Fig. 3 (B and E). B–D: Patient 1, E–G: Patient 2. H: To analyse the vertical movement of calcific deposits, the device landing zone was divided into four segments relative to the stent frame. The degree of calcification was quantified manually on a three-point scale from 0 (= no calcium) to 2 (= large amounts of calcium). I: Graphical depiction of the calcium distribution before and after TAVI.
All image analysis was performed by four blinded investigators (MK, BF, SA, SE) and the mean of these individual analyses was taken for the final result. Overall, the interobserver correlation between the measurements was high. In 3 cases, we had considerable interobserver discrepancies. The images of these patients were reviewed and discussed together with all four investigators to find a consensus.
Statistical analysis
Normally distributed continuous variables are expressed as mean ± standard deviation. Non-normally distributed variables are presented as median and 25.-75. percentile and compared between independent groups with the Mann–Whitney-U test. Spearman correlation was applied to investigate the relationship between linearly related variables. All statistical analyses were performed with IBM SPSS Statistics for Windows, Version 22.0 (IBM Corp., Armonk, NY).
The study was approved by the local institutional review board and is in accordance with the declaration of Helsinki.
RESULTS
Study population
Baseline characteristics of the study population are summarized in Table 1. 77.4% of patients were treated with the SAPIEN XT®, and 22.6% were treated using the first generation SAPIEN® prosthesis. 32.3% of patients were female and the mean age was 81 ± 5 years. The median grade of annulus ovality was 1.27 (25.-75. percentile 1.20–1.37) and the median amount of valvular calcification 901 mm3 (551–1460).
Baseline characteristics of the study population
| Patient characteristics | |
|---|---|
| Age (years) | 81 ± 5 |
| Female (n) | 10 (32.3%) |
| Log EuroSCORE (%) | 26.7 ± 13 |
| Access site | |
| Transapical (n) | 14 (45.2%) |
| Transfemoral (n) | 17 (54.8%) |
| THV devices | |
| Edwards SAPIEN® (n) | 7 (22.6%) |
| Edwards SAPIEN XT® (n) | 24 (77.4%) |
| Native anatomic characteristics | |
| Valvular calcification of annulus (mm3) | 901 (551–1460) |
| Perimeter (mm) | 81 (76–85) |
| Perimeter derived diameter (mm) | 25.8 (24.3–27.0) |
| Area (mm2) | 499 (434–537) |
| Area derived diameter (mm) | 25.3 (23.4–26.2) |
| Smallest diameter (mm) | 23.0 (20.8–24.3) |
| Largest diameter (mm) | 28.1 (27.1–30.1) |
| Native annular ovality | 1.27 (1.20–1.37) |
Transcatheter heart valve geometry
Assessment of stent geometry dimensions is summarized in Table 2. The perimeter derived diameter of the inflow portion of the stent was 23.7 mm (23.2–24.4) and 24.2 mm (23.3–24.7) for the outflow tract which corresponds to 91.2% and 93.1% of the diameters of an optimally expanded stent, respectively. The median area of the inflow portion of the stent was 435 mm2 (417–443) whereas it was 443 mm2 (423–467) in the outflow segment which correspond to 81.9% and 83.4% of the values of an optimally expanded stent, respectively.
THV stent geometry
| THV geometry | Manufacturers measurements | |
|---|---|---|
| Degree of stent expansion (%) | 84 (83–88) | |
| Degree of sizing (%) | 101 (96–108) | |
| Perimeter derived stent diameter of the outflow segment after implantation (mm) | 24.2 (23.3–24.7) | 26 |
| Perimeter derived stent diameter of the inflow segment after implantation (mm) | 23.7 (23.2–24.4) | 26 |
| Area of the stent’s outflow segment after implantation (mm2) | 443 (423–467) | 531 |
| Area of the stent’s inflow segment after implantation (mm2) | 435 (417–443) | 531 |
| Stent ovality of the outflow segment after implantation | 1.05 (1.03–1.08) | |
| Stent ovality of the inflow segment after implantation | 1.04 (1.02–1.08) |
The degree of over- or undersizing was quantified by division of the measured perimeter of the THV stent and the measured preoperative patients’ annular perimeter. A ratio >100% was defined as oversizing whereas any value below this threshold was defined as undersizing. On average, a tendency for slight oversizing was seen with a median ratio of 101% (96–108).
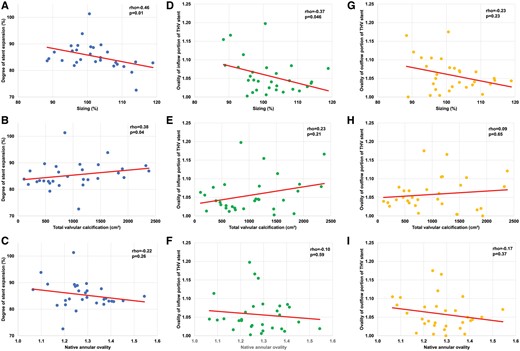
Scatter plots with regression lines to depict relationship between the degree of stent expansion and the degree of oversizing (A), amount of total valvular calcification (B) and annular ovality (C).
Stent ovality was calculated as the ratio of the maximum and minimum diameter. The ovality of the stent’s inflow tract was 1.04 (1.02–1.08) and 1.05 (1.03–1.08) for the outflow tract. Stent ovality of the inflow tract was associated with the degree of oversizing (ρ = −0.37, P = 0.045) whereas no correlation was found for the outflow tract. (Fig. 5D and G). Furthermore, the degree of valvular calcification and native ovality were not related to the ovality of the inflow and outflow portion of the stent (Fig. 5E, F and H–I).
In all investigated patients, the valves were implanted orthogonal to the annular plane and did not show any tilted valve positions.
Visualization of calcium shift
The median value of total valvular calcification was 901 mm3 (551–1460). Figure 3 shows a view from the top and a slightly tilted oblique view of the overlaid images. Pre-procedural calcium deposits (red) and post-procedural calcification (grey) are shown to provide direct visualization of the 3D movement of calcification induced by the TAVI procedure. A clear shift of the calcium upwards and outwards from the annulus can be observed (Fig. 3, arrows). Figure 4I shows the semi-quantitative distribution of calcium in relation to the pre-defined stent regions before and after TAVI. Before the procedure most calcifications were localized in Segment 3 which corresponds to the lower half of the SAPIEN®/SAPIEN XT® stent. Implantation of the THV into the native calcified annulus led to an upward shift of calcium. Post-TAVI, the calcium is mostly found in Segment 2, closer to the top of the stent.
Deformations of stent geometry with regards to valvular calcification
Reconstructions of pre-procedural valvular calcification and post-procedural calcium as well as the isolated stent were virtually overlaid onto each other to investigate stent deformations in relation to the surrounding calcifications. Two representative patients with different amounts of calcification are shown in Figs 2 and 3: Patient 1 with moderate calcification (Fig. 2A–D, Fig. 3A and B) and Patient 2 with a high calcium burden (Fig. 2E–H, Fig. 3C and D). The isolated stent reconstruction was placed within a cylinder resembling the specifications of a fully deployed 26 mm SAPIEN®/SAPIEN XT® valve (Fig. 4A, rose coloured). Stent frame segments exceeding the cylinder (over-expanded segments) are coloured yellow to red (red as an indicator of the area of the largest expansion), whereas segments lying inside the cylinder (underexpanded segments) are marked in blue (dark blue as an indicator of a higher level of underexpansion). Normally within reference expanded areas are coloured green. No clear visual relationship was found between local stent expansion or deformation and adjacent calcification.
Predictive factors for post-procedural residual aortic regurgitation
All anatomical, procedural and THV stent characteristics were compared between patients who presented with residual aortic regurgitation (AR) grade ≥2 (n = 7) and patients with mild or less AR (n = 24) (Table 3). Increased stent ovality was associated with an elevated risk for AR (inflow segment: AR < 2: 1.04 [0.02–1.06] vs AR ≥ 2: 1.09 [1.04–1.16], P = 0.02; outflow segment: 1.04 [1.03–1.07] vs 1.08 [1.05–1.18], P = 0.054). There was a tendency for an elevated risk for AR ≥ 2 in undersized patients (102% (97–108) vs 94 (89–104), P = 0.096). The total calcification volume (P = 0.13), degree of annular ovality (P = 0.96) and stent expansion (P = 0.86) were not associated with residual AR. To investigate the possible relationship between stent ovality and AR, we went back to the reconstructed images and investigated a possible relationship between chunky calcifications and stent ovality. After thorough inspection such an association was not found.
Relationship between residual AR and anatomic as well as stent geometry measures
| Residual AR <2 (n = 24) | Residual AR ≥ 2 (n = 7) | P-value | |
|---|---|---|---|
| Calcification volume (mm³) | 715 (475–1456) | 1188 (901–1524) | 0.13 |
| Annular ovality | 1.26 (1.20–1.37) | 1.28 (1.19–1.37) | 0.96 |
| Stent expansion (%) | 85 (83–88) | 84 (84–85) | 0.86 |
| Stent ovality of outflow segment after implantation | 1.04 (1.03–1.07) | 1.08 (1.05–1.18) | 0.054 |
| Stent ovality of inflow segment after implantation | 1.04 (1.02–1.06) | 1.09 (1.04–1.16) | 0.02 |
| Oversizing (%) | 102 (97–108) | 94 (89–104) | 0.096 |
AR: aortic regurgitation.
DISCUSSION
In this retrospective study of an early TAVI cohort, we analysed the geometry of the Edwards SAPIEN®/SAPIEN XT® stent after implantation, its association with residual AR, the shift of valvular calcium caused by the TAVI procedure and the influence of valvular calcification on stent geometry. Here, we can show that (i) the balloon-expandable Edwards SAPIEN® and SAPIEN XT® prostheses achieved good circularity after implantation even in highly calcified native aortic valves, (ii) the degree of stent expansion and ovality was associated with the degree of oversizing, (iii) stent ovality correlated with the risk for residual AR and (iv) during the TAVI procedure valvular calcific deposits were shifted upwards and outwards of the annulus by the THV stent.
Irregular calcium distributions induce a large variability in annular shapes of aortic valves [8–10]. Asymmetry of the device landing zone may lead to impaired haemodynamic outcomes due to deformation of the stent, incomplete stent expansion and/or incomplete sealing of the annulus. In addition, stent ovality may lead to increased leaflet stress possibly affecting long-term durability. A recent report showed that a balloon-expandable THV stent achieved greater circularity than a self-expanding prosthesis after implantation into eccentric annuli [11]. Bekeredjian et al. [12] provide evidence that annular calcification predicts post-procedural THV stent eccentricity of self-expanding valves but not balloon-expandable devices. Our findings support these results as we could show that the SAPIEN®/SAPIEN XT® prostheses achieved good circularity (stent ovality 1.04 [1.02–1.07]) after implantation into oval annuli (1.27 [1.21–1.37]). The degree of stent ovality was independent of the patients’ annulus ovality and the total valvular calcification (Fig. 5E–F and H–I) whereas an inverse relationship to the degree of oversizing (Fig. 5D and G) was found. Furthermore, our overlay 3D reconstructions showed no relationship between local deformations of the THV stent and adjacent calcifications (Figs 3 and 4). As previously suggested, these findings indicate that the balloon-expandable SAPIEN®/SAPIEN XT® prostheses achieve good circularity regardless of the degree of native ovality or calcification [11]. In contrast, a similar analysis investigating stent geometry after implantation of the self-expanding CoreValve® revealed that CoreValve® was found non-circular in 50% of the patients at the central leaflet coaptation level [13]. Non-circularity was defined according to the smallest and longest diameter of the stent at the same level. According to this definition, our population showed a non-circular stent geometry in <10% (n = 3/31) of patients. Unfortunately, the aforementioned study did not provide information on the quantitative valvular calcification, however, the patients’ average annular ovality (1.20) was comparable to that found in our population. Under the assumption of a comparable degree of calcification, the balloon-expandable SAPIEN®/SAPIEN XT® prostheses seem to have achieved more robust results with regard to stent geometry than the self-expanding CoreValve®. This notion is also supported by our finding that the quantitative degree of stent expansion was related to oversizing but not the native ovality.
The better capability of balloon-expandable THVs compared with self-expanding valves with regard to circularity may be explained by our finding that valvular calcifications experience an upward shift during the TAVI procedure. The SAPIEN®/SAPIEN XT® valves are composed of a stainless steel or cobalt-chromium frame, respectively. From top to bottom, this stent exerts an evenly distributed high-radial strength against inwardly directed forces exerted by the compressed tissue at the annulus level. The upward shift of the calcified leaflets leads to a residual inwardly directed force of the compressed tissue mainly at the upper section of the stent post-implantation (Fig. 4H, area 2). Due to the balanced distribution and high degree of radial resistance, the SAPIEN® stent is able to withstand this force and retain its circular shape. In contrast, the CoreValve® is made of a nitinol frame with a lower radial resistance than the SAPIEN® on one hand, but is also characterized by differing radial forces along the height of the stent. Specifically, the middle segment of the CoreValve® stent, which hosts the cusps, is most resistant to external compression [13]. Therefore, different segments of the CoreValve stent may react differently to the inwardly directed forces exerted by the native cusps and therefore explain the different findings regarding stent ovality between the SAPIEN® and CoreValve®.
Achieving best possible THV circularity is important as stent ovality may lead to increased leaflet stress possibly reducing long-term durability of the valve. Furthermore, stent ovality has been linked with residual AR in patients treated with the CoreValve® [14]. In an in vitro study, it was shown that for the CoreValve® leakage volumes increased with increasing stent ovality, while the effective orifice area decreased with ovality [15]. An oval stent led to malcoaptation of the CoreValve® leaflets during the closure phase and therefore central regurgitation [15]. The association between stent ovality and haemodynamic performance of the THV seems to be true for the balloon-expandable SAPIEN®/SAPIEN XT® prostheses as well, as we found a relationship between residual AR and stent ovality (Table 3). However, as a consequence of the high radial force of the balloon expandable THV, a remaining ovality of the THV-stent may occur less frequently. The mechanism behind this association remains unclear. Residual AR in the setting of an oval THV stent can be the result of incomplete annular sealing due to chunky calcifications or malcoaptation of the leaflets. We could not find an obvious association between ovality and adjacent calcifications but due to the low patient number such an association cannot be ruled out.
Our findings also provide further insights into the pathogenesis of annular ruptures during TAVI. A general perception is that treatment of patients with heavily calcified valves with a balloon-expandable valve increases the risk for annular ruptures by pushing the calcific debris into the annular wall with great force and therefore a self-expanding valve has been suggested to be the safer option [16]. However, our results show that even heavily calcified leaflets tilt up towards the sinuses and therefore do not get directly pushed into the annular wall which is the result of the native calcified leaflets fixed in the open position (Fig. 3). This may be the reason why previous findings suggest that the total valvular calcification itself does not sufficiently explain the occurrence of annular ruptures [16].
Similarly, a relationship between the valvular calcification and the occurrence of new onset conduction disturbances has been suggested as a consequence of injury of the conduction pathways by nearby calcific deposits during the TAVI procedure. However, similar to annular ruptures, it has been shown by several groups that the total calcific burden of the aortic valve is not related to new onset conduction disturbances [17, 18]. A recent analysis suggests that injury of conduction pathways is caused by the asymmetrically deployed balloon or THV within the annulus and not the calcification itself [19]. This finding also confirms our observation of an upwards shift of annular calcification in the current study. We therefore hypothesize that leaflet calcifications do not get directly shifted into the annular wall and do not seem to be mainly responsible for the injury of conduction pathways.
This study has some limitations. First, this was a retrospective analysis with its own typical limitations. Second, we investigated only one type of prosthesis of one specific label size. However, this was intended as different valve types and sizes cannot be compared with each other. Furthermore, even though the SAPIEN XT® valve has been widely replaced by the newer generation SAPIEN3® valve, we believe that the principal mechanisms of the interaction between the THV stent and the calcifications observed in this study can be transferred to the SAPIEN3® prosthesis due to the same material that the stent is made of and the mode of deployment. Third, the number of investigated patients was relatively small. Finally, the software used for this study (Mimics® and 3matic®) is mostly used for preclinical development at the moment and may not be fully validated yet for real patient cases.
In conclusion, we were able to visualize the interplay between native valvular calcifications and the TAVI procedure and investigate its influence on stent geometry and haemodynamic performance of a balloon-expandable THV. The SAPIEN®/SAPIEN XT® prostheses achieve excellent in vivo stent geometry after implantation regardless of the native morphology of the landing zone. Despite a comparatively low degree of observed stent ovality in this study population, stent ovality was still associated with residual AR.
Funding
ADUMED-Stiftung.
Conflict of interest: Buntaro Fujita: Received travel compensation from Edwards Lifesciences and Symetis. Martin Arnold: Received travel compensation from Edwards Lifesciences, proctor for Edwards Lifesciences, proctor and consultant for St. Jude Medical, received speaker honoraria from JenaValve. Jochen Börgermann: Proctor and consultant for Medtronic, received speaker honoraria and travel compensation from Medtronic and Symetis. Ulrich Steinseifer: Consultant for JenaValve. Stephan Ensminger: Proctor and consultant for Edwards Lifesciences, Proctor and member of SAB for JenaValve, received speaker honoraria from Edwards Lifescienes, JenaValve and Symetis, received travel compensation from Edwards Lifesciences, JenaValve and Symetis.
