


Abstract
Aortic stiffness is an independent cardiovascular risk factor. Cardiac magnetic resonance (CMR) allows evaluation of aortic elastic properties by different indexes such as distensibility, the maximum rate of systolic distension (MRSD) and pulse wave velocity (PWV). We sought to define age-dependent changes of indexes of elastic properties of the thoracic aorta in healthy subjects.
We enrolled 85 healthy subjects (53 males) free of overt cardiovascular disease subdivided into 6 classes of age (from 15 to >60 years). Distensibility, MRSD and PWV were measured by the analysis of CMR images acquired using a 1.5 T clinical scanner.
MRSD and distensibility decreased progressively through the classes of age (P < 0.001) after an initial plateau between 20 and 30 years in males and 15 and 20 years in females. Pulse wave velocity increased progressively with the age (P < 0.001). Distensibility was related to body mass index (P = 0.002), surface area (P < 0.005), weight (P = 0.005) and to left ventricular parameters such as mass index (P < 0.001) and end-diastolic volume index (P = 0.002). MRSD was related to end-diastolic volume index (P < 0.001) but not to body parameters. PWV was not related to body and ventricular parameters.
This study confirmed that physiological ageing is associated with a progressive impairment of the elastic properties of the aortic wall. Results of this study may be useful for the early identification of subjects with impaired aortic wall properties providing referral values of elasticity indexes assessed by CMR in different classes of age.
INTRODUCTION
Arterial stiffness is an independent cardiovascular risk factor [1–3] and there is a strong relation between ageing and stiffening of the proximal aorta, one of the earliest manifestations of vascular ageing in healthy humans [4].
Functional assessment of thoracic aortic properties such as aortic stiffness by cardiac magnetic resonance (CMR) has been proposed and validated [4–6]. In previous studies, the evaluation of aortic elastic properties with CMR was performed in patients with Marfan disease [7–10] and in subjects with bicuspid aortic valve [11, 12]. The conventional parameters for the assessment of the aortic stiffness were regional distensibility and flow wave velocity [13]. Currently, aortic stiffness and flow wave velocity are under investigation as parameters for the indication for ascending aorta replacement. Recently, the maximum rate of systolic distension (MRSD), a new index for the evaluation of aortic wall properties, was demonstrated to be more accurate than distensibility and flow wave velocity to detect initial changes of aortic elastic properties in young subjects with bicuspid aortic valve [12].
The evaluation of the physiological changes of aortic wall properties in healthy subjects of different ages may be relevant in clinical practice. The aim of the present study was to investigate age-related changes of aortic elastic properties by CMR in a population of patients free of overt cardiovascular disease.
METHODS
Healthy subjects were enrolled using the following inclusion criteria: (i) age ≥15 years; (ii) absence of contraindications to CMR; (iii) no history of cardiovascular disease; (iv) no family history of aortic disease, including Marfan syndrome and connective tissue disease; (v) no family history of sudden death; (vi) normal physical examination; (vii) normal echocardiographic examination, with evidence of tricuspid aortic valve and (viii) absence of acute or chronic disease, including diabetes, hypertension (defined as diastolic blood pressure >90 mmHg, systolic blood pressure >140 mmHg or receiving treatment for hypertension), hyperlipidaemia (abnormal lipid levels or receiving lipid-lowering therapy) and obesity (defined as body mass index [BMI] ≥30). Finally, subjects with referred smoke habit or drug assumption were excluded. All the subjects were informed about the study protocol and provided written consent. The procedures followed were in accordance with institutional guidelines and the Declaration of Helsinki. Subjects were subdivided into six class of age: 15–20 years; >20–30 years; >30–40 years; >40–50 years; >50–60 years; >60 years. The enrolment was completed when the CMR protocol was concluded by at least 12 subjects per class of age. The final population included 97 subjects (58 males).
Cardiac magnetic resonance: acquisition protocol
CMR was performed with a dedicated 1.5 Tesla scanner (Signa Hdx, General Electrics Healthcare, Milwaukee, WI, USA) with an eight-channel cardiac phased array coil. Left ventricular (LV) volumes and mass were obtained by acquiring short-axis cine images using conventional approach.
The thoracic aorta was visualized by acquiring sagittal-oblique cine images parallel to the major aortic axis using a breath-hold, electrocardiography-triggered, steady-state free-precession (SSFP) pulse sequence with the following parameters: 400-mm field of view, 8-mm slice thickness, no gap, 1 NEX, 12 views per segment, TE/TR 1.6/3.2, flip angle 45°, matrix 224 × 224 and reconstruction matrix 256 × 256. The number of cardiac phases was set according to the heart rate to obtain an aortic wall excursion temporal resolution of ∼10–3 s. Cross-sectional cine SSFP images with the same parameters were acquired at different aortic levels: (i) at the aortic valve plane to confirm the absence of aortic valve disease and the presence of tricuspid aortic valve; (ii) at the proximal ascending aorta (5 mm above the sinotubular junction); (iii) in section of the descending aorta included in the same images of the proximal ascending aorta and (iv) at the level of the maximum diameter of the ascending aorta.
The central arterial pressure was non-invasively estimated as previously described [14].
Magnetic resonance imaging: acquisition protocol
The SSFP images for the assessment of ventricular function and wall excursion were transferred to a workstation (Advantage Windows 4.1 GE) and elaborated with commercially available software (Mass Plus and CV Flow, MR Analytical Software Systems, Version 4.0, Leiden, Netherlands). Ventricular volumes were indexed for body surface area (BSA). The diameters of the aortic root, sinotubular junction and ascending aorta (at the maximal dimension level) were measured from the cine SSFP images.
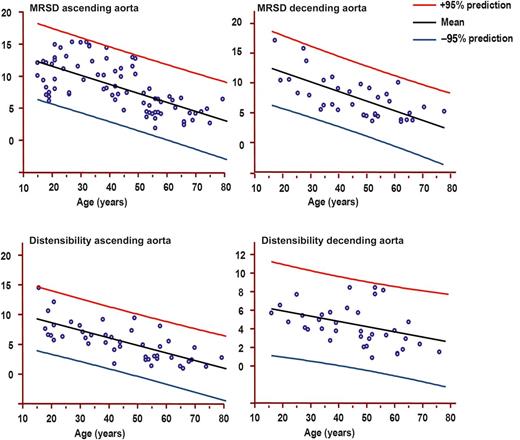
Males: Maximum rate of systolic distension (MRSD) of ascending and descending and distensibility of ascending and descending aortas by age decile (mean, 95% prediction). MRSD is expressed as percentage of maximal area/10–3 s. Distensibility is expressed as 10–3 mmHg–1.
Aortic wall distensibility in the ascending aorta was measured in SSFP images, using a method described in a previous study [16]. Briefly the relative change in luminal aortic area (in square millimetres) was measured as (Area max − Area min)/Area min. Maximal and minimal areas were measured automatically as above. Then, distensibility of ascending aorta in each subject was defined as follows: distensibility = relative change in luminal aortic area/cPP, where cPP is the estimated central pulse pressure. Distensibility was expressed as 10–3 mmHg–1.
The cross-sectional area/time curves generated for the ascending and descending aortas were used to measure the pulse wave velocity (PWV). PWV was defined as the time delay to reach the systolic half-peak of the cross-sectional area/time curve in ascending to descending aorta, divided by the length of the aortic arch between the two sections.
Statistical analysis
The Kolmogorov–Smirnov test was employed to assess normality of data distribution. A P-value of <0.05 was considered statistically significant. The values of clinical variables evaluated in the current study are expressed as the mean ± standard deviation (for normal distribution) or median and 25th–75th (interquartile range [IQR]) percentile. The group means of numerical data were analysed using a two-sample Student’s t-test. Differences among the groups were analysed using the Anova F-test when appropriate. The coefficient of determination for linear regression R2 was used.
RESULTS
Study population
Among the 97 subjects enrolled, 12 were excluded because of claustrophobia (n = 7) and poor image quality (n = 5). Then, the final population included 85 subjects (53 males, mean age 40, IQR percentile 25–52).
The subjects were distributed over classes of age as follows: 12 in ≥15–20 years; 12 in >20–30 years; 14 in >30–40 years; 13 in >40–50 years; 14 in >50–60 years; 12 in >60 years.
Patient general characteristics are shown in Tables 1 and 2
Population characteristics
| Male | Female | P-value | |
|---|---|---|---|
| n | 53 | 32 | |
| Age (years) | 36 ± 18.95 | 40 ± 17.9 | 0.34 |
| Height (cm) | 174.06 ± 10.49 | 163.96 ± 7.9 | <0.001 |
| Weight (kg) | 71.93 ± 16.08 | 64.21 ± 14 | 0.021 |
| BMI (kg/m2) | 23.81 ± 3.47 | 23.89 ± 5.22 | 0.93 |
| BSA | 1.87 ± 0.24 | 1.7 ± 0.19 | 0.001 |
| LV mass index (g/m2) | 77.28 ± 15.63 | 57.2 ± 11.78 | <0.001 |
| Aortic arch length (mm) | 128.55 ± 37.48 | 124.43 ± 21.77 | 0.57 |
| SAP (mmHg) | 120 ± 17 | 120 ± 15 | 1 |
| DAP (mmHg) | 74 ± 11 | 76 ± 9 | 0.38 |
| MAP (mmHg) | 90 ± 11 | 91 ± 10 | 0.67 |
| Ascending aorta | |||
| Maximum diameter (mm) | 29.2 ± 7.02 | 25.51 ± 6.28 | 0.016 |
| Minimum diameter (mm) | 27.11 ± 7.1 | 22.16 ± 5.22 | 0.001 |
| Distensibility | 0.52 (0.27–1.06) | 0.59 (0.38–0.94) | |
| MRSD | 8.64 ± 3.82 | 8.02 ± 3.72 | 0.46 |
| PWV | 3.96 ± 2.4 | 3.84 ± 1.48 | 0.83 |
| Descending aorta | |||
| Maximum diameter (mm) | 24.13 ± 6.3 | 19.3 ± 6.52 | 0.001 |
| Minimum diameter (mm) | 22.08 ± 6.18 | 17.53 ± 5.96 | 0.001 |
| Distensibility | 0.39 (0.28–0.57) | 0.47 (0.37–0.62) | |
| MRSD | 7.5 ± 3.77 | 7.5 ± 3.21 | 1 |
Data are expressed as: mean ± standard deviation or median (IQR, interquartile range).
BMI: body mass index; BSA: body surface area; LV: left ventricular; SAP: systolic aortic pressure; DAP: diastolic aortic pressure; MAP: mean aortic pressure; MRSD: maximal rate of systolic distension; PWV: pulse wave velocity.
Baseline characteristics of normal subjects studied (mean ± standard deviation)
| Age class | 15–20 years | 21–30 years | 31–40 years | 41–50 years | 51–60 years | >60 years |
|---|---|---|---|---|---|---|
| Males | ||||||
| Height (cm) | 174 ± 7.88 | 181.42 ± 7.04 | 175 ± 14.17 | 175.12 ± 13.87 | 174.62 ± 6.04 | 172.16 ± 5.60 |
| Weight (kg) | 68.62 ± 9.50 | 80.28 ± 8.26 | 73.14 ± 15.86 | 74.15 ± 21.15 | 75.12 ± 9.04 | 79.33 ± 12.07 |
| BSA (m2) | 1.82 ± 0.14 | 2 ± 0.13 | 1.88 ± 0.27 | 1.88 ± 0.36 | 1.9 ± 0.11 | 1.94 ± 0.17 |
| BMI (kg/m2) | 22.63 ± 3.20 | 24.39 ± 2.19 | 23.6 ± 3.00 | 23.51 ± 4.35 | 24.72 ± 3.40 | 26.67 ± 2.86 |
| EDVi (ml/m2) | 86 ± 10 | 89 ± 11 | 86 ± 9 | 84 ± 8 | 81 ± 11 | 77 ± 9 |
| LV mass index (ml/m2) | 76 ± 9 | 78 ± 8 | 80 ± 10 | 78 ± 9 | 76 ± 8 | 73 ± 11 |
| Ejection fraction (%) | 65 ± 6 | 66 ± 5 | 61 ± 4 | 60 ± 6 | 61 ± 7 | 59 ± 10 |
| Female | ||||||
| Height (cm) | 169.50 ± 3.53 | 169.75 ± 10.96 | 159.60 ± 6.38 | 167.80 ± 6.14 | 163.66 ± 3.93 | 162.20 ± 5.11 |
| Weight (kg) | 54.00 ± 2.82 | 70.00 ± 16.14 | 60.20 ± 8.22 | 64.20 ± 13.02 | 61.33 ± 5.42 | 77.20 ± 17.16 |
| BSA (m2) | 1.59 ± 0.03 | 1.81 ± 0.21 | 1.63 ± 0.13 | 1.72 ± 0.20 | 1.67 ± 0.08 | 1.86 ± 0.19 |
| BMI (kg/m2) | 18.83 ± 1.77 | 24.59 ± 6.91 | 23.64 ± 2.92 | 22.63 ± 3.12 | 22.90 ± 1.92 | 29.53 ± 7.4 |
| EDVi (ml/m2) | 80 ± 11 | 82 ± 10 | 79 ± 11 | 80 ± 8 | 76 ± 11 | 73 ± 12 |
| LV mass index (ml/m2) | 54 ± 10 | 54 ± 12 | 55 ± 9 | 56 ± 8 | 59 ± 12 | 60 ± 11 |
| Ejection fraction (%) | 61 ± 6 | 63 ± 5 | 64 ± 6 | 63 ± 7 | 63 ± 9 | 62 ± 11 |
Data are expressed as: mean ± standard deviation.
BSA: body surface area; BMI: body mass index; EDVi: end-diastolic volume index; LV: left ventricular.
Relationship between ageing and aortic elastic properties
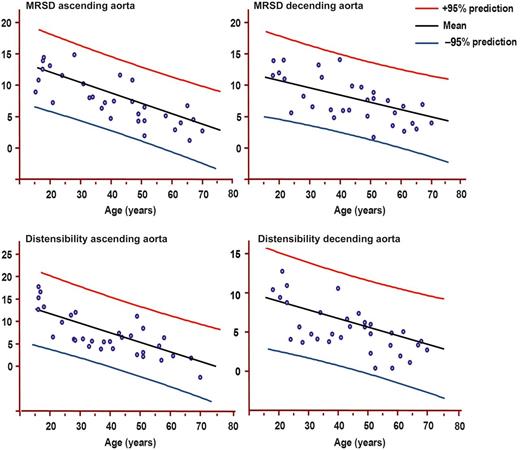
Females: Maximum rate of systolic distension (MRSD) of ascending and descending and distensibility of ascending and descending aortas by age decile (mean, 95% prediction). MRSD is expressed as percentage of maximal area/10–3 s. Distensibility is expressed as 10–3 mmHg–1.
MRSD in ascending aorta was related to LV end-diastolic volume index (R2 = 0.44, 95% CI 0.04–0.12, P < 0.001), while it was not associated with ejection fraction (P = 0.6) and mass index (P = 0.7).
In Tables 3 and 4 are presented the values of MRSD in the ascending and the descending aortas in the different classes of age, respectively, in males and females. No significant gender differences in MRSD in the ascending and the descending aortas was found in all classes of age.
Elasticity indexes in classes of age in males (mean ± standard deviation, 95% CI)
| Class of age | 15–20 years | 21–30 years | 31–40 years | 41–50 years | 51–60 years | >60 years |
|---|---|---|---|---|---|---|
| Ascending aorta | ||||||
| MRSD | 11.6 ± 2.3 (9.5–13.7) | 12.6 ± 3.5 (9.7–15.7) | 10.6 ± 2.3 (8.6–13.1) | 6.1 ± 2.4 (4.5–9.7) | 5.5 ± 1.3 (4.4–6.6) | 4.0 ± 1.4 (2.7–5.3) |
| Distensibility | 8.1 ± 2.9 (6.5–12.7) | 7.0 ± 1.4 (5.5–8.4) | 5.4 ± 2.1 (3.6–7.2) | 4.1 ± 2.8 (1.9–7.2) | 3.6 ± 2.2 (1.8–6.4) | 2.1 ± 1.2 (0.9–3.2) |
| Descending aorta | ||||||
| MRSD | 15.0 ± 6.4 (10.5–19.6) | 11.6 ± 4.1 (6.5–16.8) | 7.7 ± 2.3 (5.5–9.9) | 6.7 ± 2.3 (4.6–8.9) | 6.3 ± 2.3 (4.3–8.1) | 4.4 ± 0.9 (3.5–5.4) |
| Distensibility | 6.1 ± 0.6 (6.0–11.5) | 5.2 ± 1.5 (3.2–8.2) | 4.5 ± 1.1 (3.2–5.5) | 3.8 ± 1.8 (2.0–7.4) | 3.8 ± 2.1 (2.5–8.0) | 2.3 ± 1.2 (1.1–3.5) |
| PWV | 1.7 ± 0.8 (1.1–2.8) | 3.4 ± 1.1 (2.3–4.4) | 3.9 ± 1.5 (2.6–5.1) | 4.7 ± 1.1 (3.3–5.6) | 5.0 ± 2.0 (3.1–6.9) | 6.0 ± 2.1 (4.0–8.0) |
Data are expressed as: mean ± standard deviation (95% CI).
MRSD: maximum rate of systolic distension; PWV: pulse wave velocity.
Elasticity indexes in classes of age in females (mean ± standard deviation, 95% CI)
| Class of age | 15–20 years | 21–30 years | 31–40 years | 41–50 years | 51–60 years | >60 years |
|---|---|---|---|---|---|---|
| Ascending aorta | ||||||
| MRSD | 13.4 ± 1.9 (11.0–15.7) | 11.2 ± 3.8 (9.2–14.4) | 7.41 ± 1.9 (5.4–9.4) | 6.7 ± 1.4 (5.1–8.4) | 4.6 ± 1.7 (2.5–6.8) | 3.3 ± 1.99 (1.2–5.8) |
| Distensibility | 13.2 ± 3.4 (8.3–16.3) | 8.4 ± 2.6 (6.0–11.3) | 6.2 ± 3.7 (4.2–10.8) | 5.4 ± 3.7 (3.8–7.9) | 5.1 ± 1.8 (1.6–6.0) | 1.91 ± 0.4 (1.16–2.7) |
| Descending aorta | ||||||
| MRSD | 11.7 ± 1.3 (8.1–14.4) | 9.4 ± 1.7 (6.2–10.6) | 7.8 ± 2.3 (5.4–10.1) | 7.6 ± 1.9 (5.2–10.1) | 5.8 ± 2.8 (2.3–9.2) | 4.5 ± 2.2 (1.1–8.9) |
| Distensibility | 11.0 ± 1.0 (6.0–16.0) | 6.0 ± 1.2 (4.0–8.0) | 5.0 ± 1.7 (4.0–7.0) | 5.0 ± 1.5 (3.0–6.0) | 4.0 ± 1.1 (2.0–6.0) | 3.0 ± 1.0 (1.6–4.2) |
| PWV | 2.4 ± 1.4 (1.2–4.3) | 2.6 ± 1.4 (1.4–4.4) | 3.6 ± 1.4 (2.4–4.7) | 4.2 ± 1.1 (3.2–5.6) | 4.2 ± 1.1 (2.9–5.6) | 4.9 ± 0.6 (3.7–6.1) |
Data are expressed as: mean ± standard deviation or median (IQR, inter-quartile range).
MRSD: maximum rate of systolic distension; PWV: pulse wave velocity.
MRSD measured in both the ascending and the descending aortas demonstrated a significant decrease passing between the first three classes of age (<31 years) and other classes (P < 0.001). MRSD values increased from 10 to 30 years reaching a plateau at 20 years, and then decreased progressively.
Distensibility in the ascending aorta decreased with ageing (Figs 1 and 2). Subjects aged <31 showed higher distensibility than those aged >40, as evidenced in Table 3. Distensibility was related to weight (P = 0.005) and BSA (P < 0.005). It was inversely related to aortic arch length (P = 0.002) and directly related to LV mass index (R2 = 0.55, 95% CI 0.4–0.8, P < 0.001) and LV end-diastolic volume index (P = 0.002).
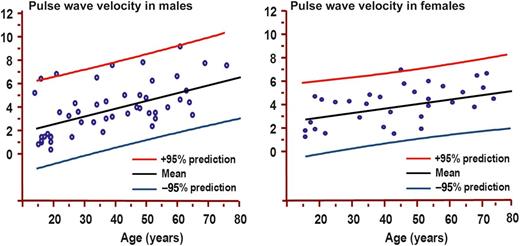
Pulse wave velocity (PWV) by age decile (mean, 95% prediction) in males (left panel) and females (right panel). PWV is expressed as m/s.
No relation was found between MRSD of both the ascending (P = 0.43) and the descending aortas (P = 0.31) and PWV. Instead, a relation was found between ascending aorta distensibility and PWV (P = 0.005). A relation was also found between MRSD of the ascending aorta and distensibility (R2 = 0.5, 95% CI 0.3–0.7, P < 0.001).
DISCUSSION
The main findings of this study may be reassumed as: (i) MRSD and distensibility showed a peak value between 21 and 30 years in males and 15 and 20 in females, then decreased progressively reaching the lowest values in subjects aged >60 years; (ii) PWV increased progressively with age; (iii) cross-sectional area of both the ascending and the descending aortas increased significantly from the lowest to the highest class of age.
MRSD was recently proposed as a new index of elastic properties assessing the compliance of the aortic wall during the systolic distension provoked by LV ejection. A lower MRSD value indicates that the kinetic energy of systolic ejection is transformed more slowly into potential energy. The imbalance between the uptake and release of energy by the aortic wall (Windkessel function), due to impaired elasticity, could slow the centripetal acceleration of the aortic wall, increasing aortic wall stress and progressively leading to dilatation of the aortic wall. In the current study, MRSD was independent of aortic size, arterial pressure, LV mass index and body parameters such as weight, height, BMI and BSA. Distensibility, instead, is directly related to blood pressure and body conformation parameters and aortic size. However, we found that also ascending aorta distensibility reached a peak at 20 years and then decreased progressively with the increase of age.
In this study, PWV was measured by the analysis of SSFP images in which cross sections of the ascending and descending aortas were depicted. The time of pulse wave to propagate from the ascending to the descending aortas was measured as the time gap to reach half of the maximal cross-sectional area between the ascending and the descending aortas. Then PWV was measured dividing the pulse wave propagation time by the length of aortic arch. Thus, the propagation of aortic wall deformation over time was directly evaluated. Unlike MRSD and distensibility, PWV increased progressively with age. The impairment of the elastic properties of the thoracic aorta in elder patients is concordant with the previous demonstration that ageing is accompanied by a destruction of the elastic vascular structure and that elastogenesis occurs throughout life but with constantly decreasing levels [17]. In this study, for every class of age, physiological range of values of aortic elasticity indexes has been determined. Then, these physiological ranges of values may be useful in clinical practice permitting the early identification of subjects with impaired aortic elastic properties. These subjects may be potentially at higher risk of development of ascending aorta aneurysm and acute aortic complications.
The association between impaired aortic elastic properties and some clinical conditions at higher risk of aortic complication was previously demonstrated, as in Marfan disease and in subjects with bicuspid aortic valve [15, 18].
Some study limitations should be mentioned. First, B-natriuretic peptide was not considered an exclusion criterion for the selection of the study population, and then we cannot completely rule out the presence of initial cardiac disease. However, we enrolled subjects with no family history of cardiac and aortic disease, no risk factors for coronary artery disease and with normal echocardiogram including diastolic function. Moreover, the evaluation of cardiac function by CMR demonstrated a normal systolic function, ventricular volumes and mass index in all the subjects using the referral normality values [19, 20]. Thus, the probability of including subjects affected by initial cardiac disease in the study population was very low.
Another limitation was that measurement of pressure was performed not contemporary to CMR acquisitions because we could not perform it inside the magnet. This may potentially alter the quantification of distensibility. However, the time gap between pressure measurement and CMR acquisition was very short (immediately after the end of the examinations) and in the same conditions. Moreover, we also used two indexes MRSD and PWV, which are independent of the measurement of blood pressure.
CONCLUSIONS
This study confirmed that physiological ageing is associated with a progressive impairment of the elastic properties of the aortic wall. Results of this study may be useful for the early identification of subjects with impaired aortic wall properties providing referral values of elasticity indexes assessed by CMR in different classes of age. CMR is a valuable tool for the assessment of aortic wall function.
Funding
This study was supported by research funding from the Fondazione G.Monasterio CNR-Regione Toscana.
Conflict of interest: none declared.
REFERENCES
Author notes
G.D.A. and A.C. equally contributed to this study.
