


Abstract
Taiwan’s fishing industry is characterized by abundant marine resources and diverse fishing operation modes. However, significant investment in fishing activities has also led to substantial fishing-related waste. This study analyzed 1037 beach cleanup records collected from 2009 to 2018 across various counties and cities in Taiwan, focusing on the composition and distribution hotspots of marine debris and derelict fishing gear (DFG). The results identified Kaohsiung, Hsinchu, Taichung, Tainan, and Keelung—counties located in northern and western Taiwan—as the top five regions with the highest quantities of marine debris. Among the DFG, floating items were the most prevalent (59%), followed by fishing gear (25%) and tackle items (16%). The study further revealed that the most influential factors for all three DFG types were the average tonnage of boats and the boat number of net type (N). The composition and quantity of DFG reflect the specific characteristics of the fishing industry in each county, such as fishing gear usage, aquaculture activities, and consumer demand for fishing products. These findings provide valuable insights into the primary types of DFG and their underlying causes across different regions, offering a foundational basis for the development of targeted governmental policies to address marine debris and DFG management in Taiwan.
Introduction
Marine debris refers to solid material from land-based sources (e.g. industrial waste, river-entrained refuse) and ocean-based sources (e.g. goods on ships, offshore natural gas, and oil extraction facilities) that ends up in the ocean or waterways as a result of human activities (UNEP 2005, Mouat et al. 2010). The growing accumulation of marine debris in the ocean has become an escalating global issue. It is estimated that between 4 and 12 million tons of plastic, including fishing gear and aquaculture facilities, enter the world’s oceans each year (Pruter et al. 1987, Derraik et al. 2002, Jambeck et al. 2015). The consequences of marine debris are extensive and can be categorized into three main aspects: harm to marine organisms, often leading to injury or mortality; degradation of the marine environment; and adverse impacts on human health and economic prosperity (Agamuthu et al. 2019, Abalansa et al. 2020). In the coastal regions of Taiwan, the most prevalent types of marine debris found on the sea surface are plastic bottles, foamed plastics, and fishing gear such as nets (Chiu et al. 2020, Yen et al. 2022).
The Taiwanese government established the Ocean Affairs Council (TOAC) in 2018 as the primary government agency responsible for marine affairs. Following the enactment of the Fundamental Act on Ocean Policy in 2019, the government released the “National Ocean Policy White Paper” in 2020 as a blueprint for marine governance (Shih et al. 2023). As part of this white paper, the “Salute to the Ocean” initiative was proposed to address the severe and persistent issue of marine debris. This initiative involves collaboration between the public and private both domestically and internationally, including in Taiwan (Environmental Protection Administration 2021). A key element of the Taiwan Marine Debris Governance Action Plan is conducting research and investigations into marine debris (Environmental Protection Administration 2021, Hung et al. 2022). TOAC began implementing efforts to remove the beach debris and establish a marine debris database as “Society of Wilderness (SOW)” early as the 2000s (The Society of Wilderness 2013). SOW developed a database categorizing marine debris using the International Coastal Cleanup sampling scheme (Conservancy, O 2018). Walther et al. (2018) later utilized this dataset to analyze the composition of coastal marine debris in Taiwan.
Both the fishing and aquaculture sectors are significant contributors to marine debris (Gesamp et al. 2016). Discarded galley waste and the abandonment, loss, or discarding of fishing gear, collectively referred to as derelict fishing gear (DFG), are the two primary ways in which fishing activities generate marine debris (Sheavly 2005, Macfadyen et al. 2009). DFG includes gear or gear components that are either intentionally discarded, abandoned, or unintentionally lost in the marine environment (Donohue et al. 2001). DFG is widely recognized for its harmful environmental and socio-economic impacts, especially on habitats, marine life, ecosystem services, and human activities such as navigation, fishing, and tourism (Gilman et al. 2016, Wilcox et al. 2016, WAP 2018). Once lost, DFG can continue to capture marine organisms for extended periods, ranging from days to years—through ghost fishing, leading to mortality among target and non-target species, including sea turtles and seabirds (Vodopia et al. 2024). DFG pose multiple threats to ecosystem, including entanglement, habitat destruction, toxic contamination, and coral reef loss, which can destabilize marine biodiversity (Angiolillo and Fortibuoni 2020, Duncan et al. 2023, Royer et al. 2023). DFG also serve as a vector for invasive species, further disrupting native ecosystem (Donohue et al. 2000). During degradation, DFG releases toxins and microplastics, which can bioaccumulate across trophic levels, impacting marine organisms and humans seafood consumption (Gall and Thompson 2015, Wilcox and Hardesty 2016, Wright et al. 2021, Vilke et al. 2024). Beyond its ecological consequences, DFG threatens maritime safety and infrastructure. Floating DFG can entangle vessel propellers, causing engine failure and navigational hazards, while submerged DFG can damage submarine cables, leading to significant economic losses (Gilman et al. 2023, Mengo et al. 2023).
To address this issue, the Taiwanese government is collaborating with local fisheries associations to establish Environmentally Friendly Fleets, where fishermen actively collect marine debris. Additionally, temporary DFG storage areas have been set up at fishing ports, and educational initiatives are being conducted to inform fishermen about the dangers of DFG (Yang 2022). These measures aim to reduce the amount of DFG entering the ocean at the source, thereby improving the situation (Chen et al. 2019, 2024).
Although DFG constitutes a significant portion of marine debris, it is seldom addressed in existing studies (Pruter et al. 1987, Derraik et al. 2002, Jambeck et al. 2015). Daniel et al. (2023) emphasized the need for more research on the types and causes leading to the generation of DFG. The production, distribution, and accumulation of DFG vary across spatial and temporal scales due to factors such as the type of fisheries, fishing activity intensity, coastal geomorphology, environmental conditions, and fishers littering behaviors (Edyvane and Penny 2017, Link et al. 2019, Gilardi et al. 2020). An analysis of multiple beaches in the UK found a strong correlation between the presence of DFG and proximity to ports (Unger and Harrison 2016). Similarly, Daniel et al. (2020) pointed out coastal beaches in India with high fishing intensity had four times the amount of DFG compared to other beaches.
In Taiwan, DFG constitutes nearly 70% of marine debris along the coastline (Schneider et al. ), with a material flow analysis revealing that over 2200 tons of fishing gear are lost to the ocean annually (Su et al. 2023). The amount of DFG has been pointed out to be highly related to the effort of fishing activities (Unger and Harrison 2016, Daniel et al. 2020). Kuo and Huang (2014) also reported a strong correlation between the amount of DFG and the number of fishing grounds and ports. Moreover, the origin of detected Styrofoam DFG and associated fragments has been primarily linked to oyster aquaculture activities in the southwestern coastal region of Taiwan (Liu et al. 2015, Chen et al. 2018). Liu et al. (2023) further noted that 70% of the DFG originated from gillnet fisheries, which has led to widespread mortality of the local coral reefs in the Penghu Islands.
The issue of DFG has become a growing concern among governmental agencies, non-governmental organizations (NGOs), and stakeholders because of its serious impact on marine ecosystem and fisheries. However, current studies have primarily focused on the composition and distribution of marine debris and microplastics around the coasts of Taiwan, with little attention given to the effects of DFG. Thus, this study aims to analyze the composition and hotspots of DFG along Taiwan’s coast. The relationship between fishing activities and DFG was investigated by generalized linear mixed model (GLMM). Additionally, the GLMM was applied to analyze the types of DFG and the reasons for DFG generation in each fishing port county in Taiwan.
Materials and methods
Data collection
The marine debris data were collected from the dataset established by SOW (http://cleanocean.sow.org.tw/result.php), which included 19 types of marine debris originating from 20 counties in Taiwan from 2009 to 2018. The dataset contained information on the location of cleaned beaches, the date of cleaning, the number of participants, the distance of the cleaned coastal lines, and the type and quantity of marine debris. Due to limitations in the publicly available dataset, weight data for marine debris were not included in this study. Any records with missing or error information as mentioned above, were removed from this study. The material classification of coastal marine debris would be marked as plastic, disposable, fishing equipment, and others. DFG was classified into three groups, including fishing gears (nets, ropes, etc.), floating items (plastic or Styrofoam floating buoys), and tackle items (fishing rods, hooks, rigs, etc.). The litter density of marine debris and DFG were calculated using the following formula:
Litter density is the number of debris per unit distance (numbers/km).
Number is the total number of marine debris and DFG recorded from 2009 to 2018.
Distance is the total distance (km) of beach cleaning recorded from 2009 to 2018.
Fisheries factors related to DFG
To understand the relationship between fishing activities effects and DFG, the fisheries data from each county from 2009 to 2018 were collected for this study. There are 11 fishing sectors included. The proportion of the fishing population (PFP) was obtained from the Ministry of Labor (https://statfy.mol.gov.tw/). Most of the fishing sectors, such as fishery employment population (FEP), landing (L), boat numbers (B), port number (P), quantity of boats by fishing method, average tonnages of boats (ATB), and mariculture industry production (MIP), were collected from the National Fisheries Yearbook (https://www.fa.gov.tw/). The beach cleanup frequency (BCF) was derived from SOW (http://cleanocean.sow.org.tw/result.php). A more detailed description of each factor is provided in Table 1.
Dataset for fisheries sectors related to DFG.
| Fisheries sectors (units) | Abbreviation | Description | Dataset |
|---|---|---|---|
| Fishery employment population (person) | FEP | Download the person who engage with coastal fisheries from each county | National Fisheries Yearbook (https://www.fa.gov.tw/) |
| Proportion of fishing population (%) | PFP | Proportion of total labor population engaged in coastal fisheries from each county | Ministry of Labor (https://statfy.mol.gov.tw/) |
| Landing (tons) | L | The total catch of each county | National Fisheries Yearbook (https://www.fa.gov.tw/) |
| Boats number (vessel) | B | The total number of fishing vessels that got licenses from each county. *Only included the vessels <100 tons (CT4; 50 to <100 tons) because of the focused coastal fisheries activity in this study | National Fisheries Yearbook (https://www.fa.gov.tw/) |
| Port number (port) | P | The number of ports in each county | National Fisheries Yearbook (https://www.fa.gov.tw/) |
| Quantity of boats of fishing method (vessel): | The total number of fishing vessels, which are categorized into Nets, Gears, and Miscellaneous | ||
| N | Net: The total number of fishing vessels that engaged the trawling, purse seine, gillnet, set net, and other nets | National Fisheries Yearbook (https://www.fa.gov.tw/) | |
| G | Gear: The total number of fishing vessels that engaged the longline, tackles, squid jigging, and other gear | ||
| M | Miscellaneous: The total number of fishing vessels that engaged the trap fishing, spear fishing, and frying fish roe fishery | ||
| Beach cleanup frequency (times) | BCF | The total times for beach cleaning in each county | Society of Wilderness (http://cleanocean.sow.org.tw/result.php) |
| Average tonnages of Boats (tons) | ATB | The average tonnage of fishing boats below CT4 (50 to <100 tons) in each county | National Fisheries Yearbook (https://www.fa.gov.tw/) |
| Mariculture industry production (tons) | MIP | The total production of the maciculture industry (e.g. calms, mussel, scallop, oyster) in each county | National Fisheries Yearbook (https://www.fa.gov.tw/) |
Generalized linear mixed model
The GLMM was used to investigate the relationship between DFG and fishing sectors, which is mentioned in Table 1. GLMM is a statistical model that extends generalized linear models (GLMs; Nelder and Wedderburn 1972) that includes random effects (i.e. effects that vary among individuals) in addition to fixed effects (i.e. effects that are constant across individuals) (McCulloch et al. 2005, Rabe-Hesketh and Skrondal 2008). This approach allows for a more flexible analysis by accounting for variations in the data that may arise from different years, regions, or other random factors, thereby improving model accuracy.
In this study, GLMM models were used to evaluate three types of DFG (fishing gears, floating items, and tackle items) and estimate the effects of 11 fishing sectors on DFG occurrence, which is mentioned in the “Data collection” section. Each of the fishing sectors represented different sources, which might affect the amount of DFG from fisheries. A more detailed description of each fishing factor is mentioned in Table 1. The model is as follows:
Model selection was conducted using backward selection and AIC values to identify the fishing sectors that significantly influence DFG. Variables (fishing sectors) were retained based on significance (α = 0.05), with the final model including only those contributing to the lowest AIC value (Akaike 1974). Fishing sectors were sequentially removed, and AIC values were recalculated at each step to determine the optimal model. If influential fishing sectors continued to be removed, the AIC would eventually increase again. The fishing sector associated with the largest AIC increase was identified as the most crucial contributor to the specific type of DFG. This approach allowed us to identify the most influential fishing sectors for each type of DFG. All statistical analyses were conducted using the glmmTMB package in R, which is specifically designed for fitting GLMMs with flexible distribution families and random effect structures.
Results
Descriptive statistic
Beach cleaning
The beach cleaning activities were held 1037 times across the county in Taiwan from 2009 to 2018.The highest frequency was reported in 2017, with 324 times (Fig. 1a). There are 1422 722 items of marine debris that were collected by these beach cleaning activities. The year with the highest amount of marine debris collected was 2016, with 326 566 items, while the lowest was 2009, with 4340 items (Fig. 1a; black line). The county with the highest frequency to hold beach cleaning activities was New Taipei City with 256 times, followed by Hualien County (134 times) and Keelung City (100 times) (Fig. 1b). The plastic product accounted for 44% of marine debris, the disposable items made up 22%, and the DFG took around 14% (Fig. 2). Keelung, Hsinchu, Taichung, and Kaohsiung reported the highest amount of per kilometer items (PKI) marine debris with around 8000 items/km. The plastic products and disposable items made up a large amount of the marine debris in these counties (Fig. 3).
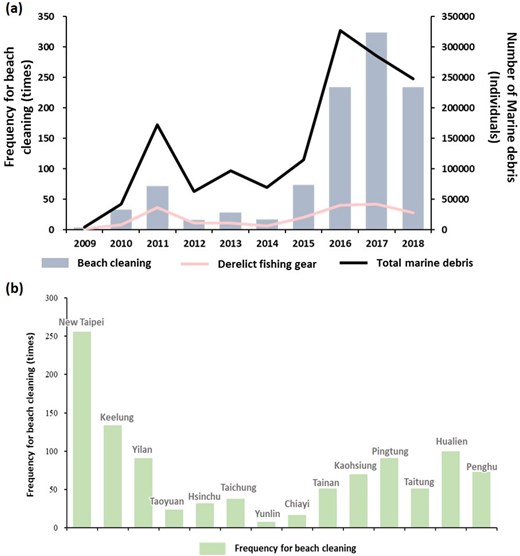
The time series of (a) beach cleaning, DFG, and total marine debris, (b) the beach cleaning frequency for each county from 2009 to 2018.
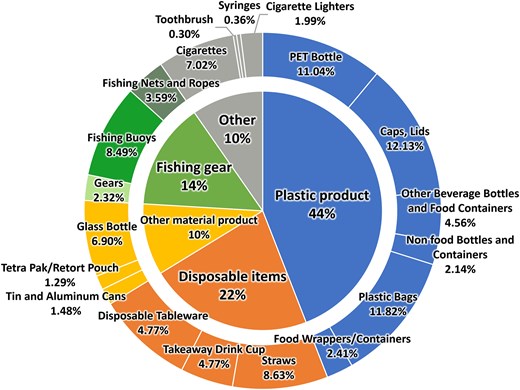
Composition and proportions of marine debris: plastic products, disposable items, fishing gear, and other materials.
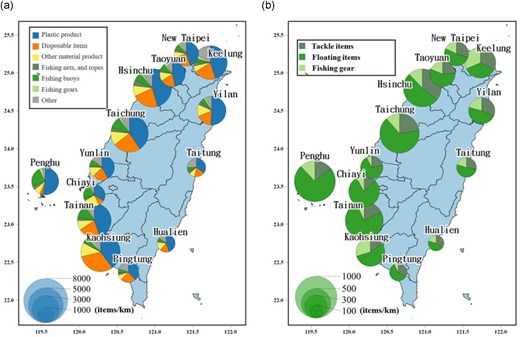
Spatial distribution and composition of (a) marine debris and (b) DFG across Taiwan’s coast.
Derelict fishing gear
The worthy to mentioned, the PKI of DFG accounted for a large amount of marine debris in Penghu, followed by plastic products (Fig. 3a). The highest amount of DFG were collected in 2016, 2017, and 2011, with ∼50 000 items (Fig. 1a; pink line). The highest amount of DFG was reported in New Taipei City with 63 672 items, while the lowest amount with 1670 items was recorded in Yunlin County (Table S1). The per kilometer items (PKI) showed the highest amount in New Taipei City with 334.15, and the lowest value (141.82) was recorded in Taitung County (Table 2). The fishing float showed the highest value between 707.9 PKI and 429.4 PKI in the western coastal counties (Penghu, Tainan, Taichung, and Hsinchu) (Table 2; Fig. 3b). Keelung, Kaohsiung, and Penghu City indicated the highest value around 171.6–115.4 PKI for fishing gear. Hsinchu, Taichung, and Keelung counties showed the highest value around 293–176.3 PKI for tackle items collection (Table 2; Fig. 3b).
Quantity of fishing debris per unit kilometer in Taiwan’s counties and cities (items/km).
| City | Fishing gear | Floating items | Tackles items | Total |
|---|---|---|---|---|
| New Taipei | 59.81 | 174.59 | 99.75 | 334.152 |
| Keelung | 171.58 | 195.84 | 176.29 | 543.718 |
| Yilan | 81.91 | 187.33 | 124.47 | 393.705 |
| Taoyuan | 68.82 | 209.94 | 88.99 | 367.753 |
| Hsinchu | 100 | 429.41 | 292.92 | 822.325 |
| Taichung | 102.58 | 582.23 | 201.52 | 886.329 |
| Yunlin | 21.89 | 202.93 | 63.10 | 287.931 |
| Chiayi | 44.84 | 427.69 | 69.03 | 541.559 |
| Tainan | 57.79 | 621.53 | 144.43 | 823.749 |
| Kaohsiung | 140.95 | 264.22 | 71.13 | 476.311 |
| Pingtung | 13.66 | 103.88 | 59.35 | 176.879 |
| Taitung | 28.88 | 64.35 | 48.59 | 141.816 |
| Hualien | 45.83 | 113.96 | 60.85 | 220.642 |
| Penghu | 115.44 | 707.87 | 138.46 | 961.769 |
Fishery sectors
The box plot for each fisheries sectors related DFG is shown in Fig. S1. A large amount of FEP was observed in Kaohsiung. Penghu County takes the largest proportion (45%) of the fishing population (PEP) and also has the highest amount of fishing ports (P) (67 ports). Landings (L) are concentrated in the northern part of Taiwan, including New Taipei, Keelung, and Yilan counties. The number of boats fishing by using nets (N) (trawling, purse seine, gillnet, set net, etc.) was largest in Kaohsiung, Tainan, and Chiayi County. The largest number of boats using gears (G), including longline, tackles, squid jigging, etc. was observed in Pingtung, Kaohsiung, New Taipei, and Penghu counties. The number of miscellaneous boats (M) showed the highest value in Yunlin County. For BCF, New Taipei County showed the highest median value (20 times) around Taiwan.
GLMM models for each DFG
The GLMM model was used to analyze the relationship between fisheries sectors and three types of DFG (fishing gear, floating items, and tackle items), respectively.
(a) Fishing gear
Using stepwise backward selection, by removing fishing sectors such as landings (L), BCF, MIP, number of boats by gear type (G), PEP, and total boat numbers (B), achieving the lowest AIC value (113.54) in the fishing gear DFG model (Table 3a). The remaining fishing sectors include the average tonnage of boats (ATB), miscellaneous boats (M), port numbers (P), the number of boats using nets (N), and FEP were the crucial fishing sectors for the fishing gear type of DFG (Table 3a). Keep removing these influential fishing sectors, the ATB (AIC = 134.83; Table 3b) emerged as the most influential factor, showing a positive relationship with the amount of fishing gear DFG (Fig. 4a). In contrast, the number of miscellaneous boats (M; AIC = 128.7) and port numbers (P; AIC = 117.7) showed negative relationships with fishing gear DFG (Fig. 4a; Table 3b). Additionally, the number of boats using nets (N; AIC = 121.9) and the FEP (AIC = 120.4) exhibited positive relationships with fishing gear DFG (Fig. 4a; Table 3b).
(b) Floating items


Proportions of (a) fishing gear, (b) floating items, and (c) tackle items type of DFG in relation to fishery sectors.
The GLMM results of fishing gear DFG. (a) AIC table (b) The influential parameters.
| (a) | |||||
|---|---|---|---|---|---|
| Factor | Df | AIC | |||
| <none> | 151.82 | ||||
| - L | 8 | 141.63 | |||
| - PFP | 8 | 142.06 | |||
| - BCF | 7 | 142.86 | |||
| - MIP | 8 | 144.21 | |||
| - G | 8 | 145.06 | |||
| - P | 8 | 146.66 | |||
| - B | 8 | 148.46 | |||
| - L - BCF | 5 | 133.49 | |||
| - L - MIP | 6 | 135.17 | |||
| - L - PFP | 6 | 135.22 | |||
| - L - G | 6 | 136 | |||
| - L - BCF - MIP | 6 | 126.52 | |||
| - L - BCF - PFP | 6 | 127.11 | |||
| - L - BCF - G | 6 | 127.16 | |||
| - L- BCF - MIP - G | 6 | 118.14 | |||
| - L - BCF - MIP - PFP | 6 | 119.28 | |||
| - L - BCF - MIP - P | 6 | 125.52 | |||
| - L - BCF - MIP - B | 6 | 126.39 | |||
| - L - BCF - MIP - G - PFP | 6 | 113.73 | |||
| - L—BCF—MIP—G—PFP-B | 6 | 113.54 | |||
| (b) | |||||
|---|---|---|---|---|---|
| Df | AIC | LRT | Pr(>Chi) | ||
| <none> | 113.54 | ||||
| -FEP | 6 | 120.35 | 18.807 | 0.004 502 | ** |
| -P | 6 | 117.17 | 15.631 | 0.015 878 | * |
| -N | 6 | 120.99 | 19.447 | 0.003 471 | ** |
| -M | 3 | 128.77 | 21.232 | 9.42E-05 | *** |
| -ATB | 6 | 134.83 | 33.292 | 9.21E-06 | *** |
After removing the FEP, number of boats by gear type (G), number of miscellaneous boats (M), and BCF, the floating items DFG model achieved the lowest AIC value (133.91) (Table 4a). The remaining fishing sectors include the total boat numbers (B), the ATB, PFP, landing (L), port number (P), and the boats number of boats using nets (N) (Table 4a). Continued removal of the influential sectors, total boat numbers (B; AIC = 142.87) were the most significant factor, showing the largest AIC value with positively affecting floating items DFG (Fig. 4b; Table 4b), followed by the ATB (AIC = 139.84), which also had a positive effect. Other fishing sectors (PFP, L, P, and N) showed negative impacts on floating items DFG (Fig. 4b).
(c) Tackle items
The GLMM results of floating item DFG: (a) AIC table, (b) the influential parameters.
| (a) | |||||
|---|---|---|---|---|---|
| Factor | Df | AIC | |||
| <none> | 151.96 | ||||
| - FEP | 8 | 141.11 | |||
| - G | 8 | 143.81 | |||
| - M | 5 | 144.24 | |||
| - PFP | 8 | 147.8 | |||
| - N | 8 | 148.55 | |||
| - BCF | 7 | 148.98 | |||
| - ATB | 8 | 149.49 | |||
| - FEP- G | 6 | 137.34 | |||
| - FEP- M | 3 | 137.82 | |||
| - FEP- G—M | 3 | 135.7 | |||
| - FEP- G—BCF | 5 | 136.37 | |||
| - FEP- G—M—N | 5 | 135.15 | |||
| - FEP- G—M—BCF | 6 | 133.91 | |||
| (b) | |||||
|---|---|---|---|---|---|
| Df | AIC | LRT | Pr(>Chi) | ||
| <none> | 133.91 | ||||
| -PFP | 6 | 136.44 | 14.52 | 0.024 334 | * |
| -L | 6 | 136.67 | 14.758 | 0.022 224 | * |
| -B | 6 | 142.87 | 20.959 | 0.001 866 | ** |
| -P | 6 | 137.15 | 15.236 | 0.018 499 | * |
| -N | 6 | 135.24 | 13.322 | 0.038 196 | * |
| -ATB | 6 | 139.84 | 17.93 | 0.00 641 | ** |
| -MIP | 6 | 136.03 | 14.12 | 0.028 329 | * |
Through backward selection for tackle items DFG, the FEP, number of boats by gear type (G), and MIP were removed, resulting in the lowest AIC value (90.18) (Table 5a). Continued removed the influential sectors, the ATB (AIC = 138.78) emerged as the largest AIC value, showing a positive relationship with tackle items DFG (Table 5b; Fig. 4c). Additionally, the FEP (AIC = 114.94) and the number of net-type boats (N; AIC = 110.8) also had positive effects on tackle items DFG. In contrast, landings (L; AIC = 101.44), port numbers (P; AIC = 108.47), and the number of miscellaneous boats (M; AIC = 90.36) showed negative effects on tackle items DFG (Table 5b; Fig. 4c).
The GLMM results of tackles items DFG: (a) AIC table, (b) the influential parameters.
| (a) | |||||
|---|---|---|---|---|---|
| Factor | Df | AIC | |||
| <none> | 100.066 | ||||
| - FEP | 8 | 92.602 | |||
| - MIP | 8 | 94.423 | |||
| - G | 8 | 97.097 | |||
| - FEP- G | 6 | 90.921 | |||
| - FEP- MIP | 6 | 92.575 | |||
| - FEP- G - MIP | 6 | 90.177 | |||
| (a) | |||||
|---|---|---|---|---|---|
| Factor | Df | AIC | |||
| <none> | 100.066 | ||||
| - FEP | 8 | 92.602 | |||
| - MIP | 8 | 94.423 | |||
| - G | 8 | 97.097 | |||
| - FEP- G | 6 | 90.921 | |||
| - FEP- MIP | 6 | 92.575 | |||
| - FEP- G - MIP | 6 | 90.177 | |||
| (b) | |||||
|---|---|---|---|---|---|
| Df | AIC | LRT | Pr(>Chi) | ||
| <none> | 90.177 | ||||
| -PFP | 6 | 114.941 | 36.764 | 1.96E-06 | *** |
| -C | 6 | 101.437 | 23.26 | 0.000 714 | *** |
| -B | 6 | 99.801 | 21.625 | 0.001 416 | ** |
| -P | 6 | 108.469 | 30.293 | 3.46E-05 | *** |
| -N | 6 | 110.8 | 32.623 | 1.24E-05 | *** |
| -M | 3 | 90.358 | 6.182 | 0.103 089 | |
| -BCF | 5 | 95.402 | 15.225 | 0.009 443 | ** |
| - ATB | 6 | 138.774 | 60.597 | 3.40E-11 | *** |
Discussion
This study found that New Taipei County had the highest frequency of beach cleanup activities from 2009 to 2018. Analyzing the composition of marine debris revealed that DFG accounted for ∼14%, peaking in 2016–2017 (Fig. 1). The GLMM model identified the ATB and total boat numbers (B) as influential fishing sectors contributing to DFG (Tables 3–5).
The distribution of marine debris related to oceanography
The analysis results of this study reveal that the highest quantities of total marine debris collected per kilometer items (PKI) are concentrated in the northern and western regions of Taiwan. The top five counties—Kaohsiung, Hsinchu, Taichung, Tainan, and Keelung—together account for 58% of the total marine debris (Fig. 3a). Reports from Greenpeace and SOW have pointed out the marine debris was found to accumulate along the northern and southwestern coasts (Greenpeace 2019). Additionally, the Taiwan Environmental Information Association (TEIA) published a report indicating that pollution levels responded to marine debris have worsened along the western coastline compared to the eastern coastline (TEIA 2013). The study on the distribution of floating marine debris in the waters surrounding Taiwan similarly found that the convergence of ocean currents, combined with the slower flow speeds and eddies near the northern coastline, leads to the highest density of floating marine debris in northern Taiwan (Chiu et al. 2020). Moreover, the disparity in debris quantities between the eastern and western coastlines in Taiwan can also be attributed to the influence of surrounding ocean currents (Korotenko et al. 2020). The eastern coast is primarily influenced by the fast-flowing Kuroshio Current, while the western coast is affected by a northward branch of the Kuroshio, along with the north-to-south flowing China Coastal Current. The slower flow velocities in the convergence zone may facilitate the accumulation of debris, leading to higher concentrations in the western half of Taiwan (Yang et al. 2019). Polystyrene-based products are frequently identified among DFG and represent a persistent source of marine pollution. These materials undergo photodegradation in the marine environment while being transported by ocean currents.
The composition of marine debris and DFG
According to descriptive statistics, plastic products accounted for 44% of all marine debris in this study (Fig. 2). In Taiwan, the proportion of plastic debris ranges from ∼33% to 53% for each county (Kunz et al. 2016, Chen and Chen 2020, Chiu et al. 2020). Due to its widespread applications, lightweight nature, durability, and cost-effectiveness, plastic has become a ubiquitous material in daily life. Plastic products persistence in the environment and their extensive use have led to significant ecological harm, with large-scale dispersion across both terrestrial and marine environments (Derraik 2002). Several studies also pointed out plastic materials constitute the largest proportion of coastal marine debris, including plastic bags, plastic bottle caps, and PET bottles (Kunz et al. 2016, Chen and Chen 2020, Chiu et al. 2020). Additionally, a report published by Greenpeace (2019) indicated that plastics were the most prevalent type of marine debris, followed by expanded plastics, such as Styrofoam, and DFG. In this study, the highest quantities of DFG related to PKI were predominantly located in the northern (Keelung), western (Taichung, Tainan, and Hsinchu), and Penghu counties in Taiwan (Fig. 3b; Table 2). DFG comprised ∼14% of the marine debris for the coast of Taiwan (Fig. 2). This proportion is notably higher than those reported in Australia (2%; Hardesty et al. 2017) and Israel (0.6%–2.8%; Pasternak et al. 2017). However, it is consistent with findings from neighboring Asian countries, such as Japan and South Korea, where surveys of marine debris composition in these regions identified that 17% and 35.3% of the debris, respectively, were attributed to DFG (Hong et al. 2014, Kuroda et al. 2020).
In Taiwan, DFG take around 14% of total marine debris and is widely spread at each county (Figs 2 and 3). Kuo et al. (2014) also pointed out ∼70% of floating marine debris in Taiwanese waters originates from DFG, and on recreational beaches, DFG accounts for 16% of total beach litter, making it the second most common waste type in such areas (Kuo et al. 2014). DFG persisted in the marine environment, posing significant ecological and economic threats (Gilman et al. 2022). Previous studies also showed the DFG made up 10% or 19.2% of the global marine debris added into the ocean annually (Macfadyen et al. 2009, Lebreton et al. 2018). Kuczenski et al. (2022) and Richardson et al. (2022) also estimated that ∼2% of the millions of metric tons of plastic fishing gear deployed globally is lost to the ocean annually, encompassing industrial trawl, purse seine, pelagic longline, gillnet, pot, and trap fisheries (Uhrin et al. 2020, Lebreton et al. 2022, Richardson et al. 2022). In Taiwan, the diversity of habitats has led to a wide variety of fishing gear usage (Wu et al. 2024) lead to the serious escalating DFG problem. DFG caused the damage of coral reef, the total of 118 600 meters of DFG, weighting 41 368 kg and occupying 118.2 cubic meters, was removed from natural reef areas around the Penghu Islands between 2018 and 2019 (Kuo et al. 2014, Schneider et al. , Liu et al. 2023). DFG could also become the ghost fishing not only damage fishing population but also caused the damage to marine organisms, such as sea turtle, sea birds (Wilcox et al. 2016, Gilman et al. 2021). The issue of ghost fishing also became strong concern with line-type and small vessels used by Taiwanese fisherman (Liao et al. 2019).
Spatial distribution and characteristics of DFG types in Taiwan
The relationship between the type of DFG and each county was evaluated and summarized in Table 2 to clarify.
Fishing gear
The higher PKI values of fishing gear were observed in Keelung, Taichung, Kaohsiung, and Penghu counties (Table 2; Fig. 3b). This may indicate a spatial relationship between critical fishing grounds and economically significant fishing ports. The quantity of fishing gear (DFG) and the PKI might increase as a result of these factors (Chen and Liu 2013). Keelung County, due to its nearest to the northeastern region of Taiwan, serves as a significant fishing ground for the mackerel purse seine fishery, which primarily targets Pacific mackerel, thus becoming the nearest location for unloading and selling fishing products (Mondal et al. 2024). Taichung, located in central Taiwan, is an ideal choice for fishermen operating in Chang-Yuen Ridge due to the high concentration of fishing product consumers in the region (Sihombing et al. 2024). The southwestern part of Taiwan, known as the Taiwan Bank, is characterized by rich ocean productivity, making it a crucial fishing ground near Kaohsiung County (Hsiao et al. 2021). Penghu, being the only island district, supplies fishing products locally and is associated with high DFG values.
Floating items
The highest PKI of floating items DFG were concentrated in the southwestern coastal area of Taiwan (Table 3b). These floating items primarily made of polystyrene and other foam materials, are hypothesized to originate from polystyrene buoys used in the southwestern oyster culture industry. Chen et al. (2018) identified the polystyrene as the commonly used material in oyster culture. Due to its buoyancy, polystyrene can be easily carried away from farming areas by ocean currents or strong winds (Liu et al. 2015). Additionally, polystyrene has the potential to break down into smaller fragments, posing a significant risk to coastal environments. Several studies also stick to this point, mentioning that polystyrene pollution affects not only the counties involved in the oyster culture but also their surrounding counties in the southwestern coast of Taiwan (Liu et al. 2013, 2015). In Penghu County, polystyrene and other foam materials are commonly used as floats for net cage culture (Yen and Yen 1985). However, these floats are often damaged by typhoons, contributing to higher PKI values for floating DFG items in the southwestern counties (Lan et al. 2022).
Tackle items
Higher PKI value for tackles DFG items were observed in Keelung, Yilan, Taichung, Tainan, and Penghu counties (Table 3b). According to investigation by iOcean (https://iocean.oca.gov.tw/), these counties are the most popular destination for recreational anglers. The amount of tackle items might be closely related to the entertainment fishery and line fishing activities.
The fishing sector related to DFG
The result showed there are several fishing sectors significantly influence the PKI of DFG for the coast of Taiwan (Tables 3–5). For instance, in Hawaii’s pelagic longline fishing grounds, a tsunami significantly reduced fishing effort by damaging ports and vessels, leading to a decrease in DFG level. This emphasizes the strong correlation between fishing activities and the generation of DFG (Uhrin et al. 2020). Several studies have also shown that fishing activities, including commercial fishing, entertainment fishery, and aquaculture, contribute to an increased proportion of DFG, which pose significant negative impacts on fishing grounds and ports (Gilman 2015, Baalkhuyur et al. 2020).
The PKI for all types of DFG were significantly and positively affected by the ATB and the boat number of net type (N) (Tables 3–5). A study in South Korea applied multiple regression analysis to examine the relationship between abandoned fishing nets and fishery-related factors. The results showed that vessel tonnage and the number of fishing gears significantly influenced fishing gear type of DFG (Kim et al. 2014). Additionally, the FEPs are also positively related to fishing gear type DFG, comparable to the influence of the ATB (Fig. 4a). The operation of larger fishing boats required a greater workforce, which leads to an increased demand for fishery employment (Adams et al. 2004). This, in turn, may result in a higher PKI for fishing gear-related DFG.
The decrease in port number (P) with increase boat number (B) caused the PKI of DFG increased (Tables 4–5). Previous study noted that with the same number of vessels, a reduction in the number of ports leads to increased shipping frequency, thereby amplifying the environmental impact (Wilewska-Bien and Anderberg 2018). Hossain et al. (2019) suggested that effective port management, including maintaining cleanliness, is crucial for reducing DFG accumulation through pollution control measures. However, research on port management in Taiwan is limited. Long-term observation and analysis are needed to assess the effectiveness of management strategies, particularly in cities with multiple ports.
The positive relationship between MIP and floating items DFG is shown in Fig. 4. This correlation is likely closely related to the materials used for floating items in aquaculture, as discussed in the previous section. The BCF was only correlated with tackle items type of DFG (Table 5b), which is closely related to the line fishing activities in the coastal area of Taiwan. (iOcean; https://iocean.oca.gov.tw/). For PKI of tackle items DFG, the abundance of tackle items might made positive impact to tackle items of DFG, with opposite impact compared with BCF. This might be the main reason it is difficult to distinguish the affection between line fishing activities and tackle items type of DFG.
Lastly, the DFG issue in Taiwan is not solely attributed to a single industry but rather results from both the fishing and aquaculture sectors (Tables 3–5). To mitigate the adverse effects of DFG on the coast of Taiwan, collaborative efforts with fisheries authorities, enhanced stakeholder education, and the promotion of beach cleanup initiatives are essential (Cigliano et al. 2015, Walther et al. 2018). Furthermore, research on the material composition of fishing gear should be expanded to comprehensively assess the ecological impacts of DFG on marine organisms and habitats (Wu et al. 2024). Evaluating the advantages and limitations of biodegradable fishing gear will be instrumental in developing more effective management strategies to reduce the negative impacts of DFG on the coastal ecosystems of Taiwan.
Remark and conclusion
The research highlights the cities with high fishing waste are primarily located in northern and western Taiwan. The top three cities for beach cleanup activities are New Taipei, Keelung, and Hualien. DFG is mostly floating items (59%), followed by fishing gear (25%) and tackle items (16%). The difference in DFG distribution may be due to ocean currents. Eastern Taiwan experiences the fast Kuroshio Current, while the western coast is influenced by the Kuroshio branch and China Coastal Current. Slower flow velocities at the intersections of ocean currents may lead to the accumulation of DFG. All types of DFG increased with vessel size and net use. The fishing gear type of DFG is related to fishing population and ports per city—larger vessels mean more workers and net boats, leading to increased discarded fishing gear. The floating items type of DFG are positively correlated with aquaculture production, as cities with higher aquaculture output tend to generate more of this DFG. The tackle items type of DFG is associated with fishing activities and beach cleanups, possibly due to recreational shore fishing. To tackle the issues of DFG, we recommend collaborating with cities that experience high levels of marine debris, such as New Taipei, Keelung, and Hualian, to enact localized regulations aimed at mitigating fishing waste and marine debris. Besides, partnership with fishery authorities is also essential to educate stakeholders, including fishermen and aquaculture operators, about the economic and environmental impacts of DFG, particularly the contribution of larger vessels, net usage, and aquaculture production to DFG accumulation. Additionally, increasing the frequency of beach cleanups in high-debris areas through cooperation with NGOs can help address the accumulation of fishing tackle waste, which is often linked to recreational shore fishing and line fishing activities along Taiwan’s coastline. These strategies align with the findings on the relationship between the fishing activities and port management to the DFG, which emphasizing the need for targeted and collaborative efforts to mitigate DFG pollution.
Acknowledgment
We are grateful to Longchen Paper & Packaging Co., Ltd for supporting this work.
Author contribution
Wei-Yu Lee: writing—original draft, Formal analysis, Yan-Lun Wu: Conceptualization, Writing—original draft, Formal analysis, Kuo-Wei Lan: Conceptualization, critically revising the article for important intellectual content Muhamad Naimullah, Irene Chia Ling, Lim: substantial contribution to conception and design and Formal analysis.
Conflict of interest
None declared.
Funding
This work was supported by the Taiwan Fishery Agency (Pretreatment Technologies for Reusing Non-Biomass Fishery Gear; 114-Agriculture-14.1.2-Fishery-01). The funders had no role in study design, data collection and analysis, decision to publish, or preparation of the manuscript.
Data availability
Data derived from a source in the public domain. The data underlying this article are available in Society of Wilderness (SOW), at https://www.sow.org.tw/en. The datasets were derived from sources in the public domain: http://cleanocean.sow.org.tw-/result.php.
