


Abstract
Return rates of Atlantic salmon (Salmo salar) from the sea to European rivers have declined in recent decades. The first months at sea are critical for growth and survival; recent evidence suggests that reduced food availability may be a contributory factor to the observed declines. Here, zooplankton abundance data are used to derive a measure of prey energy available to forage fish prey of salmon during early marine migration. This zooplankton prey energy has significantly and dramatically declined over much of the northeast Atlantic, and specifically within key salmon migration domains, over the past 60 years. Marine return rates from a set of southern European populations are found to exhibit clustering not entirely predictable from geographical proximity. Variability in grouped return rates from these populations is correlated with zooplankton energy on a range of scales, demonstrating the potential use of zooplankton energy as an indicator of salmon marine survival. Comparison with environmental variables derived from ocean model reanalysis data suggests zooplankton energy is regulated by a combination of climate change impacts on ecosystem productivity and multi-decadal variability in water mass influence along the migration routes.
Introduction
Wild Atlantic salmon (Salmo salar) populations from many North Atlantic rivers have declined over the last few decades (Olmos et al. 2019, ICES 2023). Although management action is mainly focused on the freshwater stage of the salmon life cycle, the continuing population declines are thought to be driven by reduced marine survival (Chaput 2012, Thorstad et al. 2012, Olmos et al. 2019). This has led to calls for the evaluation of potential indicators of salmon marine survival (ICES 2020, Bull et al. 2022). Links have been found between measures of salmon survival and potential indicators including large-scale climate indices (Beaugrand and Reid 2003, 2013, Jensen et al. 2011, Mills et al. 2013, Olmos et al. 2020), temperature (Friedland et al. 1998, 2000, 2003, Jensen et al. 2011, Olmos et al. 2020), and primary productivity (Mills et al. 2013, Olmos et al. 2020). This study uses data from an example set of southern European Atlantic salmon populations to investigate the potential of zooplankton energy as the basis of a marine indicator with a closer trophic link to salmon post-smolts.
Salmon migrate away from their natal rivers in spring and early summer and join shared migration routes to common feeding grounds (Thorstad et al. 2012, Gilbey et al. 2021, Lilly et al. 2023, Rodger et al. 2024). Migrational aggregations of southern European post-smolts are found along the continental shelf-edge off Ireland, Scotland, and Norway during April−June (Gilbey et al. 2021). Between leaving the river and the end of the first year at sea, they are known as post-smolts. This early marine phase is thought to be critical to the overall survival of a cohort, with high and highly variable mortality (Thorstad et al. 2012). There is evidence that growth and survival rates during this phase are declining (Peyronnet et al. 2007, Jonsson et al. 2016, ICES 2020, 2023, Todd et al. 2021, Trehin et al. 2021, Vollset et al. 2022, Long et al. 2023, Tréhin et al. 2023). Since body mass accumulated during the first few months at sea is important in determining the timing of maturation (Trehin et al. 2021), reductions in feeding opportunities at this time will also influence the proportion of salmon that delay maturation and remain at sea for more than one winter. Declines in growth and survival have been linked to reductions in quality and quantity of post-smolt prey (Utne et al. 2021, 2022), suggesting that a measure of post-smolt food availability could provide an indicator of salmon marine survival.
Salmon post-smolts are pelagic, generally remaining within the upper 5 m of water depth (Renkawitz et al. 2012). Their diet is varied but dominated by marine pelagic fish larvae plus amphipod crustaceans and smaller amounts of euphausiids and copepods (Rikardsen et al. 2004, Haugland et al. 2006, Utne et al. 2021). Fish species reported in southern European post-smolt stomachs include lesser sandeel (Ammodytes marinus), herring (Clupea harengus), blue whiting (Micromesistius poutassou), and other gadoids (Rikardsen et al. 2004, Haugland et al. 2006, Utne et al. 2021). The forage fish larvae consumed by salmon post-smolts are themselves planktivorous. Of the key fish species found in salmon post-smolt stomachs, larval blue whiting consumes a range of copepods, especially Calanus spp. (Conway 1980, Hillgruber and Kloppmann 1999, Bastrikin et al. 2014); larval herring diet is dominated by Calanus finmarchicus stages (Prokopchuk 2009), plus Oithona spp., Temora longicornis, and Euphausiids; larval sandeel prey includes copepods, polychaetes, crustacean larvae, amphipods, appendicularia, fish eggs, and fish larvae (Olin et al. 2022, and references therein). These forage fish species spawn in late winter and the larvae are present in the water column from April to June during the salmon post-smolt migration (Bartsch and Coombs 1997, Coull et al. 1998, Payne et al. 2012, Van Deurs et al. 2013, Frost and Diele 2022).
For the purposes of developing a marine indicator, there are currently insufficient data to determine how variability in forage fish larvae abundance directly affects post-smolt survival (ICES 2020, Vollset et al. 2022). For example, stock assessments for forage fish typically focus on spawning stock biomass and recruits to commercial fisheries rather than the larval stage, and are not spatially disaggregated (e.g. ICES 2022a, b). However, evidence suggests that feeding conditions for the forage fish themselves may be declining in areas of the northeast Atlantic: patterns of zooplankton abundance, phenology, and species composition have changed over the past 60 years (e.g. Beaugrand et al. 2003, Beaugrand and Reid 2003, Alvarez-Fernandez et al. 2015, Bedford et al. 2020, Holland et al. 2023, Ratnarajah et al. 2023). The drivers of these changes are not fully known but thought to be associated with changes in ecosystem productivity and range shifts due to warming temperatures (Beaugrand et al. 2009, Beaugrand and Reid 2013, Dupont et al. 2017, Schmidt et al. 2020, Edwards et al. 2021). We hypothesize that variability in the zooplankton energy available to the forage fish larvae consumed by salmon post-smolts (i.e. prey-of-prey energy) may be a useful indicator for the marine survival of post-smolts themselves. At this trophic level, openly available, long-term, high spatial, and temporal resolution abundance data for the northeast Atlantic exist in the form of continuous plankton recorder (CPR) sampling (Richardson et al. 2006), which have the potential to form the basis of an indicator for salmon marine survival.
Correlations have been reported between selected measures of salmon marine survival and zooplankton abundance across various spatial and temporal scales (Beaugrand and Reid 2003, 2013, Mills et al. 2013, Vollset et al. 2022). However, further work is required to develop a relevant zooplankton-based indicator for salmon survival, for several reasons. First, the indicator should be based on the zooplankton field of functional relevance to the post-smolt food chain, i.e. a measure of energy rather than abundance and summed over those zooplankton species consumed by the forage fish larvae featuring in the post-smolt diet. Second, although trends in marine survival of salmon have been sufficiently coherent over large geographical areas to suggest some synchrony by common drivers (the Moran Effect; Moran 1953), there is also evidence of regional variation where population responses diverge from a common trend or groups of populations exhibit a differential response to the same driver (e.g. Olmos et al. 2020, Pardo et al. 2021). Environmental drivers of mortality operate at a range of spatial and temporal scales, acting on all or subsets of salmon populations. Therefore, consideration of the environmental drivers acting at a regional scale will be useful in determining the mechanisms behind the complex hierarchy of survival controls (ICES 2020). Third, at what scale of averaging can variability in zooplankton energy provide a useful indicator of variation in salmon marine survival? Since zooplankton are predominantly post-smolt prey-of-prey rather than direct prey, what is likely to be the more relevant driver of post-smolt survival: zooplankton energy within salmon post-smolt migration corridors, or integrated over wider spatial areas used by forage fish and their zooplankton prey, and subsequently advecting into areas used by migrating post-smolts? Equally, over which time period is zooplankton energy likely to be linked to post-smolt survival: during-migration, averaged over the post-smolt year, or lagged by one or more years to represent energy accumulated through the food web over generations of forage fish and zooplankton adults, eggs, and larvae (e.g. Mills et al. 2013)?
The aim of the present study is therefore to use CPR zooplankton data and a new high-resolution regional ocean model reanalysis for the northeast Atlantic to investigate whether variability in zooplankton energy can explain spatial and temporal patterns of salmon return rates among a set of southern European populations. The approach is to (i) group the salmon populations by measuring synchrony in adult return rates between populations; (ii) define early marine space-time domains informed by the resulting population groupings and information on migration pathways and timing; (iii) derive a focused measure of zooplankton energy available to the forage fish prey of post-smolts; (iv) analyze how variability in this zooplankton energy is related to patterns in the grouped return rates; and (v) investigate regional environmental drivers of zooplankton prey energy.
Methods
Analyses were carried out using the MATLAB numerical computing environment [v23.2.0.2459199 (R2023b); The Mathworks Inc. 2021] and R Statistical Software (v4.3.2; R Core Team 2023).
Salmon population monitoring data and analysis
This study used time series of smolt emigration timing and adult return rates for a subset of salmon populations from southern Europe. These were the Bush in Northern Ireland, Corrib and Burrishoole in Ireland, Tamar and Frome in England, Dee in Wales, North Esk in Scotland, and Bresle and Scorff in France (Fig. 1). The data are derived from fish tagging and trapping as part of salmon population monitoring programs (Table 1).
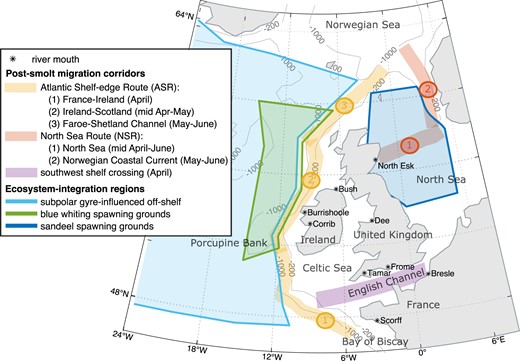
Study domain showing shared migration corridors, ecosystem integration regions, river mouth locations, and 200 and 1000 m contours, which delineate the continental shelf-edge. Legend indicates times when post-smolts are expected to occupy sections of migration corridor.
Summary of salmon population data.
| River | Smolt run data | Smolt run method | Returns data | Returns method | Organization | Reference |
|---|---|---|---|---|---|---|
| Bresle | 1996–2021 | Partial count by downstream trap 15 km from estuary. Catch efficiency estimated by mark and recapture. | 1983–2021 | Partial count by upstream trap 3 km from estuary. | INRAE | Josset et al. (2022) |
| Burrishoole | 1970–2019 | Full count in downstream traps on Mill Race River and Salmon Leap River channels between brackish Lough Furnace and fresh Lough Feeagh. | 1980–2021 | Full count in upstream traps. | Marine Institute, Ireland | de Eyto et al. (2022), Marine Institute (2020), Rogan et al. (2022) |
| Bush | 1978–2020 | Full count. Smolts diverted from main river into Wolf Trap at Bushmills salmon station 3.5 km from sea. | 1986–2021 | Full count by fish trap at Bushmills. | AFBI | Kennedy et al. (2022), Kennedy and Crozier (2010) |
| Corrib | N/A | N/A | 1980–2021 | Partial count by resistivity fish counter at Galway Weir. Counts verified by camera. | Inland Fisheries Ireland | Inland Fisheries Ireland (2021),2022) |
| Dee | 1997–2019 | Smolts caught by fyke nets (before 2000) and rotary screw traps (from 2000) at several sites on the lower main river and one on the Ceiriog tributary. Smolts tagged with coded wire tags. | 1993–2021 | Partial count by fish trap at Chester Weir (head of tide). Run size estimated by mark and recapture. Return rates estimated by screening of tags fitted to smolts. | Natural Resources Wales | Cefas et al. (2020) |
| Frome | 2006–2020 | Parr tagged with Passive Integrated Transponder (PIT) tags in autumn are detected moving downstream during smolt migration period in spring by two PIT antenna arrays at Bindon and East Stoke. A proportion of these smolts are recaptured by rotary screw trap after being diverted into a small side channel of the lower river at East Stoke using a bioacoustic fish fence. | 2002–2021 | Resistivity counter at East Stoke. Verified by trace waveform and video analysis. Additional estimate made from detection of PIT-tagged adults. | Cefas, Game and Wildlife Conservation Trust | Gregory et al. (2019), Ibbotson et al. (2013) |
| North Esk | 1975–2013 | Partial count in fish trap at Kinnaber Lade. Lade diverts 5–10% of migrating smolts depending on flow. Efficiency estimated by mark and recapture. | 1981–2009 | Full count by resistivity counter at Logie Weir (7 km from the sea) corrected for down-stream fisheries mortality. | Marine Scotland Science | Gurney et al. (2015), Marine Scotland (2021) |
| Scorff | 1997–2021 | Partial count by two downstream traps <1 km from estuary. Catch efficiency estimated by mark and recapture. | 1995–2021 | Partial count in two downstream traps <1 km from estuary. | INRAE | Buoro et al. (2019), Jeannot et al. (2023) |
| Tamar | 2005–2019 | Partial count by rotary screw trap. | 2002–2021 | Partial count by resistivity counter at Gunnislake Weir Fish Pass. Counts corrected for fish pass and counter efficiency (validated by video footage). | Environment Agency | Environment Agency (2004) |
Smolt emigration timing
Smolt emigration timing was available for all populations, apart from the Corrib. The length of the dataset varied by population; the longest was from the Burrishoole for 1970–2021 (Table 1). The method of smolt counting differed by river but was either a full count involving diverting migrating smolts from the main river, or a partial count, which was then raised to a full count using mark-and-recapture to estimate catch efficiency (Table 1). Following previous studies, we took the day of the 25th percentile of the cumulative distribution of smolt numbers leaving the river as a measure of annual “smolt run initiation” (e.g. Otero et al. 2014) (Fig. 2). This was used to indicate when post-smolts from each population were likely to enter the sea.
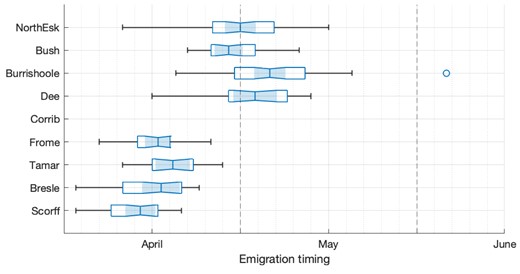
Box plot summary of variability in smolt emigration timing for each population, measured as 25th percentile of smolt count each year. Note that the populations are presented in order of latitude.
Adult return rates
Adult return rates were used as a proxy for overall marine survival, although it is recognized that return rates of salmon will vary with changes in both marine survival and maturation schedule, both of which are impacted by changes in marine conditions (Trehin et al. 2021). The method for estimating numbers of returners differed by river but was a full or corrected partial count by fish trap or counter (Table 1). Return rates were given as the percentage of emigrating smolts in a population that returned as adults after either one sea winter (1SW) or multiple sea winters (MSW, which aggregates fish spending two or more years at sea as per international stock assessment methods; ICES 2023). The time period covered varied by population (Table 1; time series in Supplementary Information).
For the Burrishoole, Bush, Dee, Corrib, and North Esk, return rates were to homewaters prior to any coastal fishery. For the Scorff, Bresle, Frome, and Tamar, return rates were to freshwater. This gave the potential that they were not directly comparable between populations, since homewater fisheries on salmon have been variable and decreasing over the past 40 years (e.g. Cotter et al. 2022, Cefas et al. 2023), so that including this mortality in the count of returning adults risked obscuring the “natural” signal of marine mortality. Care was taken to account for this. The homewater fishery on Scorff and Bresle salmon has been consistent and negligible over the reported period (M. Buoro, personal communication, January 2024). The homewater fisheries on the Tamar and Frome were phased out and finally ended on the Tamar in 2004, only 2 years into the return time for these populations. Finally, published homewater fisheries exploitation rates for the River Dee (Cefas et al. 2023), approximately back-calculated to estimate homewater return rates (neglecting any natural mortality in homewaters), show only a small and consistent difference between the two rates (Supplementary Information). In addition, all analyses in this study use normalized return rates, reducing the importance of particular values and emphasizing trends and variability.
Synchrony in return rates
The 1SW and total (1SW+MSW) return rates were analyzed to check for synchrony. Synchrony between populations can be measured in various ways to capture different aspects of the dynamics (Buonaccorsi et al. 2001). The return time series exhibits autocorrelation, which must be accounted for to avoid false detection of significant correlation. Following Pyper and Peterman (1998) and Buonaccorsi et al. (2001), we used two complimentary measures of population-pairwise synchrony: (i) Pearson’s correlation r in return rates, with the “modified Chelton” stricter test for significance whereby the degrees of freedom are adjusted for autocorrelation (Pyper and Peterman 1998) (Supplementary Information) and (ii) Pearson’s correlation rdiff of the difference in return rates between consecutive years, which acts to detrend the time series. r is a measure of synchrony in long-term (low-frequency) fluctuations and rdiff is a measure of synchrony in interannual (high-frequency) fluctuations.
From the synchrony measures, we calculated a distance measure as 1 minus synchrony, giving 0 for full synchrony, 2 for asynchrony, and values ∼1 for little to no synchrony. This was used for cluster analysis using R packages proxy (Meyer and Buchta 2022) and cluster (Maechler et al. 2023). Since the resulting cluster structure can depend on the algorithm, we compared two commonly used methods: agglomerative hierarchical clustering and partitioning around medioids. For the hierarchical clustering, we used the Ward measure of similarity between clusters but also checked the sensitivity to other measures. The output was used to determine the most stable cluster structure with varying dendrogram cut-off heights (hierarchical clustering) and a pre-specified number of clusters (PAM). The agglomerative coefficients and silhouette widths, which indicate the degree of dissimilarity of a population to other populations in the same cluster compared with those in other clusters, were used to assess the strength of the structure. Values close to 1 indicate strong clustering, while values close to 0 indicate that a population is only weakly tied to the allocated cluster. In determining the final clusters to analyze further, we also took into account geographical factors, especially for those populations only weakly tied to a cluster.
Where the analysis identified groups of synchronized populations, a combined return time series for each group was obtained by normalizing the return rates and summing over each population in the group for each year. Populations were weighted equally. Normalization was calculated as z-scores, i.e.
Deriving zooplankton energy available to forage fish larvae
We define “zooplankton energy available to forage fish larvae” (ZEFF) as a measure of zooplankton energy in taxa found in the diet of forage fish larvae in the diet of salmon post-smolts, i.e. salmon post-smolt prey-of-prey. The zooplankton species featured in the forage fish larvae diet have been identified from diet studies and ZEFF is then a measure of available zooplankton energy in the water column; no forage fish larvae stomach data have been analyzed as part of this study.
ZEFF is derived from Continuous Plankton Recorder (CPR) data for the northeast Atlantic (Johns 2022, 2023). The CPR survey is a large-scale, long-term marine sampling program collecting plankton on reels of silk towed by ships of opportunity (Richardson et al. 2006). The calculation of ZEFF is a modification of the method developed by Olin et al. (2022) to represent potential zooplankton energy in the diet of the sandeel Ammodytes marinus (hereafter sandeel) in the northeast Atlantic. Olin et al. (2022) identified the zooplankton species in the sandeel prey field from diet studies, matched them with standard CPR taxonomic groups, and simplified by including only prey found in at least 5% of CPR samples in the area (see Supplementary Information). Olin et al. (2022) corrected for the CPR’s variability in sampling efficiency for different taxa (Clark et al. 2001, Kane 2009) by comparing with independent plankton time series from Stonehaven on the Scottish east coast (Bresnan et al. 2015) and the L4 station on the English south coast (Atkinson et al. 2019). Diel vertical migration was accounted for by calculating separate factors for samples collected during day and night. Abundance was converted to energy content using taxon-specific wet weight and energy density. No correction was attempted for variation in energy content with season and year.
Here, we used the same study area (Fig. 5), updated the CPR dataset to 2019 (the most recently available year), and modified the species list to represent zooplankton found in the diet of the fish larvae in the diet of salmon post-smolts. Based on the forage fish larvae diet information outlined in Section 1, the prey taxa included by Olin et al. (2022) in the calculation of zooplankton prey energy in the sandeel diet are also representative of the diet of the broader range of forage fish larvae important in the salmon post-smolt diet, with the addition of Euphausiids, which are consumed by larval blue whiting and herring. We therefore updated the dataset of Olin et al. (2022) taxonomically to include the standard CPR group Euphausiacea.
Marine variables
We investigated potential bottom-up drivers of variability in ZEFF by compiling physical and biological marine data and averaging them and ZEFF at space-time scales of relevance to post-smolt migration and feeding (see Section 2.4).
Sea surface temperature, salinity, and phytoplankton concentrations
Sea surface temperature (SST), salinity, and phytoplankton concentrations were derived from the Atlantic Margin Model (AMM7v5) 3D coupled physical–biogeochemical ocean model reanalysis (1993–2021) for the northwest European shelf (Copernicus Marine Environment Monitoring Service; Tonani and Ascione 2021). The domain covers 20°W–13°E and 40°N–65°N at ∼7 km resolution. This model is the highest-resolution model available, covering the entire geographical area used by southern European post-smolts and providing both physical and biogeochemical variables.
SST was taken as water temperature in the model surface layer (up to 1 m water depth). Salinity was averaged from 50 to 500 m water depth as an indicator of interannual variability in the balance of water masses in the upper ocean (e.g. Johnson et al. 2013, Holliday et al. 2020), which has an influence on production in lower trophic levels. Surface layers were omitted to avoid seasonal and coastal influences that may confuse water mass classification.
Phytoplankton concentrations were integrated over the euphotic zone, taken here as 0–50 m model depth. We use output for 1998 onwards, for which the model assimilates satellite ocean color data; earlier years have a weaker match with historical observations (Tonani and Ascione 2021). To characterize interannual variation in seasonal phytoplankton dynamics, we apply phenology metrics: following previous studies, spring bloom initiation is defined as the date on which cumulative phytoplankton concentration exceeds 15% of the annual total and duration as the number of days between 15 and 85% of the total (Siegel et al. 2002, Platt and Sathyendranath 2008, Platt et al. 2009, Brody et al. 2013).
Subpolar gyre index
The marine climate of regions used by post-smolts is influenced by the strength and extent of the subpolar gyre (SPG), which affects the relative influences of subpolar and subtropical water masses and exerts bottom-up control on productivity and species assemblages in northeast Atlantic, North Sea, and Norwegian Sea (e.g. Holliday et al. 2000, Hátún et al. 2009, 2016, Johnson et al. 2013, Jones et al. 2018, Koul et al. 2019). We use the SPG index formulated by Hátún and Chafik (2018) (1993–2018) (Chafik 2019) (Supplementary Information), which characterizes the strength and extent of the SPG. A high index corresponds to an expansion of cold, low-salinity subpolar waters into the northeast Atlantic, while a low index corresponds to a contraction of the SPG and increased northward intrusion into the northeast Atlantic of relatively warm, high-salinity subtropical waters. A strong SPG is associated with low phytoplankton biomass and a high abundance of Calanus finmarchicus and other cold water zooplankton species, and vice versa.
Defining space-time averaging scales
ZEFF, marine variables, and relationships with salmon return rates were analyzed on a range of scales: (i) annual means gridded across the northeast Atlantic; (ii) annual and during-migration means within shared post-smolt migration corridors; and (iii) annual and lagged means within “ecosystem-integration” regions representing the flow of energy through the post-smolt food web (Fig. 1 and Table 2).
Summary of spatial and temporal averaging scales and which populations and population groupings are relevant to each region.
| Averaging scale | Spatial | Temporal | Relevant to populations | Relevant to population groupings |
|---|---|---|---|---|
| Gridded northeast Atlantic | 1° latitude by 2° longitude rectangles over 40°N–70°N and 25°W–15°E | Annual | All | All |
| Migration corridors | Southwest shelf crossing | Annual and during-migration | Frome, Tamar, and Bresle | Channel |
| Atlantic Shelf Crossing (ASR) | All except North Esk | Channel, West | ||
| North Sea Route (NSR) | North Esk | East | ||
| Ecosystem integration region | Blue whiting spawning grounds | Annual and lagged | All | All |
| Sandeel spawning | All | All | ||
| Subpolar gyre influenced | All | All |
Gridded northeast Atlantic
To examine how trends in ZEFF have varied across the northeast Atlantic, CPR samples were binned into 1° latitude by 2° longitude rectangles over the CPR dataset domain of 40°N–70°N and 25°W–15°E (Fig. 5). Trends in annual mean ZEFF were calculated for samples within each bin (Section 2.5).
Shared post-smolt migration corridors
The main “shared migration corridors” for post-smolts were identified from published telemetry, trawl, and particle tracking simulation data on post-smolt occurrence in the northeast Atlantic (Fig. 1). These data suggest three main migration corridors joined by post-smolts from multiple southern European populations once they have undertaken their initial journey away from the coastline and shallow shelf seas:
Atlantic Shelf-Edge Route (ASR): High concentrations of post-smolts are observed in the European continental shelf-edge current (Shelton et al. 1997, Mork et al. 2012, Ounsley et al. 2020, Gilbey et al. 2021). This represents the most plausible shared route for all the populations in this study, apart from the North Esk in northeast Scotland. The route follows the continental shelf-edge and the slope current from the Bay of Biscay, west of Ireland and the UK, to the Norwegian Sea.
North Sea Route (NSR): Initial routes taken by post-smolts from east and northeast UK rivers are less well known. It is expected that they utilize strong flows such as the Dooley Current to travel across the North Sea (Turrell 1997, Main 2021, Newton et al. 2021) (North Sea Route; NSR). Gilbey et al. (2021) identified post-smolts of UK origin off southwest Norway in June, providing evidence that they take this route to the Norwegian Sea. This is the route assumed for the North Esk population.
Southwest shelf crossing (SWSC): While post-smolts from west coast UK/Ireland rivers and the River Scorff in France enter the sea closer to the shelf-edge than many other southern European populations, those from rivers around the English Channel have a greater on-shelf distance to cover before they reach the deeper water and strong shelf-edge currents. For completeness, we therefore also consider a corridor from close to the River Bresle (France) west to the shelf edge. This section, followed by the ASR, is the assumed route for the Bresle, Tamar, and Frome populations.
To simplify the analysis, the migration corridors were broken into several sections (Fig. 1). The times when each section was likely to be occupied by post-smolts were determined from post-smolt trawl data (Gilbey et al. 2021) and the smolt emigration timing for the study populations (Fig. 2).
ZEFF and the environmental variables were extracted within a 100-km-wide locus around the curvilinear axes defined by these migration corridors. Mean values were then calculated within each segment of corridor for two temporal windows: (i) the yeardays when post-smolts are likely to be occupy each section and (ii) over the whole year.
Ecosystem integration regions
Larger integration regions were chosen based on post-smolt feeding ecology and represent ZEFF in the key forage fish spawning areas passed through by post-smolt migration corridors, as well as transport of forage fish and zooplankton into the salmon post-smolt migration corridors from the wider northeast Atlantic. The southern European post-smolt diet is dominated by sandeel and gadoids (Utne et al. 2021); given the overlap of the migration routes with large blue whiting spawning grounds along the continental shelf-edge, it is likely that the latter are predominantly blue whiting. Although herring larvae feature heavily in the diet of northern European post-smolts, they appear to be less important for southern European post-smolts (Utne et al. 2021). Therefore, we focus on sandeel and blue-whiting spawning areas.
The chosen areas were not meant to be an exhaustive representation of all areas relevant to forage fish prey of post-smolts. Rather, they allow an experimental assessment of whether zooplankton prey energy over a wider area and time period may be a more relevant and ecologically tied indicator of post-smolt survival than prey energy within post-smolt migration corridors. To this end, the following regions were chosen (Fig. 1):
Blue-whiting spawning grounds. Blue whiting spawns on the Porcupine Bank and areas west of Scotland, coincident with post-smolt migration routes, during March–April (Payne et al. 2012).
Sandeel spawning grounds. Sandeel utilize sandy banks in the northern North Sea and the pelagic larvae will be present in the water column from March (Coull et al. 1998).
SPG-influenced off-shelf region. This represents the variable advection of oceanic water masses into post-smolt migration areas and their influence of zooplankton production and composition (e.g. Hátún et al. 2009).
For each of these regions, annual means of ZEFF and the environmental variables were calculated.
It would be desirable to include the southern Norwegian Sea, the accepted common summer feeding area for southern European post-smolts (Gilbey et al. 2021). However, CPR coverage in this area is too patchy spatially and temporally to allow a statistically robust comparison with the salmon return rate data (Fig. 5).
Trends in ZEFF
Trends in ZEFF for each spatial averaging scale were calculated by fitting the linear model log10(ZEFF + 1) ∼ y, where y is the sample year and ZEFF has units of mg C m−3. This transformation is used to ensure a normal distribution while including the zero-value samples. The decadal fractional change in ZEFF is 1010m − 1, where m is the slope of the linear model above. The regression on year could be biased if the timing of CPR sampling changed over 1958−2019. However, because the CPR is deployed on ships of opportunity rather than through a random sampling strategy, the same routes are used each month. This maintains consistent sampling timing (Richardson et al. 2006). For the data used here, a more complex statistical model that controlled for the timing of sampling within the year gave similar results and found no significant trend in year day.
Trends in ZEFF were only calculated for averaging areas with >40 years of CPR data, including pre-1980 and post-2000 to match with the available data on salmon return rates. The trends were calculated for during-migration ZEFF for the migration corridor sections and for annual ZEFF for all averaging regions.
Correlations between return rates, ZEFF, and environmental covariates
Correlations between annual and during-migration mean ZEFF in the post-smolt year and the grouped salmon population marine return rates for salmon returning the following year, and between ZEFF and the environmental covariates, were calculated at each spatial averaging scale using Pearson’s correlation coefficient with the modified Chelton method test for significance (Section 2.1.3). Where a trend was present in the time series, a detrended correlation was also calculated to look for correlation in interannual fluctuations. For the ecosystem integration scale, the same correlation methods were applied with a lag of 1−4 years. This allowed examination of the lag maximizing the cross-correlation at this scale.
For the migration corridors, correlations between ZEFF and the grouped return rates were only calculated for relevant sections for each population group. A section was considered relevant to a group if the location of the river mouth suggested that post-smolts from one of the populations within the group would be likely to pass through that region. For the ecosystem integration regions correlations were calculated for all population groups to account for advection over long time scales.
Throughout, we follow the proposal of Muff et al. (2022) to move away from binary conclusions in ecology by replacing comparison against a single threshold P-value (usually 0.05) with a gradual “language of evidence.” This approach has been used in other fields and in reporting of meta-analyses. The proposed bands are: “little or no evidence” for P ≥.1; “weak evidence” for P <.1; “moderate evidence” for P <.05; “strong evidence” for P <.01; and “very strong evidence” for P <.001 (Muff et al. 2022).
Results
Synchrony in return rates
The correlation analysis revealed consistent groups of salmon populations showing synchrony in their marine return rates. The analysis of 1SW and total returns resulted in the same clustering and results are presented here for 1SW returns for simplicity.
The two methods of clustering gave essentially the same results and reflected the significant pairwise synchrony measures (Supplementary Information). The dendrogram (Fig. 3) showed two main clusters: (i) Bush, Burrishoole, Corrib, Scorff, and Dee, and (ii) Bresle, Tamar, Frome, and North Esk. PAM analysis with two clusters agreed, except the River Dee moved clusters. The overall strength of the first cluster was 0.4, indicating fairly weak coherence. The Bush, Scorff, and Burrishoole were the most tightly bound to this cluster, with the Corrib less similar. The second cluster was less coherent: the North Esk, Frome, and Dee had low silhouette widths, indicating relatively weak similarity to the other populations in the cluster. Cutting the dendrogram earlier, or increasing the number of clusters in PAM, resulted in the Frome and Dee each forming a singleton cluster. Given the uncertainty around the Dee and Frome populations, we retain them within the clusters containing the most geographically nearby populations. Similarly, we consider the North Esk separately, as its location on the northeast UK coast means its post-smolts use a different initial migration area to the other populations.
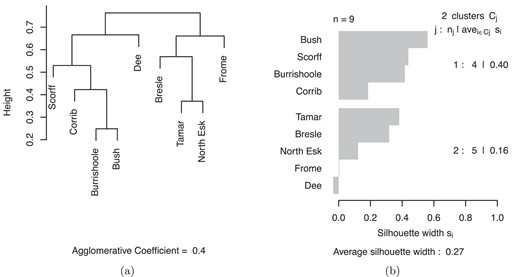
Clustering of one sea winter salmon return rates: (a) dendrogram from hierarchical clustering and (b) silhouette plot from partitioning around medoids. Agglomerate coefficient and silhouette width indicate the strength of clustering.
These results suggest the following population groupings: (i) West Coast river populations (“West group”): Burrishoole, Bush, Corrib, Dee, and Scorff; (ii) English Channel river populations (“Channel group”): Bresle, Tamar, and Frome; and (iii) East Coast river populations (“East group”), represented in these analyses by the North Esk. The resulting normalized combined return time series are shown in Fig. 4.
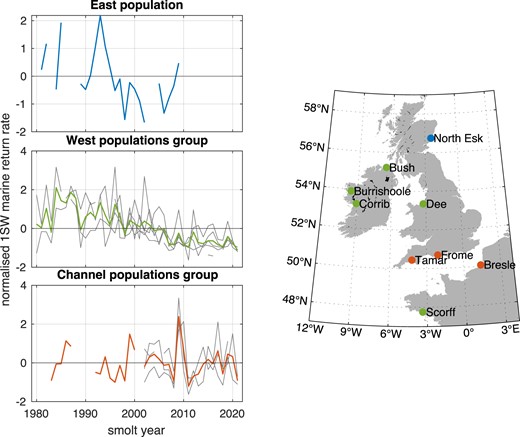
Population groupings: normalized 1SW return rate by population (thin lines) and combined 1SW return rate by population grouping (thick lines).
Trends in total zooplankton energy available to forage fish
Gridded northeast Atlantic scale
ZEFF significantly and dramatically declined throughout much of the northeast Atlantic over the last six decades (Fig. 5). The areas experiencing the largest declines were in off-shelf areas (Fig. 6). ZEFF similarly showed a pattern of decline in all coastal regions except the English Channel and Celtic Seas, where there were some significant increases. For most of the Norwegian Sea, there were insufficient CPR samples to calculate the trend in this way. There was no CPR sampling in the Norwegian Sea from 1982 to 2008, so it was not possible to calculate a trend in ZEFF or correlations with return rates. However, mean annual ZEFF for the 2000s and 2010s was a third of the mean for the 1960s and 1970s and appears to be still declining (Supplementary Information). For the area southwest of the Vøring Plateau, the same pattern of decline in ZEFF was exhibited.
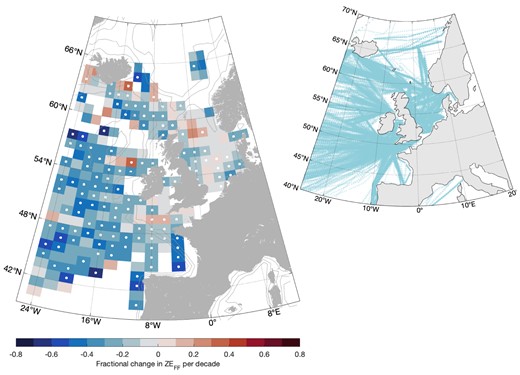
Decadal trend in zooplankton energy available to forage fish. Over all zooplankton taxa. Dot indicates P <.05. Inset shows locations of Continuous Plankton Recorder samples 1958–2019.
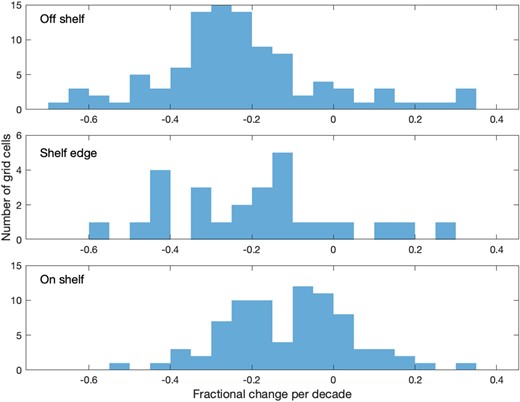
Comparison of decadal trends in annual zooplankton energy for off-shelf (water depth >800 m), shelf-edge (between 200 and 800 m), and on-shelf (<200 m) regions. The plots show the count of 1° longitude by 2° latitude grid cells, as shown in Fig. 5 in each trend bin.
Migration corridor scale
These patterns also held within the post-smolt migration corridors. For annual mean ZEFF within the ASR, there was moderate (France–Ireland; P =.41) to very strong (Faroe–Shetland Channel; P <.001) evidence of a decline per decade of 5.6–13%. For annual mean ZEFF within the NSR, there was strong evidence of a decline of 14% across the North Sea (P <.001) and 12% in the Norwegian Coastal Current (P <.001) (Table 3). In contrast, there was strong evidence of an increase in annual mean ZEFF of 7% per decade on the southwest shelf. For during-migration ZEFF, trends were in the same direction but with generally weaker or no statistical evidence.
Trends in zooplankton energy zooplankton energy ZEFF in migration corridor sections and ecosystem integration regions.
| Annual average ZEFF | During-migration ZEFF | |||
|---|---|---|---|---|
| Migration corridor section | Trend (%/decade) | P | Trend (%/decade) | P |
| ASR France–Ireland | −5.6 | .041* | ||
| ASR Ireland–Scotland | −13.0 | .0053** | −16.0 | .09· |
| ASR Faroe–Shetland Channel | −12.0 | <.001*** | ||
| NSR North Sea | −14.0 | <.001*** | −18.0 | <.001*** |
| NSR Norwegian Coastal Current | −12.0 | <.001*** | −11.0 | .036* |
| Southwest shelf crossing | 7.0 | .0072** | 17.0 | .012* |
| Ecosystem integration region | ||||
| Blue whiting spawning grounds | −10.0 | .016* | ||
| SPG-influenced offshore | −10.0 | <.001*** | ||
| Sandeel spawning grounds | −11.0 | <.001*** |
Symbols indicate P-values: no symbol P ≥.1; ·P <.1; *P <.05; **P <.01; and ***P <.001.
Ecosystem integration scale
There was very strong evidence that mean annual ZEFF declined in the offshore SPG-influenced (10% per decade; P <.001) and sandeel spawning grounds (11% per decade; P =.001) regions, and moderate evidence of a decline in the blue whiting spawning region (10% per decade; P =.016) (Fig. 7 and Table 3).
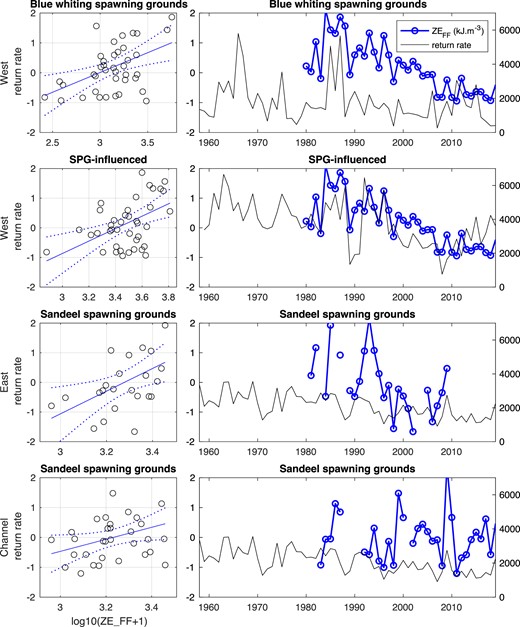
Zooplankton energy within ecosystem integration regions and grouped 1SW return rates for combinations with significant correlations. Time series shown for number of years’ lag giving peak cross-correlation.
Trends by zooplankton taxonomic group
The decadal trends in annual mean ZEFF varied by zooplankton group (Fig. 8). In the northern half of the northeast Atlantic, prey energy from C. finmarchicus significantly declined while C. helgolandicus increased, especially in the North Sea. As a result, the trend in total Calanus (calculated as the sum of C. finmarchicus, C. helgolandicus, and unidentified copepodite stages) was a patchwork of positive and negative and did not drive the overall decline in mean annual ZEFF in the northeast Atlantic. Instead, the trend was driven by a significant decline in small copepod abundance (the sum of Acartia spp., Oithona spp., Para-Pseudocalanus spp., and Temora longicornis) and Euphausiidae. The trends in Hyperiidae abundance were mixed, with a significant increase on-shelf and mostly a decline off-shelf.
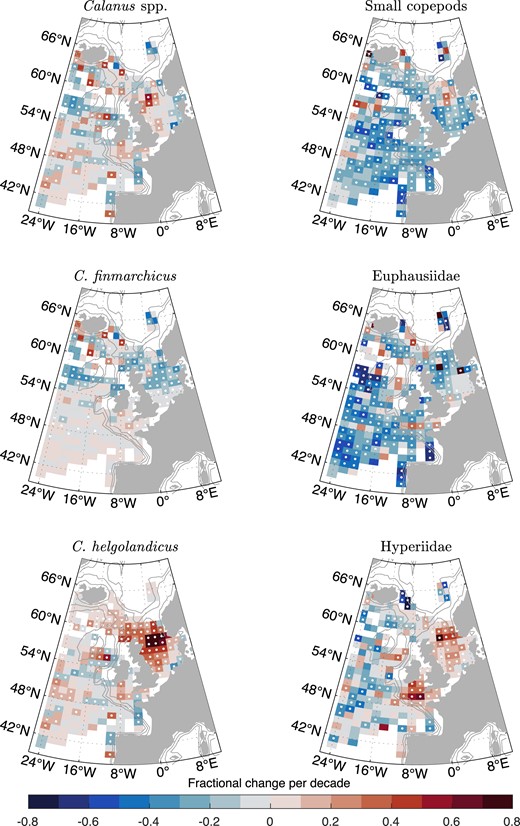
Decadal trend in zooplankton energy available to forage fish for key zooplankton groups. White dots indicate P <.05.
Correlation between zooplankton energy and salmon return rates
Gridded northeast Atlantic scale
Across the northeast Atlantic, 1SW returns to the West group were significantly positively correlated with annual ZEFF in many areas, including the Bay of Biscay, European shelf edge, off-shelf west of Ireland/UK, and Faroe–Shetland Channel for the time series and the detrended time series (Fig. 9). In the North Sea, the correlation was positive for the time series and negative for the detrended time series.
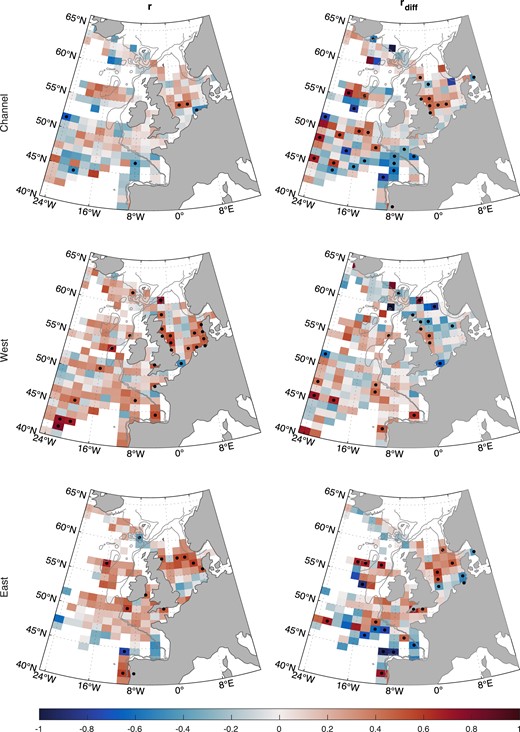
Correlation between time series (r) and detrended time series (rdiff) in annual zooplankton energy (ZEFF) and 1SW returns for each population grouping. Dots indicate P <.05. White space indicates insufficient data.
Returns to the East group (North Esk population) were significantly positively correlated with annual ZEFF along the shelf-edge and in the North Sea for the time series and the detrended time series.
The time series of 1SW return rates to the Channel group were not correlated with annual ZEFF in any region. However, the detrended time series were correlated negatively in the Bay of Biscay and positively to the west of the UK, especially around the blue-whiting spawning areas.
Migration corridor scale
At migration corridor scale, there were several significant correlations between 1SW return rates to the West group and ZEFF along the ASR (Table 4). For annual averaging of ZEFF, there was a positive correlation from Ireland to Scotland between the time series (moderate evidence; PMC =.017) but not the detrended time series. For during-migration averaging of ZEFF, there was a positive correlation from Ireland to Scotland between the time series (weak evidence; PMC =.095) and the detrended time series (weak evidence; Pdiff =.10), and there was a positive correlation from France to Ireland for the detrended time series (moderate evidence; Pdiff =.027).
Correlation between grouped 1SW return rates and zooplankton energy ZEFF in migration corridor sections (during-migration and annually) and ecosystem integration regions.
| Correlation of ZEFF with normalized merged 1SW return rates (2 s.f.) | |||||||||||||||
|---|---|---|---|---|---|---|---|---|---|---|---|---|---|---|---|
| Channel returns | West returns | East returns | |||||||||||||
| Along corridor: during | r | PMC | rdiff | Pdiff | r | PMC | rdiff | Pdiff | r | PMC | rdiff | Pdiff | |||
| Southwest shelf crossing | −0.19 | .30 | |||||||||||||
| ASR France–Ireland | −0.16 | .38 | 0.25 | .12 | 0.35 | .027* | |||||||||
| ASR Ireland–Scotland | 0.28 | .25 | 0.35 | .095· | 0.39 | .10· | |||||||||
| ASR Faroe–Shetland Channel | −0.044 | .81 | 0.030 | .86 | −0.14 | .42 | |||||||||
| North Sea | 0.33 | .12 | 0.34 | .16 | |||||||||||
| Norwegian Coastal Current | 0.16 | .48 | −0.070 | .81 | |||||||||||
| Along corridor: annual | |||||||||||||||
| Southwest shelf crossing | −0.029 | .87 | −0.083 | .61 | 0.012 | .94 | |||||||||
| ASR France–Ireland | −0.23 | .20 | 0.14 | .39 | 0.06 | .72 | |||||||||
| ASR Ireland–Scotland | 0.13 | .51 | 0.41 | .017* | 0.25 | .14 | |||||||||
| ASR Faroe–Shetland Channel | −0.074 | .69 | 0.16 | .32 | 0.016 | .92 | |||||||||
| North Sea | .49 | .018* | 0.33 | .17 | |||||||||||
| Norwegian Coastal Current | .40 | .054· | 0.36 | .12 | |||||||||||
| Ecosystem integration | lag | lag | lag | ||||||||||||
| Blue whiting spawning grounds | 0.11 | .57 | 0.45 | .0051** | 0.24 | .15 | 0–1 (0) | .51 | .013* | 0.36 | .13 | 0 | |||
| SPG-influenced region | −0.082 | .66 | 0.47 | .0086** | 0.0010 | 1.00 | 0–4 (1) | .49 | .023* | 0.41 | .085· | 0 | |||
| Sandeel spawning grounds | 0.35 | .052· | 0 | 0.58 | .0017** | 0.046 | .78 | 0–4 (1) | .55 | .0095** | 0.42 | .077· | 0–2 (1) | ||
Along-corridor statistics shown only for regions utilized by post-smolts from each population grouping. Detrended (diff) correlations calculated only where trends are present in the time series. Lag indicates years of lag giving significant correlation; peak of cross-correlation given in brackets. Symbols indicate P-values, as previously defined.
Return rates to the East group were positively correlated with annual mean ZEFF along the NSR North Sea (moderate evidence; PMC =.018) and Norwegian Coastal Current sections (weak evidence; PMC =.053) for the time series but not the detrended time series. There were no significant correlations for during-migration averaging of ZEFF.
Return rates to the Channel group were not correlated with during-migration or annual ZEFF in any migration corridor section for the time series or the detrended time series.
Ecosystem integration scale
Annual ZEFF in the blue-whiting larval spawning grounds was positively correlated with 1SW returns to the West (strong evidence; PMC =.0049) and East (moderate evidence; PMC =.013) but not Channel groups (Table 4 and Fig. 7). These correlations held for 0–1 years of lag for the West group, peaking in the post-smolt year, and only with no time lag for the East group. The correlations were significant for the time series but not detrended time series.
Annual ZEFF in the SPG-influenced region was positively correlated with 1SW returns to the West group for the time series (PMC =.0086) but not the detrended time series. The correlation was significant for 0–4 years lag and strongest at 1 year lag (Table 4 and Fig. 7). Annual ZEFF in this region was positively correlated with 1SW returns to the East group for the time series (moderate evidence; PMC =.023) and detrended time series (weak evidence; Pdiff =.085) with no time lag but not with a time lag. There were no significant correlations with Channel group returns for this region.
Annual ZEFF in the sandeel spawning grounds region was positively correlated with 1SW returns to the Channel group (weak evidence; PMC =.052) at 0 years of lag, West group (strong evidence; PMC =.0017) at 0–4 years lag (peak 1 year), and East group (strong evidence; PMC =.0095) for 0–2 years lag (peak 1 year) for the time series (Table 4 and Fig. 7). For the East group, this also held for the detrended time series (weak evidence; Pdiff =.077).
Correlation between explanatory variables and zooplankton energy
Trends in marine variables, and correlations between these and ZEFF, were similar at all spatial and temporal averaging scales, although generally there was a tendency for more statistically robust association at the larger, ecosystem integration scale and with annual ZEFF. For brevity, therefore, this section presents results only at this scale.
Salinity, SST, and annual phytoplankton concentration followed similar patterns in each ecosystem integration region: an increase from 1993 until the mid-2000s and subsequent decrease from 2010 to 2021 (time series shown in Supplementary Information). This was in line with decadal variability in the SPG strength (Supplementary Information). Overlaid on these general patterns was interannual variability and some trends: a significant increase in SST of 0.18°C per decade within the sandeel spawning grounds (moderate evidence; P =.039) and increase in annual total phytoplankton concentration of 0.12 mg C m−3 per decade in the SPG-influenced region (strong evidence; P =.0044). The spring-summer bloom shifted ∼6 days earlier per decade in the sandeel spawning grounds (very strong evidence; P <.001). No trends were found in other regions.
The correlation analysis between annual ZEFF and potential explanatory marine variables (time series in Supplementary Information) found several significant relationships (Table 5).
Correlation between zooplankton energy (ZEFF) and environmental variables in the ecosystem integration regions.
| Correlation with ZEFF in integration region (2 s.f.) | ||||||
|---|---|---|---|---|---|---|
| Blue-whiting spawning | SPG-influenced region | Sandeel spawning grounds | ||||
| Variable | r | PMC | r | PMC | r | PMC |
| Sea surface temperature | −0.23 | .27 | −0.39 | .053· | 0.094 | .65 |
| Salinity | 0.12 | .55 | −0.48 | .020* | 0.18 | .37 |
| Phytoplankton concentration | −0.047 | .84 | −0.11 | .65 | −0.23 | .31 |
| Bloom start | −0.063 | .79 | 0.28 | .22 | 0.39 | .083· |
| Bloom duration | 0.49 | .023* | −0.057 | .81 | −0.30 | .19 |
| Subpolar gyre index | 0.028 | .89 | 0.44 | .030* | 0.093 | .65 |
Symbols indicate P-values: no symbol P ≥.1; · P <.1; * P <.05; ** P <.01; and *** P <.001.
First, annual ZEFF within the SPG-influenced region was positively correlated with the SPG index (moderate evidence; PMC =.030) and negatively correlated with SST (weak evidence; PMC =.053) and salinity (moderate evidence; PMC =.020). In other words, water mass influence mediated by the SPG explained some of the variability in annual ZEFF in this region. There was no evidence of a correlation between annual ZEFF and the physical variables in the other ecosystem integration regions.
Second, there was evidence of an influence of phytoplankton phenology on ZEFF. In the blue whiting spawning grounds, annual ZEFF was positively correlated with the duration of the spring bloom (moderate evidence; PMC =.023). In the sandeel spawning grounds, ZEFF was negatively correlated with earlier spring blooms (weak evidence; PMC =.083).
Discussion
This study demonstrated the potential of zooplankton energy as the basis of a regional indicator of salmon marine survival. Salmon populations were grouped according to synchrony in their marine return rates and correlations were calculated with a focused measure of zooplankton energy at a range of scales relevant to the post-smolt early marine phase.
The populations showed evidence of regional clustering that was not entirely related to geographical proximity. The zooplankton energy metric ZEFF, which declined dramatically over large parts of the northeast Atlantic, was correlated with marine return rates for some population groups over relevant spatial regions. Statistical links were generally more robust at the annual rather than during-migration, and ecosystem-integrated rather than migration-corridor scale. ZEFF was found to be linked to climatic variability and phytoplankton phenology.
Regional groupings of populations
For most populations, the clusters based on synchrony in patterns of marine return rates were as expected from geographical considerations, with proximate rivers showing greater correlation. This has been found for some groups of Norwegian rivers (Jensen et al. 2011, Vollset et al. 2022) and North Atlantic stocks in general (Mills et al. 2013, Olmos et al. 2020) and is indicative of proximate populations likely to experience a similar marine environment. Based on geographical proximity alone, it would have been expected that returns to the Scorff would be more closely synchronized with French/English than West UK/Irish populations. The result suggests that the Scorff population shares a common driver with West UK/Irish populations. There was significant residual variability within the population groups, i.e. much of the variability is idiosyncratic to the individual population. This is as expected because each population is genetically adapted to the conditions of its particular river, and return rates are affected by a hierarchy of drivers from local to global scale (Pardo et al. 2021, Bull et al. 2022).
The same river groupings emerged in analysis of 1SW or total return rates, suggesting that the synchronizing influences were operating during the early marine phase. This was in line with previous work, which reported changing marine conditions affecting survival and growth during the post-smolt stage (Friedland et al. 2009, Beaugrand and Reid 2013, Olmos et al. 2019, 2020, Trehin et al. 2021).
The method of combining the time series over non-missing values avoided losing valuable data but could result in time series that emphasize trends from some populations over others with less complete data. Return rate time series for the West population group were complete from 1995. Therefore, although the early part of the combined time series was dominated by returns to the Bush, Burrishoole, and Corrib, the period of steepest decline from the mid-1990s for all populations in this cluster was well represented. The Channel population group was complete from 2000 onwards, so the early part of the combined time series was based on Bresle data alone. However, the Bresle data pre-2000 had several missing values, so most of the combined time series was made up of data from all three populations in this cluster. It is considered that this method should not materially affect the results.
Declining zooplankton prey energy
The approach taken here describes a zooplankton field of functional relevance to the post-smolt food chain and allows the conclusion that feeding conditions within that particular food chain have degraded. This work shows that total zooplankton prey energy available to the forage fish larvae prey of salmon post-smolts has declined significantly and dramatically over large regions of the northeast Atlantic (and especially in the North Sea), and within specific salmon migration corridors, over the past 60 years.
There is some regional variation, with the strongest declines off-shelf and in the North Sea, and areas of mixed or increasing total prey energy in the Celtic Sea and Channel. These differences may help explain why the River Scorff return rates were more in line with populations from west coast UK/Ireland: these populations have a shorter shelf transit into off-shelf waters compared with the Channel populations. In other words, the Scorff and west UK and Ireland salmon smolts may be experiencing declining feeding conditions at an earlier stage of their marine migration, while Channel fish spend longer transiting shallower shelf seas that have not seen such a strong decline in prey energy. Such a result suggests further work on environmental variability within immediate near-shore/shallow shelf regions relevant to each population could identify mechanisms driving variation in post-smolt mortality during the very early stages of migration (e.g. Olmos et al. 2020).
Previous work has reported a decline in total small copepods, C. finmarchicus, and euphausiids in parts of the northeast Atlantic up to 2010 (Beaugrand and Reid 2013). Other studies have noted declines in zooplankton in the North Sea, Norwegian Sea, and wider northeast Atlantic (Beaugrand et al. 2009, Beaugrand and Reid 2003, Dupont et al. 2017, Edwards et al. 2021, Schmidt et al. 2020) and highlighted potential impacts on higher trophic levels. However, the trends here vary by taxa, which highlights the importance of estimating a total prey field rather than focusing on variability in particular zooplankton taxa or groups. In most areas, the climate-driven range shifts in C. finmarchicus and C. helgolandicus, as seen here and reported by others (e.g. Beaugrand et al. 2009), resulted in no overall trend in total Calanus energy. Instead, the trend in total zooplankton prey energy is driven by a widespread decline in small copepods and euphausiids.
Regional response to declining zooplankton energy
This study found that regional variation in ZEFF was related to regional clustering of the salmon populations.
For marine returns to the North Esk salmon population, the relationship with ZEFF was relatively clear, with some significant positive correlations found at all scales of analysis: gridded across the northern North Sea for time series and detrended time series, at migration corridor scale for annual but not during-migration averaging and not for detrended time series, and at ecosystem-integration scale for time series and detrended time series.
West population returns were positively correlated with ZEFF in some areas to the west of the UK/Ireland. This was seen gridded over the northeast Atlantic, albeit patchily due to lower CPR coverage compared with the North Sea. Positive correlations were found in some sections of the Atlantic Shelf-Edge migration corridor both during-migration and annually, and also for detrended time series. The strongest correlation in the blue-whiting spawning ecosystem integration region was at zero lag, i.e. in the post-smolt year. In the SPG-influenced region to the northwest of the UK, the strength of correlation peaked at a year lag but was similar over 0−4 years. These results could be interpreted as evidence that ZEFF during the post-smolt year had a direct effect on abundance of larval forage fish such as blue whiting, with knock-on effects on growth and survival for post-smolts during their migration. The sustained correlation with ZEFF within the SPG-influenced region may instead reflect decadally varying marine conditions that govern zooplankton assemblages and abundances. Correlations at ecosystem-integration scale did not hold for detrended time series. The steepest declines in both ZEFF in regions relevant to the west populations (SPG-influenced region, blue whiting spawning region, and ASR migration corridor) and west populations return rates were from 1980 to 2010 (Supplementary Information). Since 2010, ZEFF in these regions has increased and during this time returns to the West population grouping did not decline (Fig. 4).
No correlations were found between returns to the Channel populations and ZEFF, apart from a weak positive correlation with mean annual ZEFF in the sandeel spawning grounds ecosystem integration region. It is notable that neither returns to the Channel populations nor ZEFF in the Channel and Celtic Sea regions showed a declining trend over the period of overlap between the two time series. One explanation may be that post-smolts from the Channel rivers are not migrating into a declining food environment or are more strongly influenced by a different primary set of environmental drivers from those acting on other regional population groupings.
Drivers of changes in zooplankton prey energy
This study found evidence of regulation of zooplankton energy by both decadal variability in water masses and climate change.
ZEFF in regions west of the UK and Ireland was positively correlated with SPG strength and negatively correlated with associated changes in SST and upper ocean salinity. A link between SPG strength and zooplankton abundance in this region has been previously reported for individual zooplankton groups (C. finmarchicus and other copepods, Hátún et al. 2009), but not for zooplankton energy added up over the range of species consumed by forage fish larvae, and our result confirms the association over a longer time period. Regulation of zooplankton abundance by the SPG is analogous to the positive correlation between zooplankton biomass and proportion of Arctic water mass in the Norwegian Basin (Skagseth et al. 2022), and shows that water masses exert control over energy availability in the post-smolt food web. Climate change impacts on circulation patterns in the northeast Atlantic are projected to increase the influence of subtropical waters along the continental shelf edge (Collins et al. 2019, McCarthy et al. 2023). Under this scenario, our results suggest zooplankton energy available to forage fish would further reduce.
This study found that ZEFF increased significantly with bloom duration in the blue-whiting spawning region, suggesting a longer productive season is beneficial to grazers, and decreased with earlier phytoplankton bloom initiation in the North Sea. These associations were not seen for other regions, and there was no association between ZEFF and changes in annual total phytoplankton. It is possible that annual phytoplankton concentration does not adequately capture how changes in subarctic productivity influence zooplankton. North Atlantic phytoplankton phenology has shifted with climate change over the past 60 years (Edwards et al. 2001, 2021, Beaugrand and Reid 2003, Henson et al. 2009, Capuzzo et al. 2018, Schmidt et al. 2020). Further changes are expected under future climate change, but studies disagree on the direction of these changes (e.g. Henson et al. 2013, 2018, Kléparski et al. 2023). If bloom initiation continued to advance in the North Sea, as projected by Henson et al. (2013) but with the opposite projection by Henson et al. (2018), our results suggest zooplankton energy would continue to decline, with negative consequences for salmon post-smolts and other higher predators such as seabirds and cetaceans whose food chains are supported by zooplankton. If bloom duration were to increase, as projected by Kléparski et al. (2023) for some but not all phytoplankton groups, our results suggest a positive effect on zooplankton productivity and post-smolt survival.
Zooplankton energy as an indicator of salmon marine survival
This work provides evidence of a trophic link between zooplankton energy relevant to forage fish larvae and return rates of Atlantic salmon. It demonstrates the potential use of ZEFF as an indicator of ecosystem state and productivity, and salmon return rates for some clusters of southern European salmon populations.
One objective was to determine the scale of averaging at which ZEFF becomes a useful indicator of post-smolt growth and survival and, therefore, return rates. In general, stronger evidence for trends in ZEFF and correlation with return rates was found annually rather than during-migration. This suggests that annual integration may provide a more robust indicator of conditions relevant to post-smolt return rates than energy measured within the migration time span alone. Stronger evidence for a significant correlation was found when integrating over the ecosystem-scale regions. There are likely to be several reasons for this. Statistically, annual and larger-area pooling of the patchy CPR data provides a clearer signal through improved coverage. Mechanistically, because we are considering post-smolt prey-of-prey, rather than direct prey, it may be that an annual and wider-scale measure of zooplankton energy is a better measure of the forage fish larvae abundance that subsequently becomes available to salmon post-smolts. Because of advection, active migration, and the accumulation of energy over an annual cycle or a full life history by both long-lived zooplankton and forage fish, one would not necessarily expect correlations confined to the migration corridor itself to be as strong as ones that integrate over the food chain.
The direction of correlation between returns and ZEFF was the same at all scales of averaging, i.e. return rates were consistently positively correlated with ZEFF. This is an advantage over temperature-based indicators, for which the relationship with salmon returns has been found to be inconsistent: studies show a differential response of groups of salmon rivers to the same trends in SST (Olmos et al. 2020, Vollset et al. 2022), with both positive and negative impacts on survival (e.g. Friedland et al. 1998), which potentially vary with the time period analyzed (Wainwright 2021, Harvey et al. 2022). The thermal environment affects salmon directly via changes in metabolic rate affecting energetic requirements (e.g. Forseth et al. 2001) and indirectly via ecosystem productivity and trophic interactions (Beaugrand and Reid 2013). However, it is generally agreed that the indirect effects are likely to be predominant in the relationship between SST and marine survival (Friedland et al. 1998, Jonsson et al. 2016, Olmos et al. 2020, Harvey et al. 2022). Theoretically, ZEFF is also an indirect driver of salmon post-smolt survival, via consumption by forage fish larvae, but it has a closer trophic link than drivers based on climate indices, temperature, and primary productivity. In addition, ZEFF may be a direct driver of post-smolt survival—although forage fish larvae dominate the diet, post-smolts also consume amphipods, euphausiids, and copepods, all of which have significantly declined along the migration corridors.
As all indicators of ecosystem state have advantages and disadvantages related to how data rich, forecastable, and mechanistically understood they are (ICES 2020, Sobocinski et al. 2021), zooplankton energy would be of most use within a framework of indicators providing a measure of the status of marine conditions for salmon post-smolts. Such a framework is used operationally for salmonid post-smolts in the California Current (Peterson et al. 2014). Based on our results, e.g. a period of strong SPG would result in higher zooplankton energy and this indicator would then have a status of “good” conditions for post-smolts. A useful property of any indicator of salmon survival would be its predictability at management scales. Here, the correlation between ZEFF and return rates in the ecosystem-integration regions, the scale at which correlations were most robust, often persisted or heightened with a year or more lag. Therefore, knowledge of the prey field several years previously could be useful for short-term management. Predicting ZEFF and its consequences for salmon survival into the future is far more challenging. Water mass influence has the potential to be forecast up to 10 years into the future (Hátún et al. 2009), providing a useful predictor of zooplankton energy. Over the longer term, new regional ocean model projections under different climate forcing scenarios will provide an envelope of change in marine conditions, including circulation patterns and phytoplankton phenology, which could then provide projections of zooplankton energy and consequences for salmon post-smolts.
Study limitations
The variable coverage of the CPR data in some areas imposed several limitations on this study. The most significant was the lack of data in the Norwegian Sea. Alternative datasets for the Norwegian Sea provided a measure of total zooplankton biomass and key species but did not allow calculation of an equivalent forage fish prey energy metric (Dupont et al. 2017, Strand et al. 2020, Skagseth et al. 2022). Olmos et al. (2020) found that marine survival of southern European salmon populations was more closely correlated with conditions in the shared Norwegian Sea feeding ground than in regional averaging areas (Olmos et al. 2020). It would be useful to establish here whether more of the variation in return rates is explained by zooplankton energy in the early, regional part of the migration route or in the shared grounds, but this was not possible with the available data.
This study did not account for seasonal, interannual, and geographical variability in taxon-specific size, energy density, and catchability of zooplankton. However, the relative values for different taxa are likely to be broadly correct, suggesting that the patterns in ZEFF and relationships with salmon return rates are likely to be robust (Olin et al. 2022).
The study focused on trophic interactions and did not consider other factors that influence marine survival, such as carry-over effects from freshwater (e.g. smolt size; Gregory et al. 2019), other sources of mortality (e.g. fisheries exploitation and sea lice; Gillson et al. 2022), changes in suitable habitat (Friedland et al. 2000), competition (Utne et al. 2022), and predation pressure (Falkegård et al. 2023). Future work should consider the combined influence of these factors. Finally, note that the relationships identified in this study were correlative rather than causative, although care has been taken in the statistical analysis to build evidence of a mechanistic link.
Conclusions
We conclude that zooplankton energy is a potentially useful biotic indicator of marine return rates for at least some groupings of southern European Atlantic salmon populations, and appears to have a more consistent relationship with post-smolt survival and growth than indicators based on SST and primary production. Future work should focus on two main strands. First, in regions where zooplankton energy has not declined, what instead are the strong drivers of variability in return rates of salmon populations making use of these regions? Second, what is driving the declines in zooplankton energy, how is this likely to continue under climate change, and what does this mean for the future of salmon populations and other keystone species such as seabirds and cetaceans whose food webs are also supported by zooplankton?
Acknowledgement
We thank the following organizations for data on smolt run timing and adult return rates: AgriFood and Biosciences Institute, Northern Ireland; Cefas, UK; Environment Agency, England; The Game and Wildlife Conservation Trust; Inland Fisheries Ireland; National Research Institute for Agriculture, Food, and Environment, France; Irish Marine Institute; Marine Directorate, Scotland; Natural Resources Wales. The authors are grateful to three anonymous reviewers whose suggestions greatly improved the manuscript.
Author contributions
All authors contributed to writing and review. E.T.: methodology, formal analysis, and investigation; N.B.: conceptualization, methodology, and formal analysis; C.B.: conceptualization, methodology, and supervision; G.D.: data curation and software; D.G.: data curation; J.G. and R.K.: data curation and technical advice.
Conflict of interest
The authors have no conflict of interest to declare.
Funding
This work was supported by the UK Missing Salmon Alliance under the Likely Suspects Framework project and assisted by additional funding from the Natural Environment Research Council (NERC) EcoWind Ecosystem Change, Offshore Wind, Net Gain, and Seabirds (ECOWINGS) grant NE/X008983/1. The CPR Survey has been funded by numerous projects and grants since inception. The current funded projects relevant to this dataset include: UK NERC grant/award numbers NE/R002738/1 and NE/M007855/1; European Maritime and Fisheries Fund; Climate Linked Atlantic Sector Science, grant/award numbers NE/R015953/1; Department for Environment Food & Rural Affairs (DEFRA) UK ECM-64770; Horizon 2020: 862428 Atlantic Mission and AtlantECO862923; and Institue of Marine Research, Norway.
Data availability
The smolt emigration timing data are available from the Knowledge Network for Biocomplexity Repository at https://knb.ecoinformatics.org/view/doi:10.5063/F1HQ3XD1. The return rate data for all populations apart from the Burrishoole are available from the ICES Working Group on North Atlantic Salmon 2023 report at https://ices<plxhyp>PLXHYP</plxhyp>library.figshare.com/articles/report/Working_Group_on_North_Atlantic_Salmon_WGNAS_/22743713/1. Return rate data for the Burrishoole are available from the Irish Marine Institute Newport Research Facility 2023 Annual Report at https://oar.marine.ie/handle/10793/1891. The Continuous Plankton Recorder data are available from the Marine Biological Association at https://doi.dassh.ac.uk/data/1850 and https://doi.mba.ac.uk/data/3118.
