


Abstract
Marine fisheries are often allocated to stocks that reflect pragmatic considerations and may not represent the species’ spatial population structure, increasing the risk of mismanagement and unsustainable harvesting. Here we compile mark–recapture data collected across the North Atlantic to gain insight into the spatial population structure of Greenland halibut (Reinhardtius hippoglossoides), an issue that has been unresolved for decades. The dataset contains 168130 fish tagged from 1952 to 2021, with 5466 (3.3%) recaptured individuals. Our results indicate that fish tagged at <50 cm body length migrate at higher rates, suggesting that mark–recapture studies on adult individuals underestimate population-level migration rates. We find evidence for migrations across management units in the North Atlantic indicating two regional offshore populations: one in the Northeast Atlantic, where the West Nordic and Northeast Arctic stocks, currently managed separately, likely belong to a single population that spans from the Kara Sea to Southeast Greenland; and one in the Northwest Atlantic where migration was observed between the Newfoundland and Labrador stock and the Northwest Arctic stock in Davis Strait and Baffin Bay. Our findings indicate complex population structure with implications for international and domestic fisheries management of this long-lived species.
Introduction
A fundamental assumption in fisheries stock assessment is that the population or stock unit in question is closed, with no immigration or emigration from adjacent populations (Begg et al., 1999; Cadrin, 2020). However, fisheries management units are often based on economic zones, national boundaries, or localized fishing grounds and not on identifiable biological populations (Hutchinson, 2008; Reiss et al., 2009). This is particularly true for highly migratory species and stocks with poorly known biology, such as widely distributed deep-sea species (Roy et al., 2012; Riccioni et al., 2013). Ignoring spatial structure in assessments can lead to biases and subsequent mismanagement of fisheries (Spies et al., 2015; Kerr et al., 2016; Berger et al., 2017; Cline et al., 2017). Migration can be used as a tool to better consider the spatial structure from both management and population genetic perspectives (Faubet and Gaggiotti, 2008; Berger et al., 2017).
Greenland halibut, Reinhardtius hippoglossoides (Walbaum, 1792), is a benthopelagic deep-water marine fish with a circumpolar distribution throughout the North Atlantic and North Pacific (Hedges et al., 2017; Orlova et al., 2019; Vihtakari et al., 2021). It is a slow growing, late maturing, flatfish that can live approximately 50 years (Treble et al., 2008; Dwyer et al., 2016; Albert, 2016; Brogan et al., 2021). Due to its slow growth, regional differences in growth-rates, and considerable inaccuracy in age determination from otoliths, most studies focus on Greenland halibut length-groups instead of ages. This species has a prolonged pelagic larval phase that contributes to its ability to disperse over large areas (Sohn et al., 2010). Such life-history traits suggest the species could be vulnerable to overexploitation, especially given its commercial value, reinforcing the importance of managing at the level of biological populations. In the North Atlantic, there are important Greenland halibut fisheries in four large offshore regions: (1) Northwest Atlantic Fisheries Organization (NAFO) Subarea 2 and Divisions 3KLMNO, called “Northeast Canada” here; (2) NAFO Subareas 0 and 1 (offshore divisions), called “Northwest Arctic”; (3) International Council for the Exploitation of the Sea (ICES) areas 5, 6, 12, and 14, called “West Nordic”; and (4) ICES areas 1 and 2, called “Northeast Arctic” (Figures 1–2). The management of Greenland halibut consists of eight additional inshore regions in the Northwest Atlantic: (5) Gulf of St. Lawrence (NAFO divisions 4RST); (6) Cumberland Sound (NAFO Division 0B); and (7–12) six regions in the West Greenland fjords (NAFO divisions 1A Upernavik, 1A Uummannaq, 1A Disko Bay, 1BC Sisimiut-Maniitsoq, 1D Nuuk, and 1EF Paamiut-Qaqortoq). Each of these management units is considered a separate stock, but there is considerable uncertainty as to whether these areas correspond to biological populations. Since the 12 stocks are assessed using different assessment models, the consequences of incorrect spatial structure on the analysis will vary. However, all approaches assume a separate population, possibly leading to miscalculating critical population parameters, such as spawning stock biomass and mortality, or misestimating biological reference points.
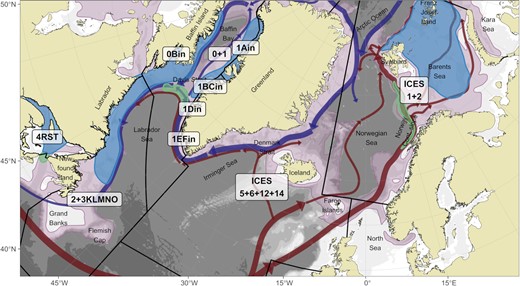
Overview of Greenland halibut stocks (labels) in North Atlantic and information mentioned in the text. Bathymetry is shown as white-grey shading on the background. Red and blue arrows indicate Atlantic and Arctic ocean currents, respectively, that potentially influence the distribution of eggs and larvae. The purple area indicates suitable habitat for Greenland halibut from Vihtakari et al. (2021). The green area represents known spawning locations, and the blue shading known juvenile grounds.
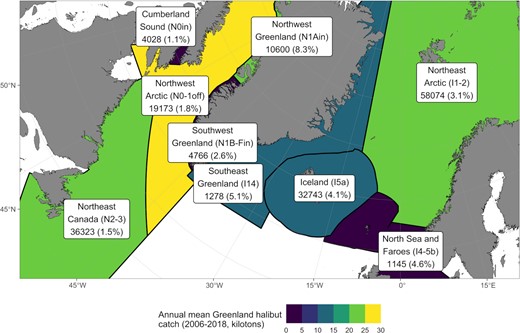
Regions used in the study, colour-coded based on mean annual catch (t) of Greenland halibut between 2006 and 2018. Numbers under the region names indicate the total number of tagged fish, with corrected recapture percentage in parenthesis. Regions have been defined based primarily on the current stock delineation: Northeast Arctic (I1-2); West Nordic comprised here of Southeast Greenland (I14), Iceland (I5a), North Sea, and Faroe Islands (I4 and 5b), I6 removed due to missing data; Northwest Arctic (N0-1offshore); Northeast Canada (N2-3); and the inshore stocks in Northwest (N1Ain) and Southwest (N1B-Fin) Greenland and Cumberland Sound (N0in).
In the Northwest Atlantic, nursery grounds have been reported in the Gulf of St. Lawrence and on the West Greenland shelf (Jensen, 1935; Smidt, 1969; Simonsen and Gundersen, 2005), and juveniles are widespread on the Newfoundland and Labrador Shelves (Junquera and Zamarro, 1992; Wheeland and Morgan, 2020, Figure 1). Scientific surveys that typically fish during fall between 100 and 1500 m from Newfoundland’s Grand Banks to Baffin Bay, and through inshore coastal fjords, rarely encounter spawning Greenland halibut (Morgan and Bowering, 1997). Individuals in spawning condition are also rarely observed around Greenland (Simonsen and Gundersen, 2005). However, a spawning ground is presumed to be located across the Davis Strait (Northern Labrador Sea), at the shallow water ridge between Baffin Island and Greenland (South of 67° N). This is based on observations of eggs and larvae dispersal in 1908–1928 (Jensen, 1935; Smidt, 1969) and more recently in 2002 (Stenberg et al., 2016), on the abundance of 1-year old fish on the West Greenland shelf (Jensen, 1935; Jørgensen, 2013), and on the presumed pre-spawning movement of fish to these deep-water slopes (Bowering, 1984; Jørgensen, 1997). In the Northeast Atlantic, a major spawning ground is situated along the continental slope from mainland Norway to Svalbard (Godø and Haug, 1989; Albert et al., 2001a). The nursery grounds are found downstream (north) from the spawning grounds, in shelf areas north and east of the Svalbard archipelago (Albert et al., 2001b). These grounds also extend eastwards to Franz Josef Land, and possibly beyond (Ådlandsvik et al., 2004; Orlova et al., 2019; Benzik et al., 2022). For the West Nordic stock, observations of ripe and ripening females, and bathypelagic eggs strongly suggest the occurrence of another spawning ground along the continental slope at approximately 1000 m depth, Southwest of Iceland, between 63.5 and 65.5° N (Magnusson, 1977; Sigurdsson, 1977, 1979). Sigurdsson (1980) supplemented this with observations of one year old fish in Northern Icelandic fjords, consistent with eggs and larvae drifting northward from the expected spawning grounds.
Genetic tools have been used to investigate Greenland halibut population structure. The available data support a separation of the Pacific populations from the North Atlantic (Fairbairn, 1981; Orlova et al., 2019), while the situation is less clear within the North Atlantic. Knutsen et al. (2007) and Westgaard et al. (2017) found weak but significant structure indicating two populations, one in the Northeast and one in the Northwest Atlantic. In the Northeast Atlantic, Wojtasik et al. (2021) reported the possibility of two discrete populations mixing on fishing grounds in the West Barents Sea. Orlova et al. (2019) found Greenland halibut from Laptev Sea stemming from the Northeast Arctic spawning ground. In the Northwest Atlantic, Riget et al. (1992) concluded that at least two populations existed based on samples from Greenland and Newfoundland. Roy et al. (2014) and Vis et al. (1997) found limited differentiation in the Northwest Atlantic indicating a common gene pool, with the former suggesting that local adaptation was a possible explanation for observed differences in population characteristics among regions. Carrier et al. (2020) found clear genetic differences between samples collected in the Gulf of St. Lawrence and offshore Newfoundland but also documented mixing, with the presence of fish from the offshore population on the juvenile grounds in the Gulf of St. Lawrence. The different patterns reported from genetic studies, however, rely on low sample sizes and the different types of markers used can reach different conclusions (Waples et al., 2008). Thus, whether or not these studies reflect isolated populations remains uncertain. Other tools such as meristics, parasite burden, and growth patterns have also been used to study population structure of Greenland halibut in the Northwest Atlantic (Templeman, 1970; Khan et al., 1982; Misra and Bowering, 1984; Riget et al., 1992; Arthur and Albert, 1993; Boje, 1997). A comparative study found broadly similar growth between the Northwest and Northeast Atlantic (Bowering and Nedreaas, 2001). In common, these studies suggest a separate population in the Gulf of St. Lawrence, but the separation is less clear within offshore areas.
Tagging studies can be used to improve our understanding of fish population distribution and dynamics (Crossin et al., 2017). The first Greenland halibut tagging studies used external disc (Smidt, 1969; Bowering, 1984) or t-bar tags (Boje, 2002) and were focused in areas of the Northwest Atlantic. Smidt (1969) was the first to observe a recapture in the Denmark Strait (between Southeast Greenland and Iceland) that was initially released in Southwest Greenland (Figure 1). Subsequently, Riget and Boje (1989) and Boje (2002) obtained additional tag records indicating movements between Southwest Greenland fjords and the Denmark Strait. These observations in addition to larval and young fish distribution data (Smidt, 1969; Riget and Boje, 1988) support an Icelandic origin of some Greenland halibut in Southwest Greenland fjords. High site fidelity in Northwest Greenland fjords with some movement between fjords was reported by Boje (2002), with no evidence of offshore migration to Baffin Bay or Davis Strait. Presence of long-distance migrations (thousands of kilometres) South- and Westward for some fish tagged in the offshore waters of Baffin Bay and Davis Strait and in Southwest Greenland fjords, was also reported by Boje (2002). Bowering (1984) found that most fish tagged along the Newfoundland and Labrador coast were recaptured close to the release point, but that several fish undertook longer migrations north toward the Davis Strait. These data provided the first indications that Greenland halibut may have complex migration strategies and large-scale connectivity among regions and established management units. A large tagging study in nursery areas of the Northeast Arctic in Svalbard waters showed that juveniles from these areas recruited to the fishable stocks of both management units in the Northeast Atlantic (Albert and Vollen, 2015). After six years, more than 60% of the reported recaptures were from areas of the West Nordic stock (around Iceland and Faroe Islands). The authors noted that no recaptures were recorded from the Greenland shelf South of Iceland, and suggested that the area between Iceland and Greenland represents a stock boundary for Greenland halibut.
Some studies have used archival data storage tags and acoustic telemetry to understand Greenland halibut habitat use and migratory behaviour. Boje et al. (2014) found Greenland halibut occupied warmer, shallow water in Disko Bay in summer, but migrated into Ilulissat Ice fjord, to cooler, deeper water in winter. Similarly, Siwicke and Coutré (2020), using archival tags, noted a pattern of annual movement between shallow water in summer and deeper water in winter for Greenland halibut in the Northern Pacific Bering Sea and Aleutian Islands. In contrast, movements of Greenland halibut within Cumberland Sound (Baffin Island), using acoustic telemetry, reported fish occupied the deep central portion of the sound in summer, moving to shallow water in the northern section in winter (Peklova et al., 2012; Hussey et al., 2017). Within Scott Inlet fjord, on the north coast of Baffin Island, Barkley et al. (2018) identified two groups of fish exhibiting intermittent resident or transitory behaviours using acoustic tags. Transitory individuals exited the inshore and moved offshore for periods of months, demonstrated by recaptures in commercial offshore fisheries.
Given the incomplete, often conflicting, understanding of apparently complex Greenland halibut population structure and connectivity in the Arctic and North Atlantic, and the need to more accurately define management units for effective stock assessment, we compile previously published and unpublished Greenland halibut mark–recapture data for the entire North Atlantic conducted over a 70 years period (1952–2021). These combined regional studies provide the first North Atlantic-wide perspective on Greenland halibut movements, in an effort to address questions about spatial population structure, migration, connectivity, and the relevance of current management units in the context of fisheries management boundaries and transboundary dispersal. The dispersal estimates are used to gauge the relative importance of migration from one region to another and should not be understood as realistic estimates of the absolute level of mixing and migration due to biases and assumptions related to these estimates.
Material and methods
Regional tagging programmes
Data from mark–recapture programmes targeting Greenland halibut were compiled from six research institutes from 1952 to 2021 (Table 1). The programmes used longline, bottom trawl, and even gillnets to capture Greenland halibut for tagging (Smidt, 1969; Nizovtsev, 1970; Sigurdsson, 1979; Bowering, 1984; Boje, 2002; Dennard et al., 2010; Steingrund, 2013; Albert and Vollen, 2015; Barkley et al., 2018). Greenland halibut do not have a swim bladder making it possible to successfully capture, tag, and release this species despite capture depth (Simonsen and Treble, 2003). All mark–recapture programmes attempted to minimize harm and improve the survival of tagged fish. Trawl times were typically 15–20 min, and haul-back speed was minimized. Only fish in good physical condition were tagged. No anesthetics were used to avoid an extended recovery time that could negatively affect fish health. Also, fish were often not weighed to minimize handling. In order to assess fish condition prior to release, individuals were sometimes held in tanks with flowing seawater. Otherwise fish were released back into the water immediately after tagging and as close to the surface as possible, directly or with the aid of a slide or chute. Two tagging programmes conducted in the Canadian Arctic (1999–2001, 2012) took place during late winter on the sea ice and required extra care to protect fish from freezing (Simonsen and Treble, 2003; Hussey et al.2017; methods in Dennard et al., 2010).
Tagging programmes that provided data for use in this study.
| Source | Years | Area | Depth (m) | Gear | Tag type | Number tagged | Size range (cm) (mean, SD) | References |
|---|---|---|---|---|---|---|---|---|
| Greenland | 1952–1979 | West Greenland fjords from Cape Farewell to Uummannaq | 400–900 | Longline | Petersen disc | 3 256 | 27–106 (74, 11.1) TL (from 432 recaptured fish) | Smidt (1969) |
| Boje (2002) | ||||||||
| 1986–1998 | Northwest fjords and offshore (1991–1993) | 400–900 inshore | Longline | T-bar anchor | 7 244 | 26–110 TL | Boje (2002) | |
| ∼900 offshore | ||||||||
| 2005–2021 | Northwest fjords and offshore (2007–2010) | 400–900 inshore | Longline, some gillnets used inshore | T-bar anchor | 19 186 | 12–105 (47, 9.8) TL | Unpublished | |
| ∼900 offshore | Alfredo bottom trawl with aquarium in offshore | |||||||
| Norway | 1995–2008 | Continental slope along Norway | 300–1 000 | Longline | T-bar anchor | 33 779 | 32–97 TL | Unpublished |
| Some Alfredo bottom trawl | ||||||||
| 2005–2008 | Barents Sea nursery areas north and east of Svalbard | 300–1 000 | Alfredo bottom trawl with aquarium | T-bar anchor | 25 149 | 10–47 TL | Albert and Vollen (2015) | |
| Unpublished | ||||||||
| Iceland | 1971–1978 | Iceland | 200–700 | Longline and trawl | T-bar anchor | 25 302 | 18–108 (66, 10.0) | Sigurdsson (1979) |
| 2000–2020 | Iceland | 250–900 | Longline and trawl | T-bar anchor | 3 056 | 22–100 (58, 8.2) | Unpublished | |
| USSR | 1967–1969 | Iceland | 5 045 | 50–84 (69, 8.0) | Nizovtsev (1970) | |||
| Faroe Islands | 2002, 2004, 2011 | Around Faroes | 450–650 | Gillnet | T-bar anchor | 412 | 48–84 (65, 6.1) | Steingrund (2013) |
| Canada Newfoundland | 1969–1980 | Inshore and nearshore areas of Newfoundland and Labrador | 300–500 | Longline (inshore) Bottom trawl (inshore and offshore) | Petersen disc | 24 390 | 35–97 (54, 10.6) FL (from 348 recaptured fish) | Bowering (1984) |
| 2012–2015 | Coastal and nearshore Newfoundland and Labrador (Div. 3KL) | 600–1 700 | Campelen bottom trawl with cod end aquarium | T-bar anchor | 11 603 | 22–88 (44, 6.5) FL | Unpublished | |
| Canada Arctic | 1994 | Southeast Baffin coast (Div. 0B), incl. Cumberland Sound | 550–950 | Bottom trawl | T-bar anchor | 500 | 15–98 (50, 9.0) TL | Treble (2003) |
| 1997–2001 | Cumberland Sound-winter | 800–900 | Longline | T-bar anchor | 1 687 | 37–100 (58, 7.2) FL | Treble (2003) Simonsen and Treble (2003) | |
| 2007, 2009 | Baffin Bay and Davis Strait (offshore Div. 0A and 0B) | 800–1 100 | Alfredo bottom trawl with cod end aquarium | T-bar anchor | 3 768 | 29–102 (47.5, 6.8) FL | Unpublished | |
| 2010–2021 | Baffin Bay and Davis Strait (offshore and inshore areas in Div. 0A and 0B) incl. Cumberland Sound in winter 2012 | 200–900 inshore 800–1 000 offshore | Longline with Yankee bottom trawl used in some shallow inshore areas | T-bar anchor, some with only an internal acoustic tag | 6 413 | 16–118 (58, 15.7) FL | Dennard et al. (2010) Hussey et al. (2017) Barkley et al. (2018) Unpublished |
Average size and standard deviation are given in brackets after the size range (TL = total length; FL = fork length).
In the early years, some programmes noted that fish were in better condition when caught using longline compared to bottom trawl (Sigurdsson, 1979; Bowering, 1984). In the mid-2000s, during their tagging programme on the nursery area north and east of Svalbard, Norway used an aluminum aquarium box attached to the cod end of the trawl to protect the fish during hauling (Albert and Vollen, 2015). The design was based on Holst and McDonald (2000) who used a “fish-lift” to protect Atlantic Salmon post-smolts. Greenland modified the Norwegian design for use in their offshore tagging programme beginning in 2007, and a cod-end aquarium has also been used in the Canada–Arctic (2007 and 2009) and –Newfoundland (2012–2015) tagging programmes (see Supplementary Text 1). The 2012 Canada–Newfoundland programme used a bath of VIDALIFETM solution (Snydel, 1 ml per 15 l of seawater) in holding pens both pre- and post-tag implantation to protect the scales and mucosal layer of Greenland halibut from damage during subsequent handling (Domínguez-Petit et al., 2013).
Most programmes used a DenisonTM tagging pistol to apply a coloured t-bar anchor tag (e.g. FloyTM, FD-94, 3/4 in mono, long-T) into the musculature below the dorsal fin, just posterior of the head on the eyed side. However, two of the earliest programmes applied Petersen discs: Greenland, 1952–1964 (fixed to the gill cover on the eyed side) (Smidt, 1969); and Canada–Newfoundland, 1969–1980 (attached through the muscle below the dorsal fin) (Bowering, 1984). More recent work in the Canadian Arctic has surgically inserted long-term acoustic tags (3–10 years) into Greenland halibut, ~70% of these acoustically tagged fish were also marked with a t-bar tag (Hussey et al., 2017; Barkley et al., 2018).
The sizes of fish tagged were typically >30 cm but varied among programmes, depending on the gear used, and area or depths fished. Most institutes measured total length while some measured fork length. However, for Greenland halibut, the difference between these two length measurements is minimal (up to ~1 cm) and is not considered to influence our analysis below. Overall sizes ranged from 10 to 118 cm (Table 1). Each institute offered monetary rewards for the return of tags and information on the recapture (e.g. location, date of recapture, size at recapture, sex). In each region, the tagging programme and rewards were advertised among Greenland halibut fish harvesters, fishing companies, and processing plants.
Regions and catch data
The North Atlantic was divided into nine study regions following the existing ICES and NAFO stock management structure, with some modifications (Figure 2). Northeast Canada (N2-3) corresponds to the NAFO stock in Subarea 2 and divisions 3KLMNO. Cumberland Sound (N0in), Northwest (N1Ain), and Southwest Greenland (N1B-Fin) inshore areas are managed separately from the Northwest Arctic offshore stock (N0-1off). Given fish tagged in coastal areas along Baffin Island have been shown to have connectivity with the offshore (Barkley et al., 2018), they were included in the Northwest Arctic offshore region (N0-1off). The 200 nautical mile Exclusive Economic Zones were used to demarcate areas around Southeast Greenland (I14), Iceland (I5a), and Faroe Islands (I5b) instead of the boundaries specified by ICES because catches are reported to the economic zones. The Faroes were then combined with the northern North Sea to form a single region (I4-5b). The Northeast Arctic region (I1-2) corresponds to ICES management areas 1 and 2.
We assumed that the annual average commercial catches between 2006 and 2018 could be used as a proxy of the relative population size within regions. It should be noted that adherence to regional management restrictions (total allowable catches) and biological advice on catch opportunities differs among regions and may lead to biased conclusions, as discussed later. Catch data combined for all gear types were acquired from the following sources: (1) ICES Official Nominal Catches (ICES, 2021b), (2) NAFO Scientific Council Standing Committee on Fisheries Science (STACFIS) catches for Subareas 0 and 1 (Treble and Nogueira, 2020), and (3) STACFIS catches for NAFO Subarea 2 and divisions 3 KLMNO.
Effect of migration on the regions
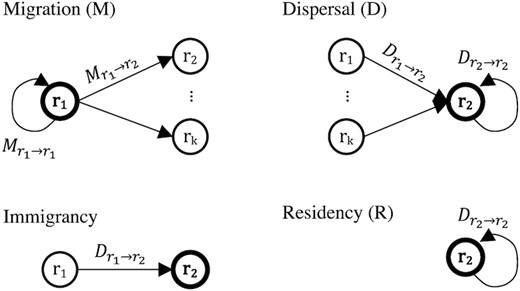
Migration related concepts and terminology. Regions are denoted using the letter r in circles. The focal region is expressed using a thick line and bold font. See the “Effect of migration on the regions” section in Methods for formula and written explanation.
The dispersal proportion consisting of fish that moved between regions (|$D_{r_n\rightarrow r_2}$|) is called immigrancy, even though it is unknown whether the fish permanently or temporarily moved to that area. Immigrancy (I) can also be understood as the probability of fish originating from a different region. Residency (R) describes the dispersal proportion that moved within a region (|$D_{r_2\rightarrow r_2}$|) and can be understood as the probability of fish remaining within a region.
Our approach to estimate dispersal among regions introduced a range of assumptions. The main assumptions were as follows: (i) The regions across the North Atlantic are considered a closed stationary system from 1952 until 2021, given annual average catch as a proxy for population size and mark–recapture data were summed over all years; (ii) Fishing and natural mortality are similar among regions, gear types, and across years, based on the fact that we consider population size within a region proportional to reported average annual catches between 2006 and 2018; (iii) Recaptured fish represent movements of all Greenland halibut among regions, since only fish with a recapture position were considered in dispersal estimates; (iv) Uniform reporting of recaptures, tag shedding, and post-tagging survival rate. Dispersal occurs to the region where the fish was recaptured, even though the fish could have been in multiple regions prior to being caught; (v) Population structure, with regard to the determined size classes, is identical among regions; and finally, (vi) Fish tagged with only an internal acoustic tag had the same reporting probability as those with an external floy tag, accepting the acoustic tag can be lost with the guts during automated processing.
These assumptions likely do not hold under real world conditions, therefore, the estimated dispersal proportions should not be interpreted as realistic estimates of the absolute level of mixing and migration. However, the model is still considered useful to gauge the relative importance of migration from one region to another (see “Discussion”).
Uncertainty in migration and dispersion estimates were estimated using a modified bootstrap approach, treating releases from the same location within a year as the sampling unit for the resampling using 1000 repetitions [as suggested by Hannesson et al. (2008); see supplementary information for reproducible code].
Data handling and statistics
Total number of tagged fish was calculated based on the entire dataset. However, in the event of missing location and/or length information at time of release for Greenlandic data before 2005 and Northeast Canada from 1969 to 1980, it was not possible to assign 2193 released fish to a tagging region or size category. Further, fish tagged after 2019 were removed from recapture rate calculations because the probability of recapture was likely low at the time of data analysis. Therefore, a simple ratio between the number of recaptured and released fish does not always correspond with the corrected recapture rates (%) reported in the text, tables, and figures.
Fish lengths used are those reported at the time of release unless specified otherwise. Fish size was allocated to two length classes: “small” with length ≤50 cm, and “large” with length >50 cm roughly based on the maturation of Greenland halibut (L50 is around 40–45 cm for males and 55–70 cm for females, e.g. Núñez et al., 2015). Fish were included in the number and recapture rate calculations if they had a recapture year or date. However, for the analysis of migration, a recapture location was required. Migration distance was calculated as the straight line distance between decimal degree coordinates of release and recapture considering the Earth’s curvature, representing the minimum distance traveled.
The terms proportion (p) and rate (%) are used interchangeably in describing results. All models were run using proportions. Binary migration (migrated/resided) and continuous straight line migration distance data were included as response variables in statistical models. We used fish length at tagging and recapture (continuous), region (discrete), year (continuous), decade (discrete), time at liberty (continuous), and sex (discrete) as predictor variables. Sex was identified for 40% of recaptures. The relative importance of binary and continuous categorical predictor variables for explaining variation in binary migration, and continuous migration distance, were compared using generalized linear models (GLMs, the glm function in R) and linear models (the lm function in R), respectively. McFadden’s pseudo R2 (1—model deviance / null model deviance, McFadden, 1974) was used as a proxy of R2 for GLMs and R2 values for LMs to compare the relative importance of each predictor variable. The pseudo and real R2 values are not comparable across response variables, but can be used to rank predictors explaining variance within a model. All models were formulated as a response against a single predictor variable (response ~ predictor using R formula).
After eliminating non influential predictor variables on results, we used the selected variables in general additive models (GAMs) presented in figures [Binary migration ~ s(tagging/recapture length); migration distance ~ s(tagging/recapture length)]. For GAMs examining the migration proportion, we used a binomial family with a logit link function.
All statistics, figures, and data-handling were conducted using R (R Core Team, 2022) and the tidyverse collection of R packages (Wickham et al., 2019, see SI Text 3). Figures were primarily made with the ggplot2 package (Wickham, 2009), chord diagrams using the circlize package (Gu et al., 2014). The mgcViz package (Fasiolo et al., 2018) was used to illustrate GAM results (see Supplementary Figure S2). Confidence intervals (CIs) for GAMs were calculated from model standard errors assuming normal distribution (1.96 × SE). Maps were made using the ggOceanMaps package (Vihtakari, 2021) with 1:10 m land polygons from Natural Earth Data and bathymetry from Amante and Eakins (2009).
Results
Recaptures
Of 168130 tagged Greenland halibut, 5466 (3.3 %) were recaptured, and 388 (7.3%) of these migrated from their tagging region to another one (Table 2). Note that the recapture rates have been corrected for fish with missing release data (see the Data handling section in methods). Number of tagged fish per region varied between 1145 and 58074, with Northeast Arctic (I1-2) containing the most tagged fish, followed by Northeast Canada (N2-3), Iceland (I5a), and Northwest Arctic (N0-1off, Figure 2). Recapture percentage was on average 3.6 and varied between 1.1 and 8.3, being highest in Northwest Greenland (N1Ain, Table 2). Minimum length of a recaptured fish at the time of tagging was 15 cm, and maximum length 106 cm. Average and median time at liberty was 2.1 and 1.3 years, respectively, with a range between 1 d and 17 years. Tagging and recapture lengths as well as time at liberty varied considerably among regions.
Overview of data allocated to the regions.
| Region | Years | Source | N years | Ntot | Rec | M | d | Lt | Lr | T |
|---|---|---|---|---|---|---|---|---|---|---|
| Northeast | 1995–2008 | Nor | 11 | 58 074 | 3.1 | 8.7 | 312 | 46 | 59.1 | 2.2 |
| Arctic (I1-2) | (7.3–10.1) | (288–336) | (10–97) | (22–97) | (0–17) | |||||
| North Sea and | 2002–2011 | Far, Nor | 4 | 1 145 | 4.6 | 24.2 | 283 | 57.4 | 62.6 | 1.5 |
| Faroes (I4-5b) | (17.3–38.5) | (165–401) | (33–88) | (54–79) | (0–11.8) | |||||
| Iceland (I5a) | 1967–2020 | Ice, USSR | 17 | 32 743 | 4.1 | 8.6 | 274 | 65.7 | 70.3 | 2.6 |
| (7.6–9.6) | (259–289) | (18–108) | (44–96) | (0–16.8) | ||||||
| Southeast | 1988–2020 | Grl | 5 | 1 278 | 5.1 | 30.4 | 174 | 64.8 | 55 | 2 |
| Greenland (I14) | (25–36.1) | (72–276) | (38–105) | (46–71) | (0.1–7.2) | |||||
| Northwest | 1970–2021 | CanA, Grl | 20 | 19 173 | 1.8 | 13.8 | 307 | 47.9 | 51.9 | 1.5 |
| Arctic (N0-1off) | (11.9–15.9) | (258–356) | (12–118) | (38–88) | (0–9) | |||||
| Cumberland | 1994–2019 | CanA | 14 | 4 028 | 1.1 | 23.1 | 216 | 62.4 | 67.3 | 2.7 |
| Sound (N0in) | (18–29.1) | (92–340) | (15–100) | (47–92) | (0–13.8) | |||||
| Northwest | 1960–2020 | Grl | 29 | 10 600 | 8.3 | 1.4 | 38 | 51.4 | 61 | 1.5 |
| Greenland (N1Ain) | (1.1–1.8) | (31–45) | (20–95) | (30–100) | (0–8.9) | |||||
| Southwest | 1952–2021 | Grl | 20 | 4 766 | 2.6 | 2.5 | 48 | 44.1 | 76.8 | 2.2 |
| Greenland (N1B-Fin) | (1.6–3.6) | (31–65) | (20–106) | (27–113) | (0–16) | |||||
| Northeast | 1969–2019 | CanA, CanN | 10 | 36 323 | 1.5 | 4.5 | 183 | 44.9 | 52.7 | 1.8 |
| Canada (N2-3) | (3.4–6.3) | (155–211) | (22–108) | (27–89) | (0–8.8) |
Columns from the left: tagging region, range of years with tagging, source of tagging information, number of years with tagging, total number of tagged fish (Ntot), corrected recapture percentage (Rec), bootstrapped percentage of recaptured fish that migrated to another region (M) with 95% CIs, average straight line distance between the tagging and recapture positions with CIs (d, km), average length at tagging, and recapture (Lt and Lr, cm) as well as average time at liberty (T, years) with minimum and maximum values. Abbreviations for sources: Nor = Norway, Far = Faroe Islands, Ice = Iceland, USSR = Soviet Union, Grl = Greenland, CanA = Canada–Arctic, and CanN = Canada–Newfoundland.
Migration related to tagging length and time at liberty
Migration rate was highest (>50%) for Greenland halibut that were 30 cm in length at the time of tagging and formed a dome-shape between 10 and 50 cm (Figure 4a). Large fish (>50 cm) had migration rates <10%. This result was, however, driven by the Northeast Arctic region (I1-2), where most of the small fish (<50 cm) were tagged (I1-2, see Supplementary Figure S1). Migration rates based on length at time of recapture formed a generally similar pattern, yet, the peak migration rate was lower at approximately 20% and the modal length was 40 cm (Figure 4c). Migration rate was approximately 5% for fish 60–75 cm, and gradually lower for fish >75 cm.
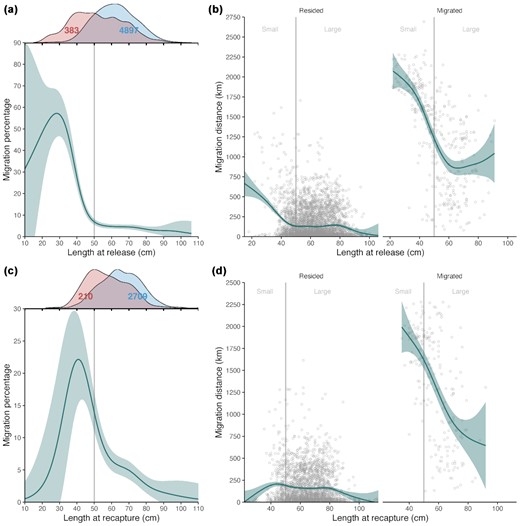
Migration by length at release (a–b) and recapture (c–d). (a) and (c) binomial general additive models (GAM) using migration proportion as a response. Marginal distributions on top indicate relative distributions of migrating (red) and residing fish (blue). Numbers on the distributions indicate the number of observations for each case. (b) and (d) GAMs using straight line migration distances for individuals that resided (left) and migrated (right) as responses. Size classes of fish are shown on the background with grey vertical lines and individual fish as small circles. Shading for the blue line indicates 95% CIs for the GAMs.
Time at liberty correlated weakly with tagging length (ρ = -0.06, see Supplementary Figure S2) and only moderately explained variation in migration rate (Table 3). However, the relationship between length at tagging and migration probability was weak for fish <3 years at liberty indicating that (i) there was a lag between tagging and recapture of these fish in another region, and (ii) that these fish could have undertaken migrations at a larger size than the reported tagging length (see Supplementary Figure S2). This result was also reported by Albert and Vollen (2015). Sex of fish did not explain migration and had almost zero (pseudo) R2 value in the models (Table 3). The longest recorded straight line distance between release and recapture position (called “migration distance”) was 2693 km and the average migration distance for individuals that moved from one region to another was 1288 km. Fish <40 cm at tagging conducted the longest migrations (1874 km on average), while average migration distances were similar for fish >60 cm at tagging (879 km, Figure 4b). Time at liberty was positively correlated with migration distance (Pearson correlation = 0.33) but the relationship applied only for fish <50 cm (see Supplementary Figure S3).
Relative importance of predictor variables in explaining the variability in binomial migration (migrated/resided) general linear models and continuous straight line migration distance linear models.
| Response | Predictor | Type | Levels | N | R2 |
|---|---|---|---|---|---|
| Binomial | Release length | Cont. | 5 280 | 0.08 | |
| Time at liberty | Cont. | 5 273 | 0.06 | ||
| Size class | Disc. | 2 | 5 280 | 0.06 | |
| Region | Disc. | 9 | 5 332 | 0.06 | |
| Recapture length | Cont. | 2 919 | 0.05 | ||
| Decade | Disc. | 8 | 5 332 | 0.02 | |
| Year | Cont. | 5 332 | 0.01 | ||
| Sex | Disc. | 2 | 2 178 | <0.01 | |
| Continuous | Migrant/resident | Disc. | 2 | 5 332 | 0.61 |
| Time at liberty | Cont. | 5 273 | 0.11 | ||
| Release length | Cont. | 5 280 | 0.08 | ||
| Region | Disc. | 9 | 5 332 | 0.08 | |
| Size class | Disc. | 2 | 5 280 | 0.08 | |
| Recapture length | Cont. | 2 919 | 0.05 | ||
| Decade | Disc. | 8 | 5 332 | 0.04 | |
| Year | Cont. | 5 332 | 0.01 | ||
| Sex | Disc. | 2 | 2 178 | <0.01 |
Predictor variables used in each model: tagging and recapture length, size class at tagging (smaller or larger than 50 cm), tagging region, time at liberty, tagging decade (discrete), tagging year (continuous), and sex. Type of the response variable (continuous/discrete) is indicated in the Type column, number of levels for discrete variables in the Levels column, and number of observations in the N column. The R2 value is calculated as McFadden’s pseudo r-squared for the GLMs.
Migration related to regions
Migration rate varied between 1.4 and 30.3% among regions (Figure 5). The largest proportion of individuals migrated from Southeast Greenland (I14), followed by North Sea and Faroes (I4-5b), Cumberland Sound (N0in) and Northwest Arctic (N0-1off). In the Northeast Arctic, juveniles (<40 cm) tagged around Svalbard (I1-2) demonstrated higher migration rates (62.8%) than the average values for the region (8.6%). Large fish (>50 cm at tagging) from the Northeast Arctic did not migrate, lowering the overall migration percentage for that region (Figure 5). Migration rates from West Greenland inshore regions were particularly low (1.4% for N1Ain and 2.4% for N1B-Fin).
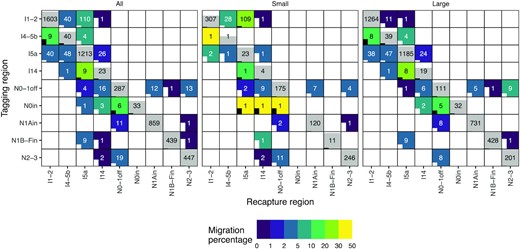
Connectivity matrices showing recaptures and migration for all, small (≤50 cm), and large (>50 cm at tagging) fish. Y- and X-axes indicate the tagging and recapture regions, respectively. Regions are ordered from east to west, and the abbreviations are explained in Figure 2. Numbers in cells represent the number of recaptured fish and the coloured fill in non-diagonal cells migration percentage. The grey fill in diagonal cells indicates the percentage of fish recaptured in the same region as they were tagged. If the entire cell is grey, the percentage is 100. A half-filled cell would indicate 50% residing fish. The bars inside cells indicate coefficient of variation (CV) for the bootstrapped migration estimates. If a bar reaches the cell above, CV = 1. If a bar is missing, CV = 0. The bars and text are coloured white or black to enhance readability.
Seventy five percent of recaptures occurred within 261 km of the tagging site (see Supplementary Figure S4). Most of the 388 recaptured fish that migrated were small in size, tagged around Svalbard in the Northeast Arctic and moved to Iceland (110 fish, Figure 5, see Supplementary Figures S4 and S5). The remainder migrated from the Northeast Arctic to the North Sea and Faroes (40 fish) and Southeast Greenland (1 fish). Large fish tagged in Iceland moved to the North Sea and Faroes (48 fish) and Southeast Greenland (26 fish) with some individuals moving to the Northeast Arctic (40 fish). A total of 33 fish were recaptured off Southeast Greenland; 9 of them migrated to Iceland, 1 to North Sea and Faroes, and the rest were resident. No fish tagged in Southeast Greenland were captured further West.
Within the Western Atlantic, the Northwest Arctic offshore region supplied fish to Southeast Greenland (16 fish), Northeast Canada (13 fish), West Greenland inshore regions (N1Ain and N1B-Fin, 13 fish), and to Iceland (4 fish). Northwest Greenland inshore regions had the lowest migration rates and fish were recaptured in the adjacent Northwest Arctic offshore region (11 fish) and Northeast Canada (1 fish). Fish from Cumberland Sound migrated to the adjacent offshore area (N0-1off, 6 fish), and as far as Southeast Greenland (3 fish) and Iceland (1 fish). The Southwest Greenland inshore region demonstrated similar long migration patterns with 9 fish migrating to Iceland, 1 to Southeast Greenland, 1 to Northeast Canada, and none to the adjacent Northwest Arctic offshore region. Finally, fish from Northeast Canada migrated to Northwest Arctic (19 fish) and Southeast Greenland (2 fish).
Dispersal
Immigrancy was more prominent on the east side of the Atlantic (mean = 5.3%) than the west (mean = 2.8%, Figure 6a). Dispersal to the Northeast Arctic (I1-2) was lower (4%) than dispersal out of this region (22%). The Northeast Arctic (I1-2) provided small fish (<50 cm at tagging) to North Sea and Faroes (I4-5b), and Iceland (I5a) contributing 28% of small and 8% of all Greenland halibut to Iceland (I5a, 6b). North Sea and Faroes, as well as Iceland, received a considerable proportion (11 and 20%, respectively) of fish (small to I4-5b, both size classes to I5a) from Southeast Greenland (I14). Southeast Greenland, on the other hand, received most of its migrants (13%) from the Northwest Arctic (N0-1off). These fish consisted of all size classes. In the Western Atlantic, dispersal consisted mostly of large fish migrating from Northwest Arctic (N0-1off) to Southwest Greenland (N1B-Fin), and to a lesser extent to Northwest Greenland (N1Ain) as well as between Northwest Arctic and Northeast Canada (N2-3). There was low dispersal (4 %) from Northwest Greenland to the Northwest Arctic offshore region.
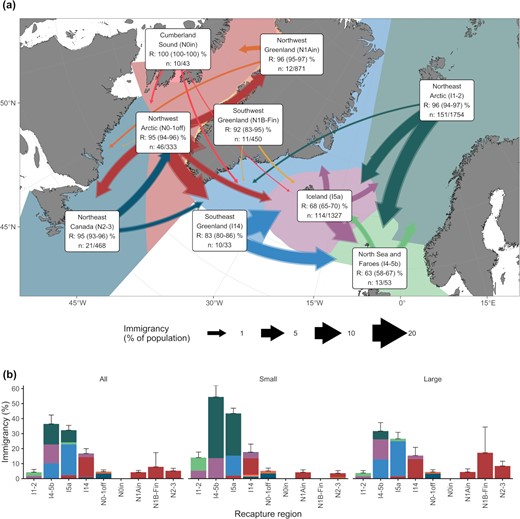
Immigrancy percentage from tagging to recapture regions. (a) Map for all data. The widths of the arrows are scaled to the immigrancy percentage and the colour to the tagging region. Transparent and solid arrows indicate the upper and lower 95% bootstrapped CIs, respectively. Residency percentage (R) together with CIs and the number of migrated/recaptured fish are given together with region labels. (b) Bar graph showing all data (the same as a), small (≤50 cm), and large (>50 cm at tagging) fish. Error bars indicate the upper CIs for the total immigrancy estimate. Colours indicate tagging regions and are the same as in (a). The arrows and bars exclude the resident portion of the total dispersal value.
Discussion
Our results showed that while the majority of fish may have resided within the tagging area, some Greenland halibut undertook large-scale migrations across management units in the North Atlantic. Movement rates varied, but appeared to separate the Northeast and Northwest Atlantic with no clear migratory boundary or barrier in between.
Northeast Atlantic
A reanalysis of the updated dataset from Albert and Vollen (2015) confirms that approximately one third of small fish (<50 cm) tagged in the Northeast Arctic spawning region, located along the continental slope of the Barents Sea, migrated to Icelandic waters. This observation implies that the West Nordic stock and the Northeast Arctic stock could share a common origin, a hypothesis partly supported by Westgaard et al. (2017). Despite the large influence of the Northeast Arctic stock, our data also show the potential for migration of Greenland halibut from the Northwest Arctic to the West Nordic stock. The source of juveniles found in the West Nordic stock area has been a matter of contention in the literature for decades (see the discussion in Albert and Vollen, 2015). Egg and larval drift from the assumed spawning area west of Iceland suggest nursery grounds in either Southeast Greenland or as far as Southwest Greenland banks (Smidt, 1969). However, these nursery grounds have never been located, apart from small areas in the mouth of fjords in Southeast Greenland (Gundersen et al., 2013). Most recruits to the West Nordic stock could originate from the Northeast and Northwest Arctic stocks explaining the lack of nursery grounds with occasional spawning events west of Iceland explaining the rare observations of larvae. Consequently, the region around Southeast Greenland and Iceland could function as a mixing zone for two or more populations, with the Northeast Atlantic on one side and the Northwest Atlantic on the other, and the composition changing on an annual basis. This hypothesis is consistent with genetic studies that report weak (but detectable) population structure across the Atlantic and inconclusive evidence for a firm geographic boundary (Knutsen et al., 2007; Roy et al., 2014; Westgaard et al., 2017).
Northwest Atlantic
Most Greenland halibut in the Northwest Atlantic resided in the management area where tagging occurred, while some migrated large distances between areas and others migrated to the Northeast Atlantic management areas. There was no evidence of a large-scale migration of juveniles, as observed in the Northeast Atlantic, likely a result of less focused tagging of fish <50 cm (i.e. the Northeast Atlantic comprises a large set of data focused on juvenile tagging). Spawning areas have not been clearly identified in the Northwest Atlantic, while juvenile areas and feeding areas, for all sizes, have been identified on the shelves, slopes, and fjords or bays. The current understanding is that the Northwest Atlantic stocks are primarily supported by spawning in the Davis Strait (Jensen, 1935; Smidt, 1969; Simonsen and Gundersen, 2005; Gundersen et al., 2010) suggesting a single biological population (Bowering, 1984; Roy et al., 2014). The presence of migratory and resident individuals in the same population is common among marine fish populations (Chapman et al., 2012). Barkley et al. (2018) found evidence for individuals that were temporarily resident versus others that were transient in a coastal region of Baffin Island, and our mark–recapture tag data also suggest the presence of more resident and migratory contingents (Secor, 1999) within the management units comprising the Northwest Atlantic population. The seasonal transitions of Greenland halibut in Cumberland Sound based on acoustic telemetry data (Hussey et al., 2017) and repeated observations of individuals across years (Lees et al., 2022) further support that larger fish can show high site fidelity to specific coastal regions in agreement with data from coastal regions in West Greenland (Boje, 2002). These observations provide the first indications for sub-stock structuring within the Northwest Atlantic Greenland halibut population, based on migratory type, fidelity to coastal regions, or other phenotypic characteristics (Roy et al., 2014; Shackell et al., 2021).
Assumptions and bias
We selected a relatively simple way to analyse our data basing our conclusions on the assumptions outlined in the material and methods. Whether confounding factors and assumptions bias our conclusions largely depends on the directional impact of each factor and assumption. Assumptions that lead to overestimation of dispersal rates could lead to erroneous conclusions of high stock connectivity.
When considering the key confounding factors in our analyses, we suggest our results would likely lead to underestimation of dispersal rates. Most fish included in this study were tagged close to fishing grounds; therefore, the probability of an individual fish being caught would decrease with increasing distance from its tagging location and time since release, unless the fish moved to another fishing ground. As a fish moves further away from its release location, it may move into regions not sampled by the fishing fleets, effectively diluting its recapture probability. This applies in particular to estimates of migrations from Iceland to Southeast Greenland that could be underestimated since fishing effort for Greenland halibut east of Greenland was low in the 1970s when tagging was first conducted, relative to the post 1990s (ICES, 2021a). This is also true for fish tagged in the Northwest Greenland fjords prior to the expansion of the fishery into Baffin Bay in the early 2000s, and for fish in Southwest Greenland fjords that were tagged during a period of low fishing effort. Similarly, the longer a fish is at liberty, the greater the chance it can shed or lose its tag, or that the fish dies as a result of natural causes. Time at liberty could further be confounded by length at tagging; juveniles are generally not captured by fisheries until they have grown to an exploitable size with respect to fishing gear type and minimum size regulations (Huse et al., 1999). This longer time at liberty for smaller fish could partly explain why most migrations were undertaken by fish <50 cm. Further, the probability of fishermen noticing tags is higher in small scale fisheries using longline or gillnets where each fish is handled individually compared to the industrial trawl fishery offshore adding to the bias introduced by gear selectivity. Hence, tag reporting from inshore areas, such as West Greenland fjords, could be higher than from the adjacent offshore area (Northwest Arctic) leading to underestimation of migration.
Additional factors could also result in either over- or under-estimation of Greenland halibut migration rates. While there were no apparent temporal trends in our data that could not be explained by tagging activities, Greenland halibut migration likely varies over time such that time of tagging operations could be highly influential on determining migration rates. Moreover, fishing effort and mortality, as well as tag reporting, are not evenly distributed among regions. For example, spawning of Greenland halibut in the Davis Strait is thought to occur between December and March (Gundersen et al., 2010), a period when the region experiences high sea ice extent limiting recaptures of fish during this period. It is also important to note that dispersal rates estimated by our simple algebra-based approaches appear unrealistic for regions with only a few recovered fish (e.g. Cumberland Sound and Southeast Greenland), especially when the data are separated by size classes. Further, the use of size classes (at tagging) leads to the assumption that these size classes are equally distributed across regions, related to average catches, leading to the potential of overestimating dispersion from Northeast Arctic to the West Nordic stock. However, we are not aware of any more suitable method that could correctly estimate the migration rates of tagged Greenland halibut given the challenges associated with analysing such a large and unbalanced dataset containing mark–recapture data from nearly 70 years of tagging (i.e. 1952–2021). Despite these difficulties, and acknowledged biases, the dispersal estimates provide valuable insights into movement inter-connectedness across regions throughout this species’ distribution and allow the generation of testable hypotheses on region specific movement dynamics.
Future directions for understanding Greenland halibut residency and migrations
While the current conventional tag recapture data indicate distinct migration patterns and dispersal rates of Greenland halibut among management areas across the North Atlantic, these data also highlight key knowledge gaps that remain to be addressed. Future studies should combine the tagging data with population and species distribution models (e.g. as illustrated by Thorson et al., 2021). Spatial population assessment models coupled with management strategy evaluation could be useful to understand the implications of a mis-match between management and biological units for the population(s), while weighing social and economic goals (Kerr et al., 2016). Future modelling studies could investigate varying hypothetical stock structures through modifying dispersal rates among regions to test sensitivities to different management scenarios. Future studies could also look at whether different components of the species behave differently or have different life history strategies that could translate into local adaptation. The genomics of tagged individuals could also be assessed to determine whether there may be genomics signals related to different migration strategies. While the dispersal of larvae is undoubtedly controlled by ocean currents (Ådlandsvik et al., 2004), extensive long-distance migrations, especially by small fish (at time of tagging), may result in substantial mixing of Greenland halibut populations, making it difficult to detect genetically differentiated populations even if population boundaries existed (Slatkin, 1985; Knutsen et al., 2007; Roy et al., 2014; Westgaard et al., 2017). However, genetic isolation is not the only source of structuring to consider in fisheries management and the “contingent theory” has been proposed to explain the segregation of groups within populations based on specific migration patterns or life-history characteristics (Secor, 1999; Cadrin and Secor, 2009; Shackell et al., 2021). Local adaptation theory could also explain observed differences in biology and life-history of Greenland halibut in the Northwest Atlantic despite evidence of panmixia (Roy et al., 2014; Hoban et al., 2016). Accounting for this sub-structure in fisheries management can be important to maintain resilience and sustainability of the larger biological population (Shackell et al., 2021).
While we found that smaller individuals at tagging are more likely to undertake large scale movements, adult fish must migrate to spawn on a regular basis, and these spawning migrations are likely timed according to their relative distance from spawning areas following the migration triangle hypothesis (Harden Jones, 1968; Secor, 2002). Spawning migrations may also consist of directed non-stop offshore movements or directed movements interspersed with stop over or residency periods. Identifying spawning areas, and quantifying spawning migrations will allow an understanding of whether these adults move between management areas to perform this function. For example, fish that occur in the Cumberland Sound management area could undertake spawning migrations to the Davis Strait or Southeast Greenland. Observed movements of fish from Northeast Canada to the Davis Strait could also represent spawning migrations that cross management units. Determining if residency behaviour of large fish to coastal or offshore regions, shown via these data and previous acoustic telemetry data (Barkley et al., 2018), equate to individuals exhibiting inter-annual site fidelity remains to be tested. Further, the prominent migrations to Iceland of juveniles tagged at the nursery area around Svalbard would be an indication that they also undertake migrations back to the main spawning grounds at the slope between Norway and Svalbard. We also note that juvenile Pacific halibut (Hippoglossus stenolepus), another large flatfish, are known to undergo long migrations (called contranatant migration), while adult migration is localized (Seitz et al., 2017; Carpi et al., 2021). Future studies could investigate whether such a model would be applicable for Greenland halibut.
Quantitatively assessing the location of Greenland halibut spawning grounds is a priority. To date, spawning grounds are largely proposed based on observations of caught mature females, eggs, and modelled larval drift, but with no direct spawning migrations documented. Finally, the proposition of Southeast Greenland and/or Iceland as a mixing zone based on reported tag recaptures herein, indicate focused tagging efforts should be undertaken to further assess the directionality and level of exchange between the proposed Greenland halibut populations in the Northeast and Northwest Atlantic. Electronic tagging, including data storage tags with compass function (DST), pop up archival or mark report satellite tags (Peklova et al., 2012; Hussey et al., 2018), or acoustic telemetry arrays and surgically implanted coded transmitters (Barkley et al., 2018) could provide more detailed continuous movement data on individuals over multiple years, to address these questions, complementing conventional mark recapture efforts. These telemetry methods also result in movement data that is independent of fishing effort, while returns from conventional tagging or DST tagging are limited by the spatial and temporal distribution of fishing activity in order to obtain recapture reports.
Fisheries management and stock identification
The identification of populations and/or stocks of Greenland halibut in the North Atlantic based on the location of spawning-, nursery-, or foraging-grounds is fragmentary for most areas. However, our study contributes to the increasing body of evidence for three biological populations of Greenland halibut in the North Atlantic: one in the Gulf of St. Lawrence; one comprising the Newfoundland, and Labrador shelf and Grand Banks, Davis Strait and Baffin Bay (including deepwater inshore areas) in the west; and one comprising the Barents Sea, Norwegian Sea, and waters around Faroe Islands, Iceland, and off Southeast Greenland in the east. There is some evidence of mixing around Southeast Greenland and West Iceland and the potential for structure at the sub-population level, particularly in the Northwest Atlantic, where variation in migratory strategies are observed (i.e. resident and migratory). Fish populations are more resilient if their biological complexity is maintained (Kerr et al., 2016) and may benefit from finer scale management (Spies et al., 2015; Shackell et al., 2021). Modelling has shown that when complexity is taken into account in assessments the risk of over-exploiting one or more populations, or segments of a population is reduced (Kerr et al., 2014, 2016). Greenland halibut assessments currently apply the unit stock concept to two stocks in the Northeast Atlantic and six in the Northwest (see Introduction) without considering the connectivity among the stocks, which could bias assessments and estimates of maximum sustainable yield (Kerr et al., 2016). Given our emerging understanding of the spatial complexity of Greenland halibut populations and the potential for sub-structure we recommend a review of the current management units. This study is one component of a larger project that includes work on genetics, egg and larval drift, and stock assessment modelling that could contribute to such a review. If changing the management units is considered too difficult given pragmatic considerations or national interests, an alternative advisory framework could be developed. This could simply be an adapted assessment model, where area connectivity is estimated periodically in a larger population model, or one could develop a range of simpler advice rules for each management area and select the best performing strategy on the basis of a management strategy evaluation.
Statement of competing interests
Authors declare no competing interests.
Author contributions
MV, BTE, MT, AN, OTA, and JB conceptualized and designed the study. OTA, JB, MT, AN, KH, NEH, LW, LHO, AB, RN, BN, BTE, and PS contributed data. BTE, AN, MT, MV, JB, RN, LW, and AB participated in data curation. MV and BTE designed the mathematical framework and conducted the analyses. MV, MT, JB, DR, KH, NEH, and OTA wrote the first version of the manuscript. All authors contributed to drafting and revising the final version of the manuscript.
Data availability statement
The compiled tagging dataset can be found from https://doi.org/10.21335/NMDC-1010120860. The dataset does not contain Faroese data which are available upon request from the Faroese authors (LHO or PS).
Funding
Funding for two workshops to facilitate the compilation and analysis of this work was supported by the NORSUSTAIN project funded by joint Danish, Greenlandic, and Faroese Presidency of the Nordic Council of Ministers in 2020, and the Nordic science group on tagging compilation for Greenland halibut funded by AG-Fisk under the Nordic Council of Ministers.
ACKNOWLEDGEMENTS
We acknowledge Tone Vollen and Lise Heggebakken for the collection and management of Norwegian tagging data; Ole Jørgensen for initiating and conducting the Greenland offshore tagging programme during 2007–2010; Captains, fishing and science crews for undertaking the tagging expeditions across regions and years.
