


Abstract
The offshore windfarm industry has great potential for sustainable energy but requires space. The ability of fisheries to harvest within these windfarms varies. This has created a conflict between these two industries and discussions are hampered by differing approaches to the marine environment, a lack of understanding of what each industries requires, the significant money at stake, and the values the public place on marine conservation. To characterize, standardize, and quantify the scientific data addressing these concerns requires a framework. The framework should categorize data on spatial scales of 1 cm2 to 1 km2 (individual turbines/fishing vessels), 1–1000 km2 (companies), and >1000 km2 (regions), and by their ecological, economic, cultural, and institutional impacts. The framework should be repeated over temporal scales of the windfarm: pre-development (1–3 years), construction (1–2 years), post-construction (20–40 years), and decommission. Balancing the metrics used to describe the two industries will allow people to communicate clearly in an organized systematic way, hopefully resulting in a continuing supply of sustainable sea food and renewable energy to an increasingly hungry world.
Introduction
The dire consequences of global warming coupled with advances in engineering have led to the enthusiastic development of offshore wind. This will occur primarily on continental shelves and as such, the overlap between windfarms, aquaculture, and wild capture fisheries is inevitable. Worldwide offshore wind development is estimated to increase from 17.6 GW (gigawatts) in 2017 to 270 GW in 2030 with an additional 8.5-fold increase by 2050 if net zero emission goals are achieved (Lee et al., 2021).
Continental shelves provide habitat for large portions of the stocks targeted by fisheries. Global fish production peaked in 2018 at 178 million tons, translating into energy consumption per capita of 23 kg (FAO, 2020). Marine fish production is divided into 82 million tons from aquaculture and 96 million tons from wild capture (FAO, 2020). Given the structural requirements of offshore wind coupled with the huge financial investment backed by government mandates to replace emissions with renewable energy, fishing industries will need to adapt (Mann, 2021). The abilities of fisheries to harvest within or next to these windfarms depends on the type of fishery (towed or fixed gear), weather conditions, the spacing and design of the turbine array, turbine foundation structures, and the degree to which the windfarm development changes the benthic, pelagic, acoustic, and electromagnetic environments influencing the fish and invertebrate communities. The windfarm industry should recognize and minimize these effects.
A “systems” framework considering the strategic and operational aspects of management while incorporating the pillars of sustainability (ecological, economic, social, and institutional) was proposed for fisheries management (Stephenson et al., 2017, 2018). Each pillar is broken down into performance objectives (Stephenson et al., 2018). Ecological objectives include productivity and trophic structure, biodiversity, and habitat and ecosystem integrity. Economic objectives include economic viability and prosperity, livelihoods, and distribution of access and benefits. Social objectives include health and well-being encompassing food supply, green energy supply, recreation, and leisure, reduced stress in the work environment, safety, and ethical considerations. Institutional objectives include good governance structure, effective decision-making processes, and legal obligations. Ecosystem-based management aims to quantify tradeoffs among these pillars over multiple ocean use sectors (e.g. Tallis et al., 2010; Dolan et al., 2016), warranting an expansion of systems considerations to both windfarms and fisheries including their interactions. Here, we outline a framework for taking such a perspective.
The issue of scale is fundamental to addressing the intersection between windfarms and fisheries (Table 1). Mayr (1997) applies the scale of the individual, the population, and the community to ecological questions. Our framework adapts these ideas to fisheries and windfarms where the individual scale could be represented by a fishing vessel, and the turbine structure. This deals with interactions from the scale of 1 cm2 to 1 km2. The population scale represents a fishing company, a group of interconnected individuals, or a specific windfarm development array, such as the Vineyard Wind development in area 501N within the Massachusetts lease area, or the Sheringham offshore windfarm off the coast of England. These interactions occur on the scale of 1–1000 km2. The community scale is regional, a fishing fleet or windfarms, covering areas >1000 km2, dealing with multiple companies and developments along seaboards, possibly extending into international waters onto an oceanic scale (Table 1).
The framework categorizing data on spatial scales that would be repeated over temporal scales associated with the windfarm development project including pre-development (1–3 years), construction (1–2 years), post-construction (20–40 years), and decommission.
| Spatial scale | offshore wind | Fisheries |
|---|---|---|
| 1 cm2–1 km2 | Single turbine | Single vessel |
| 1–1 000 km2 | Single company | Single company |
| >1 000 km2 | Regional development | Fishing fleet |
| Spatial scale | offshore wind | Fisheries |
|---|---|---|
| 1 cm2–1 km2 | Single turbine | Single vessel |
| 1–1 000 km2 | Single company | Single company |
| >1 000 km2 | Regional development | Fishing fleet |
Within each of these scales, data would be compiled addressing the pillars of sustainability through a series of objectives designed to describe the status of each industry. In the United States, for example, fisheries are governed by the Magnuson–Stevens Act addressing ten national standards that define priorities and principles for management (USDOC, 2007). Using these National Standards to define the objectives within each pillar could provide context generating questions to begin constructing the framework (Table 2). For the ecological pillar, the objectives would examine the scientific information on the changes to the benthic, pelagic, acoustic, and electromagnetic habitats and the communities they support (Gill, 2005). The economic pillar objectives could include efficiency, economic viability and prosperity, and optimal harvest of energy. The social pillar objectives could include fair and equitable practices, promotion of safety, community structure, and sustainability. The Institution pillar objectives could include legal obligation, governance structure, minimizing cost, and avoiding duplication (Table 2). Assembling the knowledge by addressing these questions on fisheries and windfarms characterized within each objective would provide a coherent overview identifying data gaps and focusing efforts on a holistic understanding of system linkages. Ideally, the framework would be assembled and repeated over temporal scales associated with the windfarm development project including pre-development (1–3 years), construction (1–2 years), post-construction (20–40 years), and decommission.
Questions are generated from the US National Standards for fisheries (https://www.fisheries.noaa.gov/national/laws-and-policies/national-standard-guidelines).
| These questions would be slightly modified for each scale (individual, popuation, and community) and repeated through life-cycle of the project. | ||
|---|---|---|
| Categories | Objectives | Questions |
| Ecological | Scientific information | What scientific knowledge is available? |
| Habitat and community | Does productivity and trophic structure change? | |
| Benthic | Does it change the species occurrence and distribution? | |
| Pelagic | Does it change the species occurrence and distribution? | |
| Acoustic | Does it change the species occurrence and distribution? | |
| Electromagnetic | Does it change the species occurrence and distribution? | |
| Economic | Efficiency | Is the resource efficiently utilized? |
| Prosperity | Does the harvest promote prosperity for consumers? | |
| Prosperity | Does the harvest promote prosperity for producers? | |
| Optimal harvest of energy | Is the resource optimally harvested (viability, livelihood, and benefits)? | |
| Social | Fair and equitable | Does the development and use conflict with other uses? |
| Fair and equitable | Does the development and use discriminate between producers? | |
| Promote safety | Is safety at sea effected by the harvest? | |
| Structure and sustainability | Are health and well-being (food supply, green engery supply, and ethics) effected? | |
| Institution | Governance | Is there a good governance structure promoting a decision-making process? |
| Legal obligation | What are the individual legal obligations of industry members? | |
| Minimizing cost | Is the cost of management and regulation minimized? | |
| Duplicity | Is there duplication of governance effort? | |
Implementing this framework is an ambitious undertaking, but an example may help to clarify the framework's usefulness. Scallop fisheries in the United Kingdom, Europe, and North America are generally data-rich with well-defined spatial distributions (WGScallop (ices.dk)).
Consider the developing situation along the East coast of the United States, an area proposed for heavy windfarm development with 19 projects under evaluation and over 9000 km2 already leased. Applying the framework using the National Standards to assess the scallop fishery and the windfarm industry provides an understanding of their characteristics across management priorities and spatial scales, helping to understand where integrated use might require tradeoffs (Tables 2–5).
A “mock-up” of the framework at the individual scale (1 cm2–1 km2), comparing the wind energy to the scallop fishery, on this scale the effects of an individual turbine are compared to the effects of an individual scallop fishing vessel.
| Individual (1 cm2–1 km2) | |||
|---|---|---|---|
| Categories | Objectives | Turbine | Scallop Fishing vessel |
| Ecological | Scientific information | Summarized in Twigg et al. (2020) | Extensive, Steward, and Howarth (2016) |
| Habitat and community | Potential long-term alteration | Minimal temporary fine scale distrubance | |
| Benthic | Permanent, creating hard structure | Disturbs sea floor, varying recovery times | |
| Pelagic | Change current patterns | No effect | |
| Acoustic | Varying levels of disturbance | Vessel engine and dredge on the sea floor | |
| Electromagnetic | Limited understanding of effect | Unknown | |
| Economic | Efficiency | 33% energy extraction | 20–40% dredge efficiency |
| Prosperity | High projection | Yes | |
| Prosperity | Yes | Yes, not overfished/overfishing | |
| Optimal harvest of energy | High projection | Under debate | |
| Social | Fair and equitable | Yes | Yes |
| Fair and equitable | Restricted activity near turbines | Regular fishing operation and navigation | |
| Promote safety | Yes | Yes | |
| Structure and sustainability | Green energy supply for 3 500 householdsa | Protein supply for 900 people annuallyb | |
| Institution | Governance | Developing | Yes |
| Legal obligation | Unknown | Follows federal regulation | |
| Minimizing cost | Yes | Yes | |
| Duplicity | No | No | |
13-MW turbine, 33% capacity factor, US household 10655 kWh annually.
84 g steamed scallop, 19.5 g protein, 70 mt per vessel in 2022.
A “mock-up” of the framework at on the population scale (1–1000 km2), comparing the wind energy to the scallop fishery; on this scale the effects of a windfarm field are compared to the effects of a scallop company owning several vessels.
| Population (1–1 000 km2) | |||
|---|---|---|---|
| Cube cell | Objectives | Windfarm Company | Scallop Fishing Company |
| Ecological | Scientific information | Summarized in Twigg et al. (2020) | Minimal information on this scale |
| Habitat and community | Potential long-term alteration | Minimal temporary distrubance | |
| Benthic | Creates islands with tidal and substidal zones | Temporary disturbs sea floor with dredge passage | |
| Pelagic | Change current patterns, remove energy from the wind | No effect | |
| Acoustic | Varying levels of disturbance | Compounded from single vessel | |
| Electromagnetic | Limited understanding of effect | Unknown | |
| Economic | Efficiency | Efficiency of energy extraction relies on farm configuration | High, crews fishing multiple vessels |
| Prosperity | Yes, renewable energy customers willing to pay premium | Yes | |
| Prosperity | Yes, at a scale sufficient for positive net revenue | Yes, at a scale sufficient for positive net revenue | |
| Optimal harvest of energy | Yes, but likely lowered than optimal due to turbine spacing | Yes, but overcapacity, 60 fishing days in 2022 per vessel | |
| Social | Fair and equitable | Yes, but area may be restircted to activities | Yes, but possible conflicts with different gear types |
| Fair and equitable | Competitive lease application | Limited access fishery | |
| Promote safety | Restricted activity near turbines | Regular fishing operation and navigation | |
| Structure and sustainability | Dependent on construction design | Dependent on company structure | |
| Institution | Governance | Developing | Yes, NEFMC and NOAA Fisheries |
| Legal obligation | Follow Bureau of Ocean Energy Management (BOEM)/Federal regulations | Requirments of fishing regulations | |
| Minimizing cost | Poor understanding of how to integrate with other ocean uses | Fisheries governance requires significant cost | |
| Duplicity | Yes, but regulatory effort could be realigned across agencies | No | |
A “mock-up” of the framework at on the community scale (>1000 km2), comparing the wind energy to the scallop fishery; on this scale the effects of the regional windfarm development along the north–east US continental shelf are compared to the effects of the US Scallop Industry.
| Community (>1 000 km2) | |||
|---|---|---|---|
| Cube cell | Objectives | Windfarm Mid-Atlantic development | US Scallop Fishery |
| Ecological | Scientific information | Summarized in Twigg et al. (2020) | Extensive—example Final Amendment 10 (NEFMC 2004) |
| Habitat and community | Potential long-term alteration | Summarized in Steward and Howarth (2016) | |
| Benthic | Aggregations of Islands | Intense fishing influences seafloor structure and community | |
| Pelagic | Impact major current patterns, Gulf Stream/Labrador currents. | No effect | |
| Acoustic | Varying levels of disturbance | Compounded from single vessel | |
| Electromagnetic | Limited understanding of effect | Unknown | |
| Economic | Efficiency | Yes, competitive auction for leases | Yes, two times above estimated Bmsy |
| Prosperity | Transboundary carbon pollution reduced | Yes, supply of scallop provide high benefits consumer | |
| Prosperity | Primarily transnational corporations | US companies | |
| Optimal harvest of energy | Nomination process and efficient producers (via lease competition) | Yes, not overfished/overfishing | |
| Social | Fair and equitable | Competitive lease application | Limited access fishery |
| Fair and equitable | Effects navigation | Regular fishing operation and navigation | |
| Promote safety | Yes | Yes | |
| Structure and sustainability | For 2030 projection = 8 million households | 22 000 mt landings in 2020, US$486 million, protein for 300 000 people | |
| Institution | Governance | Developing | Magnuson–Stevens Fishery Conservation and Management Act |
| Legal obligation | None on regional level | Fishery managed through range | |
| Minimizing cost | Common pool resource, governance costs unknown | Significant cost as a common pool resource | |
| Duplicity | Yes, multilateral Construction and Operation plans (1 per site) | No | |
On the scale of the individual (1 cm2–1 km2; Table 3), the turbine and the fishing vessel, a social problem for spatial management and planning is navigation and safe passage. New offshore windfarms can significantly change direct and indirect transit costs for recreational, shipping, and fishing vessels (Samoteskul et al., 2014). These transit costs are substantial and include fuel, engine hours, opportunity cost of crews’ time, risk (expected damage and increased insurance premiums), and if a fishery is regulated by a Days-At-Sea (DAS) strategy as the US scallop fleet is, the DAS opportunity cost of that transit time. Consider the difficulty of a towed gear fishing vessel (such as a groundfish trawl or scallop dredge) operating through a field of fixed fishing gear (such as lobster pot sets; Figure 1). The US Coast Guard has released advice suggesting the windfarm turbines should be spaced one nautical mile (1.852 km) apart on a latitude–longitude grid stating that this would address the navigational concerns for the fishing industries of New England provided they use extra caution while transiting (US Coast Guard, 2019). Windfarms will affect radar performance by substantially increasing strong reflected energy, cluttering the operator's display leading to complications in navigation decision-making (NAS, 2022). On a fishing vessel radar set to 6 nautical miles (11.1 km), there will be 121 turbines within the viewing radius (Figure 1). Overlaying a fixed gear trap fishery that could operate within a windfarm, other vessels transiting, and the 121 turbines results in many targets increasing the difficulty of navigating considerably, which will be further complicated by inclement weather. Risk analysis and systematic fault tree assessment indicate high volumes of marine traffic, speed, inclement weather, and operation malfunction all effect operational marine safety (Bela et al., 2017; Mou et al., 2021). Precautionary measures in response to hazardous situations can include “no-sail zones” as recently occurred in all Ørsted windfarms using the Anholt: a Siemens–Gamesa 3.6–4 MW wind turbine (Blenkey. MARINELOG. 7 April 2022. https://www.marinelog.com). It is possible that insurance companies will dictate the proximity a vessel can operate to a wind turbine and whether the windfarm areas will be open or closed to fishing, as collisions that result in downtime for wind energy production can result in revenue losses starting at US$6000/day for even the lowest rated capacity offshore wind turbines (Griffin et al., 2015; Mujeeb-Ahmed et al., 2018).
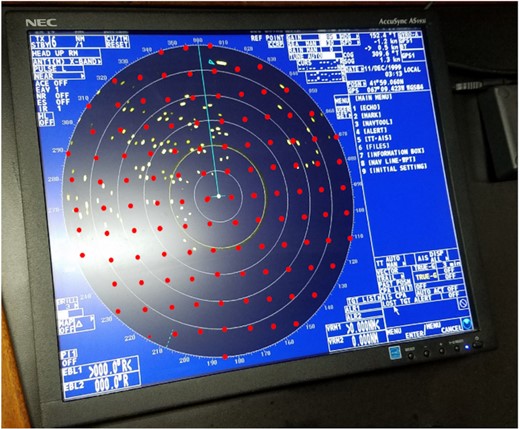
The radar screen set to 6 nm (each ring representing 1 nm) from a fishing vessel on the northern edge of Georges Bank USA. The yellow dots are highflyer buoys marking the ends of a string of lobster pots. The red dot matrix is a representation of windfarm turbines on a 1 nm grid suggested by the US Coast Guard with 121 within the 6 nm radar radius.
An individual turbine will also be a fundamental change in the marine coastal environment as it increases the availability of hard surfaces that can be colonized by sessile invertebrates. The world's ports have created new habitat for about 950000 metric tons of sessile invertebrates, which release 600 metric tons of CO2 and consume roughly 5 million megajoules of energy daily (Malerba et al., 2019). This translates into 1 m2 of artificial structure cancelling out 130 m2 of coastal water primary production. The US Mid-Atlantic shelf is a relatively homogenous sand dominated offshore environment and these structures introduce intertidal and subtidal zones to an offshore environment, presenting a unique experimental example of Island (Insular) biogeography (MacArthur and Wilson, 1967).
The scale with the most research in impact analysis to date is the population (1–1000 km2; Table 4); the individual windfarm development site leased by a specific company, equivalent to a fishing company which owns several vessels that work in a somewhat coordinated fashion. The windfarm companies are responsible for assembling environmental assessment statements to address the impacts of their specific site development. In the United States, a recent example of a baseline study that has been approved by the BOEM is the Vineyard Wind development site 501 south of Martha's Vineyard, MA, USA. The seasonal fishery resource surveys are examining the substrate and benthic macroinvertebrate, groundfish, and planktonic communities. Supplemental studies examining juvenile and adult life stages movement patterns using tagging technology, egg and larval dispersal models, optical transect surveys extending from individual turbines, analysis of fisheries monitoring data to detect impacts on highly migratory species, cable monitoring and monitoring of acoustic impacts are also underway (documents are available at https://www.vineyardwind.com/fisheries-science, and data-sharing agreements are in place).
The least studied or coordinated scale is that of the community dealing with the overall regional windfarm development (>1000 km2; Table 5). This is not the case for the fishery as it is the scale on which the fishery stocks are managed, so there are well established data sets, modeling efforts and management policies, including International Council for the Exploration of the Sea (ICES) in Europe and in the United States the work of the management councils and National Marine Fisheries Service. These data can be used to predict the interactions between these industries; for example, work underway in Europe (Stelzenmuller et al., 2022) examines the potential development of windfarms and estimates the amount of fishing effort that will be displaced by fishing gear, finding that trawl fisheries having the greatest disruption. A series of research studies in France examine the socio-economic impacts of windfarm development on fisheries through modeling (Raoux et al., 2018; Haraldsson et al., 2020; Niquil et al., 2021). These research efforts are advanced as in Europe the development of windfarms have been ongoing for many years with a compound annual growth rate of roughly 20%, which is projected to continue to 2030 (Lee et al., 2021). The situation in the United States is quite different, presently there are only a few offshore wind turbines (five off Block Island and two off Maryland) but the estimated compound annual growth rate is 79% from 2020 to 2030 with the vast majority of construction occurring from 2023 to 2026 (Lee et al., 2021). This development of 30 GW is estimated to create 77000 new jobs, catalyze US$12 billion in capital investment and cutting 78 million metric tons of carbon dioxide emission (Fact sheet: Biden Administration Jumpstarts Offshore Wind Energy Projects to Create Jobs. https://www.whitehouse.gov/). This growth is only the beginning, and the present development represents 27% of that committed to by 2050. However, the fishing industry in this area is very productive as well with 15 stocks supporting about 300000 jobs along the east coast.
New Bedford MA has been the highest valued fishing port in the United States landing 52000 metric tons worth US$450 million and supporting 35350 jobs in the city alone (New Bedford Port Authority, 2019). The majority of these landings are the Atlantic Sea scallop, whose stock size is estimated to be well above the biomass that supports maximum sustainable yield and has been for the past 20 years, and is supported by a strong scientific effort (Stokesbury et al., 2016). With this scientific information, the amount of potential overlap between fishing grounds and windfarm fields can be estimated. In the Mid-Atlantic, 20.3% of the scallop drop camera survey area ( Figure 2) in 2012 is proposed for windfarm development, representing 11.2% of the scallop biomass, and 14.1% of the exploitable biomass. The industry harvests roughly 20% of the scallop biomass on the sea floor annually. The scallop fishery is aggregated, and the areas of highest overlap are off the coast of New York and New Jersey, where the demand for energy is the greatest (Figure 2). The Atlantic Sea scallop fishery landed US$541 million in 2018 (National Marine Fisheries Service, 2020). The windfarm areas off New York were recently leased through auction for US$4.3 Billion (https://www.boem.gov/renewable-energy/state-activities/new-york-bight). It is unlikely that the scallop fleet will be able to harvest within the confines of a windfarm, and this would result in the loss of access to a substantial portion of fishing area and harvestable scallop biomass.
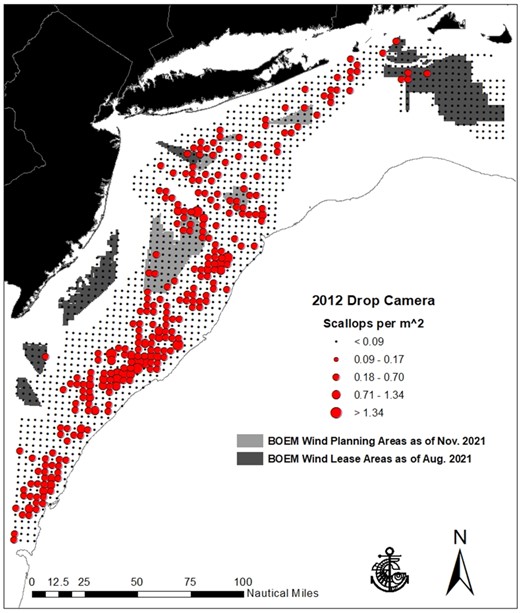
The 2012 SMAST drop camera survey grid, each dot represents a station with four 2.3 m2 quadrats sampled, red dots represent scallop density, light-grey areas represent planned windfarm areas, and dark-grey represent areas already leased by BOEM to windfarm development companies. A recent call for information on areas in the central Atlantic was issued on the 16 February 2022, updated information can be found on the Northeast Data Portal (https://www.northeastoceandata.org/).
Oceanographic modeling will be a key tool to examine windfarm and fisheries interactions at the community scale. A 39-year simulation using a refined subdomain grid (up to ∼1.0 m) finite-volume community ocean model (FVCOM) under the platform of Northeast Coastal Ocean Forecast System (NECOFS), with a computational domain covering the regions of the shelf off Massachusetts, Rhode Island, Block Island, Block Island Sound, and Long-Island Sound (Chen et al., 2016; 2021a) suggested that the Vineyard Windfarm field could considerably change the larval scallop distribution in the southeast (Stokesbury and Bethoney, 2020; Chen et al., 2021b).
Conclusions
The oceans face severe threats from climate change, ocean acidification, land-based runoff, pollution, and poor management of resources (modified from Hilborn, 2020). Alternative energy sources are key to addressing several of these threats. Windfarms and fisheries both harvest renewable, sustainable energy. A review of the benefits, challenges, and impacts of Windfarm development in offshore waters was recently published in a special series of Oceanography (Twigg et al., 2020). Working groups for the North Atlantic and the Pacific have been organized including Responsible Offshore Development Alliance, Responsible Offshore Science Alliance, the ICES Working Group on Offshore Wind Development and Fisheries (WGOWDF), and the National Academies of Sciences, Engineering and Medicine (NASEM, 2017). A comprehensive and integrated decision-making process across ocean users can help address multiple challenges to sustain healthy ecosystems and secure thriving coastal communities and marine industries in the face of societal and climate change (Froehlich et al., 2021; Stephenson et al., 2021).
Inevitably the implementation of a scientific framework for evaluating and coordinating industry interactions comes down to the question: where does the funding come from? Again, we can look to the example of the Atlantic Sea scallop. When plans were underway in 2003 to develop a new rotational system that would require much more spatially explicit data than was being gathered by the National Marine Fisheries Service, a Research-Set-Aside program was established where a portion of each year's allocated harvest was used to support scientific research and monitoring. In recent years, the annual amount has been about 567 metric tons (worth ∼US$14 million in total and US$2.8 million for research; https://nefsc.noaa.gov/coopresearch/rsa_program.html). Applying this strategy to both fisheries and the billions of dollars of wind energy leasing revenue could provide partial funding for a scientific framework and the variety of studies required to fill in the data gaps to improve outcomes.
Presently, these two industries with different perspectives and values are not communicating well. We propose using a framework to help structure differing uses of the continental shelf; our example builds on the highly developed fisheries management structure. The framework puts information about the effects of each of these two industries on the ecological, economic, social, and institutional environments onto spatial and temporal scales that can be categorized. It serves to line up the information for each industry and point out where the data gaps exist. It is not explicitly about tradeoffs/impacts between sectors, but about characterizing what is known about each sector for each scale and priority. This will lead to simulation modeling and tradeoff analysis through strategic decision-making approaches such as the NOAA Integrated Ecosystem Assessment (Wyatt et al., 2017), Sea Scape Ecology (Pittman et al., 2021), Management Strategy Evaluation (Punt et al., 2014; Kaplan et al., 2021), and Cumulative Effects Assessment (Judd et al., 2015; Willsteed et al., 2017; Stelzenmüller et al., 2018; 2018; Willsteed et al., 2018a,b). All these approaches are complex, confront multiple sources of uncertainty, and will benefit from a framework coordinating data on spatial and temporal scales. A cumulative effects assessment was recently completed in the North Sea with the fisheries and offshore windfarms industries, examining their impact the ecosystem and is an excellent first step to a systematic approach (Piet et al., 2021).
The framework could serve as a road map to put the industries on the same playing field and set the stage for more explicit, transparent consideration of needs, conflicts, and impacts. Using the National Standards or other fishery management guidelines has several advantages; first, the analysis is already done for all managed species, and, second, people have a general understanding and acceptance of them.
Data availability statement
No new data were generated or analysed in support of this research.
Author contributions
KDES wrote this manuscript, to which GF and RG contributed.
Conflict of interest statement
None
Funding
Funding was provided by KDES indirect funds, RG National Oceanic, and Atmospheric Administration award NA14OAR4320158 and National Science Foundation award CBET-2137701, and GF indirect.
ACKNOWLEDGEMENTS
This manuscript germinated from a seminar given at SMAST by R Stephenson on his outstanding work for the Canadian Fisheries Research Network, coupled with the ideas presented by E Mayr in his excellent book “This is Biology”. N. D. Bethoney and K Cassidy, B. Shank created the map and provided insight. The manuscript benefited greatly from the reviews of N. D. Bethoney, A. Lipsky, S. E. McLelland, D. Secor, three anonymous reviewers, and the editors. The views expressed herein are those of the authors and do not necessarily reflect the views of any agencies.
