


Abstract
We used satellite tags to monitor the movements of yellowfin tuna, blue marlin, and sailfish in the Palau National Marine Sanctuary (PNMS) and provide a first look into their use of this large-scale marine protected area (LSMPA). Tagged fish ranged over a wide geographic area between 1°S to 17°N and 125 to 154°W. Both blue marlin and sailfish exhibited fidelity to the PNMS; however, they dispersed more than 1000 km before returning. The monitoring periods of yellowfin tuna were insufficient to evaluate their long-term movements, but their dispersal from Palau's EEZ occurred in all directions, up to distances of 2010 km. The space use of this pelagic species assemblage overlapped with two bodies of international waters, six EEZs, and the Western and Central Pacific Fisheries Commission's management units seven and three of the western Pacific Ocean. Our results add to the knowledge base on the movements of pelagic species in the PNMS and highlight the need for additional research to determine the long-term movements of these species and the contribution of the PNMS to fisheries management in the western and central Pacific Ocean.
Introduction
Pelagic fisheries represent an important source of economic revenue, food security, and culture to the people of the Pacific Islands (Bell et al., 2015, 2018). About 81% of the tuna landed in the Pacific Ocean comes from the waters of the western and central Pacific and the Pacific Island countries that are Parties to the Nauru Agreement (PNA) control approximately 60% of this region's tuna supply and 25–30% of the world's tuna resources (Sydnes, 2001; Williams and Ruaia, 2019; Gruby et al., 2021). These countries historically lacked the infrastructure to exploit their pelagic resources, but instead control the total allowable fishing effort in their exclusive economic zones (EEZs) by selling vessel days to foreign fishing fleets (Bernadett, 2014; Gruby et al., 2021). This system allows small Pacific Island nations to gain economic revenue and manage their marine resources, but they often rely on the discarded catch from foreign fleets or coral reef fisheries to obtain locally derived marine protein. However, coral reef fisheries are declining across the Pacific Islands, and it is predicted that tuna resources will have to provide up to 25% of the fish consumed in the region by 2035 (Bell et al., 2009). As a result, Pacific Island nations need to improve fisheries management and develop domestic pelagic fisheries to meet the demand for food security into the future (Bell et al., 2011, 2013, 2015, 2018; Hanich et al., 2018; Wabnitz et al., 2018).
The Republic of Palau is a member country to the PNA and recently created the Palau National Marine Sanctuary (PNMS), a large marine managed area that includes a no-take marine reserve in 80% of the nation's EEZ and an area designated for the development of a domestic fishery (Cimino et al., 2019). Prior to the implementation of the PNMS in 2020, the total catch of pelagic fishes landed by foreign longline fleets operating in Palau's EEZ totaled 3601.88 metric tons in 2019, and yellowfin tuna (Thunnus albacares) comprised 64% of this catch. Additionally, Indo-Pacific blue marlin (Makaira mazara) and Indo-Pacific sailfish (Istiophorus platypterus), hereafter referred to as blue marlin and sailfish, were also commonly landed in the longline fishery with 88.6 tons of blue marlin (∼3% of the total reported catch) and 16.35 tons of sailfish (∼72% of the by-catch species) landed in Palau (Oiterong and Sisior, 2020). Historically, only low grade tuna and billfish landed by the foreign fleet were sold locally, however after the implementation of the PNMS in 2020, the foreign longline fleet moved outside Palau's EEZ. As a result, the nation experienced temporary shortages of fresh pelagic fish, but this void created an opportunity to develop a domestic fishery for pelagic species that could make Palau an independent producer of tuna resources. Yet, the question as to the extent the PNMS retains migratory pelagic fishes, such as yellowfin tuna and billfish, and its role in the management of the western and central Pacific Oceans pelagic resources remains unanswered.
Yellowfin tuna and billfish are migratory species that are capable of making long-distance movements (Humphries et al., 2010; Block et al., 2011; Carlisle et al., 2016; Lam et al., 2016, 2020). Considering their capacity to move, there is debate as to the utility of large-scale marine protected areas (LSMPAs) as management solutions for their fisheries (Fonteneau, 2007; Santo, 2013; Jones and Santo, 2016; Boerder et al., 2017; Hilborn, 2018; Curnick et al., 2020; Hilborn and Sinclair, 2021). LSMPAs, like the PNMS, have been proposed to reduce fishing mortality on pelagic species provided they are large enough and designed to incorporate the critical habitats that are necessary for reproduction and feeding (Norse et al., 2005; Game et al., 2009; Mee et al., 2017; Richardson et al., 2018; Hernández et al., 2019). However, the migratory nature of pelagic fishes presents challenges to their management, because these species frequently cross international management jurisdictions and spend significant time in the high seas (Nakamura, 1985; Rooker et al., 2019). Ultimately, information on the movements of pelagic species is needed to robustly evaluate the utility of marine reserves and the designation of fisheries management units.
Large scale conventional tagging efforts on juvenile yellowfin tuna in the western Pacific Ocean suggest that although yellowfin tuna will utilize numerous EEZs, given their fast growth and moderate rates of displacement, domestic polices such as MPAs and/or measures to protect juveniles could result in increased yield per-recruit to their surrounding fisheries (Sibert and Hampton, 2003; Leroy et al., 2015; Moore et al., 2020). However, the movements of adult yellowfin tuna in this region are a critical gap in the knowledge of this species (Moore et al., 2020) and there is a lack of information on the movements of blue marlin and sailfish in the western Pacific Ocean. To fill these knowledge gaps, we used externally attached pop-up satellite archival tags (PSATs) to monitor the movements of these species in the PNMS and the wider western Pacific Ocean. Our objectives were to describe the retention spans of these species in the PNMS, estimate the size of the areas they utilized, and the extent of their dispersal through the EEZs and management zones of the western Pacific Ocean. We provide a first look into the movements of this pelagic fish assemblage in this LSMPA and discuss these results in the context of the PNMS and fisheries management in the western and central Pacific Ocean.
Methods
Study site
The Republic of Palau is a small island nation located in the western Pacific Ocean, (7.515°N, 134.582°E) approximately 900 km east of the Philippines. Within Palau's EEZ, the PNMS is a Marine Managed Area that includes a 475 669 km2 of no-take protected area, a 105 705 km2 commercial fishing zone, and a 12 073 km2 artisanal fishing zone (Figure 1). Palau's EEZ and the waters of its neighboring countries are part of region 7 for the Western and Central Pacific Fisheries Commission's stock assessments of yellowfin tuna (WCPFC, 2020).
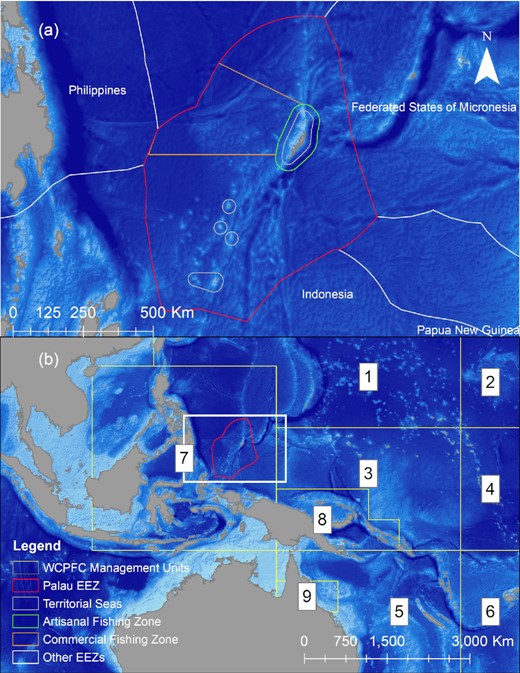
Palau's Exclusive Economic Zone (EEZ) with locations of Territorial Seas (grey polygons), Artisanal Fishing Zone (green polygon), Commercial Fishing Zone (orange polygon), the Palau National Marine Sanctuary (red polygon) and the EEZs of other western pacific nations (white polygons) indicated by colored polygons in panel A. Palau's EEZ (red polygon) and the numbered management zones (yellow polygons) that are used in the Western and Central Pacific Fisheries Management Commissions (WCPFC) stock assessments for yellowfin tuna in panel B.
Tagging of pelagic species
We worked with local fishermen to capture and tag yellowfin tuna, blue marlin, and sailfish with hook and line trolling gear in Palau's territorial waters that are encircled by the PNMS. A combination of miniPAT-348A pop-up satellite archival tags (n = 43, Wildlife Computers, Redmond, WA, USA) and X-tag pop-up satellite archival tags (n = 15, Microwave Telemetry Inc., Columbia, MD, USA) were utilized in this study. Fish tagged with MiniPAT-348A satellite tags were programmed to record daily geolocation data and depth and temperature time series data at 10-minute intervals for a period of 250 or 300 days, while X-tags were programmed with the equivalent geolocation and time series data collection intervals, but for 365-day deployments. From 2016 to 2018, both yellowfin tuna and billfish were tagged with miniPAT-348A tags alongside the boat, with a 15 cm Kevlar and heat shrink coated 300 lb monofilament tether and a large titanium dart inserted into the pterygiophores at the base of the dorsal fin. Yellowfin tuna were tagged in the pterygiophores of the 2nd dorsal fin and billfish were tagged in the pterygiophores of the dorsal fin, two dorsal spines posterior to the head. During tagging operations, yellowfin tuna were landed in a custom-built tuna sling, at which point they were measured in total length to the nearest cm, tagged, and the fish were released without removing them from the water by cutting the hook. Billfish were brought beside the boat, measured, and tagged with a 1 m tagging pole. In 2019, we added a Kevlar and heat shrink coated 10 cm keeper strap with a large Domeier dart to further secure the tag beside the fish and prevent wobbling of the tag in both species. These secondary keeper straps were inserted posterior to the tags primary anchor; however, for yellowfin tuna, we moved the tagging location of the primary anchor from the 2nd dorsal fin to the pterygiophores of the 1st dorsal fin. Finally, in 2020, yellowfin tuna were tagged with both miniPAT-348A tags and X-tags, outfitted with a bullet swivel and a figure-eight method, in which a monofilament loop was stitched through the pterygiophores of the 2nd dorsal fin (Hoolihan et al., 2014). To attach the PSAT tags in this manner, yellowfin tuna were landed in the tuna sling, brought onboard the vessel and placed in a purpose-built V-shaped tagging cradle, with a hose placed in the mouth to circulate water over their gills. The tags were then stitched into the pterygiophores of the 2nd dorsal fin with an applicator needle and secured in place with a stainless-steel crimp, anterior to the 2nd dorsal fin. The tagging set up for billfish remained the same in 2020 (i.e. miniPAT-348A tag, large titanium dart and keeper strap with Domeier dart, tagged beside the boat).
Statistical Analyses
All statistical analyses were conducted using R and values are reported as means and one standard deviation, unless otherwise stated.
Estimation of most likely geolocation
The most likely tracks of fish that were tagged with MiniPAT tags were estimated with Wildlife Computers GPE3 software using an average swim speed of 2 m per-second. The GPE3 software implements a gridded hidden Markov model based on the methods of Pedersen et al. (2011) using the tags dawn and dusk light readings, surface temperature, maximum depth as observational data, and a random walk movement model (Pedersen et al., 2011), to estimate likelihood profiles for each tagged fish (Wildlife Computers, pers. comm.). The archived light level and time series depth and temperature data from Microwave Telemetry X tags was analyzed with the package HMMoce. This analysis used the light level, temperature, and depth profiles recorded by the X tags, and a combination of oceanographic and benthic data to generate geolocation estimates with a state-space hidden Markov model and a maximum likelihood algorithm (Braun et al., 2018). These two methods provided daily estimates of the geolocation of the tagged fish in our study and their associated error.
Analysis of horizontal movement in the PNMS and the larger western and central Pacific Ocean
To analyze the horizontal movements of tagged fishes and determine the amount of time they spent within Palau's EEZ, the daily point estimates of each fish's geolocation were used in an overlap analysis with a shapefile of the Palau EEZ to evaluate their presence or absence within Palau's EEZ at a given number of days at large. We then determined the retention spans of each fish within the EEZ (i.e. the number of days elapsed between release and departure from the EEZ), grouped the fish by species and generated right censored survival curves for the two species with the survfit function in the survival package to accommodate tracks of fish that prematurely released prior to exiting Palau's EEZ. We then used Cox proportional hazards regression to model the retention of these species and tested whether there were differences in their rates of egress from Palau's EEZ. The percentage of time that each fish was protected was calculated by dividing the number of days they spent within Palau's EEZ by their total number of days at large and the linear displacement from their initial tagging location was then estimated by taking the minimum distance traveled between the tagging location and the pop-up location with the distGeo function in the package geosphere. These distances were then pooled by species and tested for relationships between days at large and displacement with a Spearman's rank-order correlation test.
To measure the spatial extent of movement and habitat utilization of each species, we pooled the geographic locations of all fish by species, calculated their kernel utilization distributions (KUD) with the kernelUD function in the adehabitatHR package and visualized them in ArcGIS 10.2 (ESRI). We then calculated KUDs for each individual fish, estimated the size of these areas with the getvolumeUD and kernel.area functions and extracted their 50 and 95% KUDs, as a measure of individual core use and total space use respectively. We then used Spearman's rank-order correlation to test for a relationship between the size of the individual 95% KUDs and number of days at large for each species. To evaluate the size of the total area used by each fish in relation to the size of the PNMS, we then divided the size of their 95% KUDs by the area of Palau's EEZ. Finally, to evaluate their space use of the surrounding EEZs, we calculated the spatial overlap between the 95% KUD of each tracked fish, the PNMS, international waters, and the surrounding EEZs of the western Pacific Ocean with the gIntersection function in the rgeos package. These overlapping areas were then converted to percentages of space use by dividing the area of overlap in each management unit with total area used by each fish.
Results
Tagging, PSAT tag performance, and data acquisition
Between August 18th, 2016, and June 16th, 2020, 39 yellowfin tuna, 18 blue marlin and 1 sailfish were tagged with miniPAT or X-tag pop-up satellite archival tags (Supplemental material 1). Yellowfin tuna ranged in size from 95 cm TL to 170 cm TL, with a mean size of 127 ± 17 cm TL. Blue marlin ranged in size from 158 cm TL to 390 cm TL, with a mean size of 248 ± 64 cm TL and the sailfish was 300 cm TL. Twenty-four yellowfin tuna were tagged with miniPAT tags with times at large ranging from 0 to 90 days. Of these fish, 7 released their tags after being too deep and likely died because of complications from the capture and tagging interaction, 2 prematurely released their tags due to pin breaks in the nosecone of the tag, 13 released their tags early due to tag shedding, 1 fish was predated upon and 1 fish's tag failed to report its data, but the tag was found washed up on the beach in the Marshall Bennett Islands, Papua New Guinea (PNG). The remaining 15 yellowfin tuna that were tagged with X-tags in this study were at large from 29 to 57 days. Of these fish, 4 released their tags early due to tag shedding and 11 tags failed to report their data. Of the 18 blue marlin that were tagged with MiniPAT tags, 4 failed to report their data and the rest remained at large for periods of 5 to 186 days, with 9 early releases due to pin breaks, 3 early releases due to tag shedding, and 2 were recaptured. Of the recaptured marlin, we were able to recover the tag from BM12 after it was caught by a commercial longline fishing vessel west of Palau, in High Seas Pocket 1. The other tag on BM16 was never recovered, but it was presumed to be recaptured in Indonesia's EEZ, as its final Argos locations were clustered on an inland village on North Sulawesi Island, Indonesia. Finally, the only miniPAT tag to complete its full deployment was attached to the sailfish, which released its tag on schedule after a 300-day deployment (Supplemental Material 1). The overall reporting rate of PSAT tags over the duration of this study was 88% (38/43) for miniPAT tags and 27% (4/15) for X-tags.
Horizontal movements of blue marlin and sailfish
Tagged blue marlin occupied the geographic area between 1°S to 11°N and 125 to 148°W and moved as far east as the East Caroline Basin and west as North Sulawesi in Indonesia (Figure 2). Few blue marlin movements were seen north of Palau's EEZ, and southerly movements occurred during the fall and winter months (Figure 3). The minimum straight-line distance traveled between tagging and pop-up locations for blue marlin ranged between 39 and 1007 km with a mean of 318 ± 318 km. However, their movements were typically more tortuous than yellowfin tuna and blue marlin often returned to similar geographic areas that they had previously occupied earlier in their tracks (Figure 4). The Spearman's rank-order correlation test indicated that there was a slightly positive correlation between minimum straight-line displacement and time at large, but this relationship was not significant (ρ = 0.22, p = 0.45). Of the 14 blue marlin that reported their data, eight left Palau's EEZ and six remained within it for the entirety of the tag deployment period. Most of the blue marlin that remained in the EEZ were tracked for short periods of time (n = 4, <10 days), however two blue marlin remained in the EEZ after being tracked for longer than 30 days, one of which (i.e. BM7) exhibited restricted movements in Palau's EEZ for up to 110 days before its tag detached due to a pin break (Figure 4). The survival analysis indicated that egress from Palau's EEZ occurred after 3 to 74 days and the median retention span of blue marlin to Palau's EEZ was 34 days (Figure 5). However, of the 8 blue marlin that left the EEZ, three returned at least once, with BM17 and BM18 leaving and re-entering Palau's EEZ two and four times, respectively, and spending an average of 59 ± 28% of their time in protected waters (Figure 6). The KUD of aggregated blue marlin tracks covered much of the western Pacific region (Figure 2) and the size of the 95% KUD areas used by individual blue marlin ranged from a minimum of 3570 km2 to a maximum of 2 895 293 km2 with a mean of 433 210 ± 768 901 km2. A significant positive correlation existed between the size of individual blue marlin 95% KUDs and days at large (ρ = 0.82, p <0.005). The areas of space use for blue marlin that were tracked for a minimum of 30 days or more (n = 8), were between 14% to 477% (122 ± 159%) of the size of Palau's EEZ and the 95% KUDs of individual blue marlin overlapped with High Seas Pocket 1 and 5 EEZs including Palau, Philippines, Indonesia, the Federated States of Micronesia (FSM) and PNG (Figure 7). Finally, the sailfish remained between 4 to 10°N and 124 to 143°W. This fish was initially retained in Palau's EEZ for a period of 20 days; however, it exited and re-entered the EEZ five times over its 300-day deployment (Figure 2). During this time, the fish occupied the EEZs of Palau, Philippines, Indonesia, FSM, and international waters of High Seas Pocket 1, but ultimately, returned to Palau numerous times and released its tag inside of Palau's EEZ, dispersing a minimum straight-line distance of 128 km between its tagging and popup locations (Figure 4). The sailfish utilized a 95% KUD area of 1 488 281 km2, which is 245% of the size of Palau's EEZ.
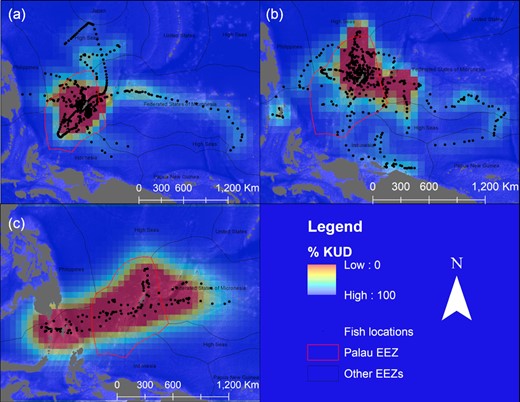
The most likely geolocations of all yellowfin tuna (a), blue marlin (b), and sailfish (c) tracked over the course of this study (black dots), with Kernel Density Distributions (KUDs) indicating the core areas of space use over the duration of their tracks overlaid on the EEZs of Palau (red polygon) and the EEZs of the surrounding countries (black polygons) in the western Pacific Ocean (the high to low utilization of these areas is represented by the color scale red–yellow–green–blue).
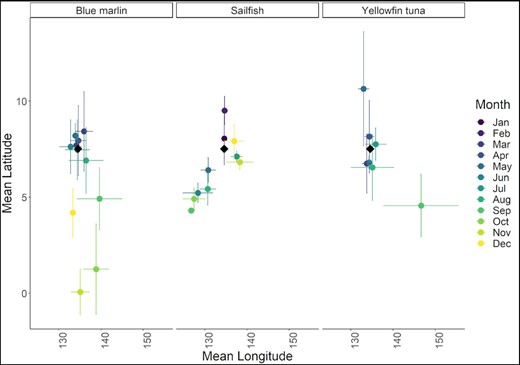
The mean latitude and longitude of most likely geolocations for blue marlin, sailfish, and yellowfin tuna over the course of this study at a given month of the year (note, the color of each dot corresponds to the month of the year, horizontal error bars represent the standard deviation in longitude, vertical error bars represent the standard deviation in latitude and the black diamonds represent the longitude and latitude of Palau.
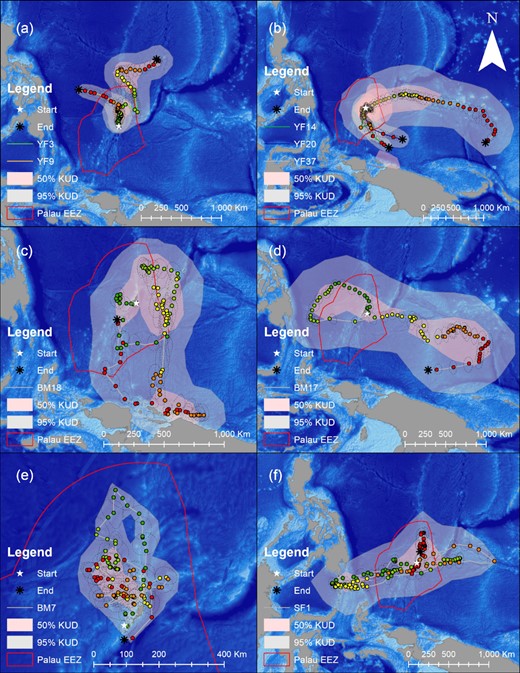
Examples of the most likely tracks for tagged yellowfin tuna (a and b), blue marlin (c, d, and e) and sailfish (f) in this study with their individual Kernel Density Distributions (KUDs) representing the spatial areas where there was a 95% (grey shading) and 50% (red shading) probability of finding the individual fish over the duration of its track (note, see Supplemental Material 1 for information on the size and track duration of each fish, the colored dots represents the fishes most likely daily locations, the color gradient of the dots follow's the duration of each fishes track from green to yellow to orange to red, the dashed black ellipse lines represent geolocation model error, white stars indicate the fishes release location, black asterixs indicate the tags popup location and the red polygon represents the boundaries of Palau's EEZ).
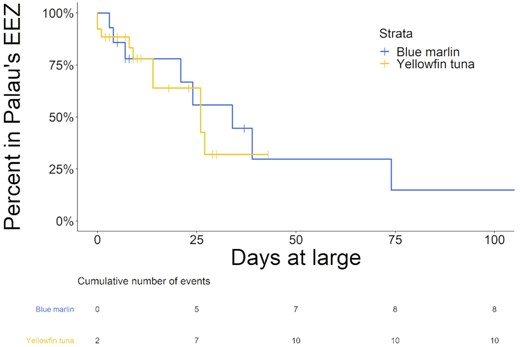
Survival curves and event tables for blue marlin and yellowfin tuna within the Palau's EEZ (note, the vertical lines on the survival curves of each species, represent points in time where individuals were censored from the analysis due the release of their tags prior to departing the Palau's EEZ).
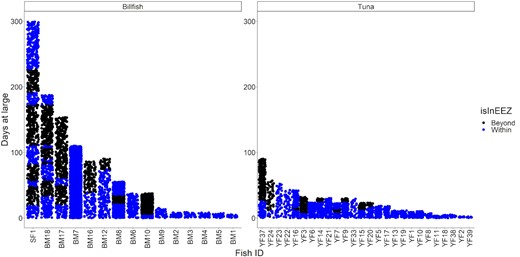
The presence and absence of billfish and yellowfin tuna in the Palau's EEZ after a given number of days at large. Blue dots indicate an observation of a tracked fish within the EEZ, black dots indicate an observation the fish when it is out of the EEZ (SF = sailfish, BM = blue marlin, and YF = yellowfin tuna, see the Supplemental Material 1 for the % of observations that are within Palau's EEZ).
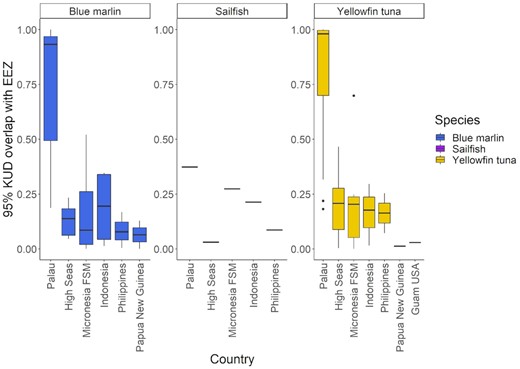
The precent overlap between the 95% Kernel Density Distributions (KUD) of blue marlin, sailfish and yellowfin tuna and the exclusive economic zones (EEZs) or international waters of the Western Pacific Ocean.
Horizontal movements of yellowfin tuna
Tagged yellowfin tuna ranged over a wide geographic area in the western Pacific Ocean between 1 to 17°N and 126 to 154°W and unlike billfish, yellowfin tuna movements were regularly observed in the waters north of Palau. Dispersal from Palau's EEZ was generally fixed in straight-line trajectories but occurred in all directions, with tagged yellowfin tuna moving as far east as Kapingamarangi Atoll in the FSM, as far west as the Philippine Trench off Northern Mindanao and as far north as the Kyushu–Palau Ridge, just south of Japan's EEZ (Figures 2 and 4). The minimum straight-line distance traveled between tagging and pop-up locations for yellowfin tuna ranged between 20 and 2011 km with a mean of 361 ± 451 km. The Spearman's rank-order correlation test indicated that there was a significant positive correlation between minimum straight-line displacement and time at large for this species (ρ = 0.54, p <0.005). We recovered data from 26 of the tagged yellowfin tuna and of these fish, 10 left the EEZ after periods of 0 to 27 days and 16 had their tracks terminated prior to documenting their egress from the EEZ over periods of 2 to 43 days at large. Of the yellowfin tuna that were tracked for longer than 20 days (n = 14), 9 (64%) left the Palaun EEZ and the median retention span of this species was 26 days. After departing Palau's EEZ, two yellowfin tuna re-entered the EEZ; however, it should be noted that our track durations for this species were insufficient to evaluate their long-term movements. Cox proportional hazards regression indicates that the retention spans of blue marlin and yellowfin tuna were not significantly different (Figure 5, p = 0.7). The KUD of aggregated yellowfin tuna tracks covered most of the western Pacific region north of Papua New Guinea, which corresponds with management units 7 and 3 of the WCPFC (Figure 2) and the areas of the 95% KUDs used by individual yellowfin tuna ranged from a minimum of 3843 km2 to a maximum of 2 744 142 km2 with a mean of 267 090 ± 562 404 km2. A significant positive correlation existed between the size of the 95% KUD and days at large for yellowfin tuna (ρ = 0.68, p <0.005) and for yellowfin tuna that were tracked for a minimum of 30 days or more (n = 8), these overall areas of space use were between 25 and 450% (115 ± 150%) of Palau's EEZ size. The 95% KUDs of individual yellowfin tuna overlapped with six EEZs and two bodies of international waters including Palau, Philippines, Indonesia, FSM, PNG, Guam (USA), High Seas Pocket 1, and the international waters north of Palau's EEZ (Figure 7).
Discussion
The results of this study provide a first look into the extent of movement for an assemblage of pelagic species in the PNMS and their connectivity to the wider western Pacific Ocean. Conventional tagging studies have shown that blue marlin are capable of crossing entire ocean basins and can undertake large scale migrations, that are well beyond the scale of dispersal we observed in our study (Orbesen et al., 2003; Ortiz et al., 2003). The furthest recorded blue marlin movements are between 14 893 and 15 744 km over periods of 3 years, however, both Ortiz et al. (2003) and Orbesen et al. (2003), reported that the majority (82.3%) of blue marlin recaptures occurred within the same geographic region in which they were initially tagged (Orbesen et al., 2003; Ortiz et al., 2003). Until the advent of PSAT technology, the movements of blue marlin between capture and re-capture events were unknown and this study provides the first description of daily blue marlin movements in the western Pacific Ocean. Our findings of limited blue marlin dispersal and return to geographic areas that had been previously occupied are consistent with the movement patterns of Atlantic blue marlin (Makaira nigricans) in the Gulf of Mexico, whose tracks were restricted to relatively small regions in the Gulf of Mexico and nonlinear (Kraus et al., 2011). In contrast, blue marlin movements in the central Pacific Ocean, where there are fewer landmasses in the seascape, were much larger in scale during El Nino years, but restricted by the incursion of the 23°C and 25°C seas surface temperature isotherms during La Niña events (Carlisle et al., 2016). Kraus et al. (2011) hypothesized that both the geographic landmasses and sea surface temperature circulation patterns in the Gulf of Mexico may have constrained marlin movement while present in this region and it is possible that a combination of the land masses southwest of Palau (i.e. the Philippines, Indonesia, and Papua New Guinea) and the temperature gradients found in the western Pacific warm pool may restrict the movements of blue marlin in this corner of the western Pacific Ocean (Bell et al., 2011).
The gonadal development and occurrence of blue marlin in the Philippine Sea suggests that this species reproduces in the northern latitudes of this region during the summer and early fall but migrates south towards the equator to presumably take advantage of improved foraging conditions during the winter (Nakamura, 1953; Shimose et al., 2005). We observed seasonal movements of blue marlin towards the equator during the winter months that are consistent with this hypothesis and these back and forth latitudinal movements are consistent with the migratory patterns of blue marlin between the Hawaiian Islands and French Polynesia (Carlisle et al., 2016). Ultimately, this species was retained within Palau's EEZ for up to 110 days and several of the blue marlin that left the protected waters of the EEZ returned to it after being at large for up to 174 days in unprotected waters (i.e. BM18), demonstrating that blue marlin can exhibit fidelity to relatively small patches of the ocean like the PNMS on the time scale of our study. However, our results also indicate that the size of the PNMS is not large enough to fully encompass their movements, as the blue marlin that we tracked for extended periods of time occupied areas that were between two and four times larger than Palau's EEZ and indeed, two of the blue marlin that we tagged in this study were recaptured by fishing operations in the EEZs and international waters that surround the PNMS.
The most recent stock assessment for blue marlin in the western and central Pacific Ocean suggests the species was fully exploited with a spawning potential ratio (SPR) of 21% and there has been a long-term decline in the spawning stocks biomass; therefore, the species is close to being overexploited (i.e. SPR < 20%) and fishing mortality should be kept at or below its current level (WCPFC, 2019). Genetic studies indicate that there is a single population of blue marlin across the Pacific Ocean (Williams et al., 2020) and the absence of genetic population structure is due to a combination of their widespread distribution and the mobility of adults and their larvae (Nakamura, 1985; Pepperell, 2000; Hyde et al., 2005). In this context, the limited dispersal of blue marlin that we observed suggest that the PNMS may reduce fishing mortality on individual blue marlin, however, given the populations basin wide connectivity, without a larger scale application of MPAs in the Pacific Ocean, fisheries management efforts should focus on ensuring the appropriate catch and effort restrictions are implemented on the region's commercial fisheries to ensure blue marlin fisheries do not become overexploited.
Although our sample size of sailfish was constrained to a single fish, there is limited data on the movements of this species in the western Pacific Ocean, and the data we present on SF1 is the longest recorded sailfish movement in the region to date. We do not discuss the movements of this fish as conclusive, but rather to add to the existing body of knowledge on the biology of this species in the western Pacific Ocean. Previous research into the movements of sailfish tagged in the waters of Taiwan indicates that these fish moved from 1050 to 1400 km over periods of 27 to 32 days and their dispersal was directed north toward Japan (Chiang et al., 2011). The spawning season of sailfish in Taiwan runs from April to September and the authors hypothesized that these latitudinal movements and the seasonal abundance of this species in Taiwan's waters is driven by reproductive migrations (Chiang et al., 2011). However, the tracking durations of these fish were truncated and the authors were unable to describe their long-term migratory patterns or determine if they exhibit fidelity to this region (Chiang et al., 2011). Our results showed that SF1 also made regular directed movements of > 1000 km, but this fish was resident to a relatively small patch of ocean 1 488 281 km2 in size. This area overlapped with the PNMS and while it was not confined within the borders of the protected area, it returned five times over the duration of its 300-day track. However, studies with larger sample sizes in the western Atlantic showed that sailfish exhibit a diversity of movement patterns including fidelity to hot spots (i.e. similar to the movements made by SF1) and widespread dispersal (Lam et al., 2016). Given our limited sample size for this species, additional research is needed to adequately describe the movements and connectivity of sailfish in Palau to the larger western Pacific region.
The long-term movements of adult yellowfin tuna have been difficult to evaluate with PSAT tags due to high rates of tag shedding, tag hardware failure, post release predation, and tagging induced mortality (Weng et al., 2009; Evans et al., 2011; Musyl et al., 2011; Hoolihan et al., 2014; Richardson et al., 2018; Lam et al., 2020). These limitations also affected the ability of our study to provide a long-term description of the movements of this species and the role the PNMS plays in their management. Nevertheless, our results represent the largest data set of adult yellowfin tuna tracks in the tropical western Pacific Ocean and build on the existing body of knowledge for this species during the adult stage of their life cycle (Evans et al., 2011; Weng et al., 2017). The widespread dispersal of yellowfin tuna that we observed throughout the western Pacific Ocean and limited residency in the PNMS contrasts with the limited dispersal of yellowfin tuna that was observed by Richardson et al. (2018) at Ascension Island. Despite the similar monitoring times of the yellowfin tuna that were tagged in these the two studies, the maximum displacement from Ascension Island was 187 km, while yellowfin tuna tagged in Palau moved distances of up to 2010 km. Yellowfin tuna movements in isolated islands throughout the tropical eastern Pacific also showed that this species can exhibit site fidelity to remote islands over extended periods of time and their movements generally do not exceed 1,852 km (Schaefer et al., 2007, 2014). These studies from the tropical eastern Pacific utilized surgically implanted archival tags, which afforded long-term tracks and demonstrate that MPAs could play a role in the management of this species (Schaefer et al., 2007, 2014). In contrast, the movements of yellowfin tuna in Palau were similar in scale to those observed in the main Hawaiian Islands, where linear displacement ranged from 872 to 2067 km and it was hypothesized that these movements may be related to optimizing opportunities for reproduction close to the islands and improved foraging conditions at convergence zones north of the Hawaiian archipelago (Lam et al., 2020). Ultimately, it appears that yellowfin tuna transition between periods of residential and migratory behavior throughout their life cycles, as some authors report wide ranging movements that are beyond the spatial limitations of LSMPAs and others report relatively restricted movements (Schaefer et al., 2007; Hoolihan et al., 2014; Richardson et al., 2018; Rooker et al., 2019; Wright et al., 2021). These snapshots of different yellowfin tuna behavior reported by various authors are likely attributed to short tracking periods and the variable spatial temporal conditions in which yellowfin tuna have been studied throughout their worldwide distribution.
A review of all tagging data and biological indicators of population connectivity suggests that the western and central Pacific yellowfin tuna stock is comprised of regionally resident populations and that the biomass from region 7 (i.e. Palauan waters) comes from self-recruitment (Rooker et al., 2016; Moore et al., 2020). This work suggests that yellowfin tuna from the western equatorial region (i.e. management units 7, 3, and 8 of the WCPFC) are locally spawned and their movements may be longitudinally restricted within this region, however, until this study there was an absence of information on the movements of yellowfin tuna during the adult stage of their life cycle (Moore et al., 2020). Although our tagging data is limited by short deployments, our results indicate that adult yellowfin tuna dispersed throughout the WCPFC management units 7 and 3, and in the case of YF37 traveled as far east as 154° longitude before turning course west back towards Palau. However, the track of YF37 and the other yellowfin tuna that we studied were not long enough to determine whether or not adult yellowfin tuna were restricted to the western equatorial region across the annual cycle and this question is key to completing our understanding of the dynamics of this species in the western Pacific Ocean.
Although there is growing evidence for regionally resident yellowfin tuna populations, the spawning biomass of yellowfin tuna is estimated across all management units of the western and central Pacific Ocean (Tremblay-Boyer et al., 2017). The most recent stock assessment for yellowfin tuna in the western and central Pacific Ocean suggests that as of 2020, the species is underexploited, but the scientific committee of the WCPFC suggests that the fishery's impact is highest in the tropical management units, including region 7 (i.e. where Palau is located) and the status of the overall stock is buffered by low exploitation rates at the temperate extents of the yellowfin tuna stocks distribution. Therefore, the scientific committee of the WCPFC recommended a reduction in fishing mortality in the tropical region where Palau is located (WCPFC, 2020). Most of the adult yellowfin tuna that were tagged in this study were retained within the PNMS for less than a month, however their tracks were terminated shortly after egress from Palau's waters and the question remains as to whether they would have returned and what proportion of their lives are spent in the protected waters of the PNMS. Furthermore, although individual yellowfin tuna may traverse the protected waters of the PNMS over short time scales, other yellowfin tuna in the stock presumably enter the PNMS creating a situation which portions of this stock are provisionally protected and its unknown whether a reduction in spatial fishing effort provided by LSMPAs could reduce the overall fishing mortality on a stock (Kaplan et al., 2014).
The conservation of pelagic fisheries is a priority for the maintenance of ecosystem function, food security and economic stability in the Pacific Islands (Bell et al., 2009). Although this research provides novel data on the movements of these species in the PNMS, there is still uncertainty surrounding the long-term movements of these species. Nevertheless, our results indicate that individuals of all three species traveled outside of the boundaries of this LSMPA and are therefore vulnerable to fisheries interactions. As a result, alongside the establishment of LSMPAs multilateral agreements to maintain sustainable levels of catch and effort in pelagic fisheries will continue to be an essential component of pelagic fisheries management. Our results highlight the need for additional research and to this aim, improvements in satellite tag technology that make the instruments smaller, more robust and attachable to pelagic fish are a priority for facilitating discovery and describing the long-term movements of these species (Lennox et al., 2018). This information would advance our understanding of the role spatial closures play in the management of pelagic fisheries, the dynamics of their populations and help direct the scientific community toward the most effective fisheries management solutions.
Data Availability Statement
The data underlying this article will be shared on reasonable request to the corresponding author.
ACKNOWLEDGEMENTS
This study was funded by the Italian Ministry for the Environment, Land and Sea, the Palau International Coral Reef Center, and the National Geographic Pristine Seas program. We thank the Palau International Coral Reef Center staff, especially Geraldine Rengiil and Elsei Tellei. We would also like to thank Natalie Arnoldi from Stanford University, the Palau Sport Fishing Association, and the staff at the Bureau of Marine Resources for the logistical support they provided to this research. We would also like to thank the help of Leeman Singeo and Keobel Sakuma (KB), their assistance and knowledge of Palau's waters and local tuna fishery were indispensable for the success of this project and we gratefully acknowledge their contributions. Finally, we would like to thank Dr. Camrin Braun for his assistance and support in learning the Rcode for HMMoce.
