


In light of the critical stock situation of the European eel a careful evaluation of management regulations is crucial. The use of minimum landing size (MLS) is a commonly adapted management measure, though it is questionable whether it can sufficiently increase escapement in order to meet management objectives, especially in a semelparous species like the European eel. In this study, a simple age-based escapement model was used in order to describe the effects of minimum landing size on escapement and yield, with particular reference to different fishing intensities for yellow and silver eels (i.e. fishing regime). Resulting model predictions show that MLS is only a suitable tool in European eel fisheries management if it is flanked by additional management measures, such as catch quotas or effort controls. It is further demonstrated that the efficiency of MLS is largely depending on the underlying fishing regime, emphasizing the need for the collection of respective data.
Introduction
The abundance of all life stages of the European eel and the annual recruitment of glass eels declined since the late 1970s (Dekker, 2003). Glass eel recruitment dropped to a minimum of ∼1% of the 1960–1979 average in the “North Sea” and 5% in the “Elswhere Europe” series (Atlantic and Mediterranean Sea). Albeit an increase in recruitment to 3.7% and 12.2%, respectively, between 2012 and 2014, it is uncertain whether this trend will prevail; thus, the stock situation remains critical (ICES, 2014a). Following the decline in recruitment the European Union passed Regulation No 1100/2007 (European Union, 2007) with the purpose of establishing measures for the recovery of the European eel stock. Member states were obligated to develop eel management plans (EMPs) to reduce anthropogenic mortalities and allow an escapement of 40% of the silver eel biomass relative to the best estimate of silver eel escapement under pristine conditions (i.e. escapement that would have existed without any anthropogenic influences at pristine recruitment). With respect to the different economic and ecological conditions among EU member states, the regulation allows considerable latitude concerning the implementation of management measures, including habitat restoration, stocking and assisted migration programmes as well as the reduction of fishing mortality.
In a critical review of the regionalization of eel management and the Swedish EMP Svedäng and Gippeth (2012) highlighted the necessity of scientific research in order to evaluate the implementation and efficiency of management measures. Thus, the translocation of eels for stocking purposes (e.g. Westin, 1998, 2003; Feunteun, 2002; Prigge et al., 2013; ICES, 2014a; Brämick et al., 2015), mortality at hydropower plants (e.g. Winter et al., 2007; Calles et al., 2010; Pedersen et al., 2012; Marohn et al., 2014; McCarthy et al., 2014) and the role of predators (mostly cormorant, e.g. Brämick and Fladung, 2006; Carpentier et al., 2009; Marzano et al., 2013; Prigge et al., 2013) have been extensively discussed in scientific literature. Yet, the evaluation of specific management measures concerning fisheries is underrepresented (Beaulton and Briand, 2007; Bevaqua et al., 2007).
The introduction or increase of minimum landing size (MLS), which restricts catches to fish above a given size limit, is a commonly adapted measure in eel fisheries management in EU member states (ICES, 2014b). The general purposes of MLS are as follows: (i) to allow fish to spawn at least once before they enter the fished population and (ii) to catch fish at an optimum size (Lopt), where growth rate and cohort biomass are maximum (Froese et al., 2008). Since successful spawners in semelparous species are by definition no longer available to fisheries, the former principle cannot be applied to the European eel. Except for Ireland and Sweden (with complete closure and 60 cm MLS, respectively), MLS typically range from ∼20 cm (e.g. 22 cm in Portugal) up to 50 cm (e.g. Poland and Germany) as summarized in the “Report of the Joint EIFAAC/ICES/GFCM Working Group on Eel” (ICES, 2014b). Thus, it is reasonable to assume that female silver eels (i.e. potential spawners), which usually mature at sizes > 45 cm (Tesch, 2003; Durif et al., 2005) are not directly protected by MLS currently in effect, whereas male silver eels, which mature at sizes < 45 cm are, in some cases, fully excluded from fisheries. While in some cases closed seasons are implemented to protect migrating silver eels, a number of member states (e.g. Germany, Portugal, Poland) essentially rely on MLS to regulate fishing mortality, though sometimes accompanied by gear restrictions or a limited number of fishing licenses. Therefore, it remains to be tested whether a fishery management policy solely based on MLS effectively increases escapement, contributes towards a maximum yield, or both.
Due to a lack of empiric data on escapement European eel fisheries management often relies on the use of population models in order to quantify spawner escapement and evaluate management objectives (Aprahamian et al., 2007; Bevaqua et al., 2007; de Leo et al., 2009; ICES, 2014b). In turn, a comprehensive analysis of the adequacy of MLS as a management measure requires a model system with reliable estimates of input parameters, such as natural and anthropogenic mortalities, stock size and eel growth. In the course of recent management requirements, a comprehensive data set is available for the German part of the Elbe River system (further referred to as Elbe River).
The aim of this study is to evaluate whether MLS is a suitable tool in European eel fisheries management. Our primary research questions were as follows: (i) to which extent escaping silver eels could be directly protected by MLS, (ii) whether MLS could standalone as a conservation measure in a semelparous species like the European eel, and (iii) how fishing regime affects the efficiency of MLS as a management measure. In order to account for relevant stakeholders (i.e. fisheries and species preservation) in local eel stocks, we investigate the effects of MLS on both, yield and silver eel escapement. Therefore we provide a conceptual study of eel fisheries management in the Elbe River based on literature data, using an age-structured cohort model.
Material and Methods
Model description
Where Ni is the number of eels in age-group i (equals number of recruits for age-group 0), Qi is the fraction of yellow eels metamorphosing into silver eels in age-group i, Ni,s is the number of silver eels in age-group i, and Ni,y is the number of yellow eels in age-group i. In the following, subscripts y and s indicate yellow and silver eels, respectively.
Where Ei is escapement from age-group i. Z is defined as the sum of natural mortality rate (M), fishing mortality rate (F), cormorant predation mortality rate (P) and hydropower mortality rate (H, not applied to yellow eels). Ri+1 is the number of recruits (natural and stocked eels) in age-group i + 1.
Population characteristics
Where Lt is the length at time t (analogue to age-group i), Linf is the mean asymptotic length, k is the growth coefficient, and t0 the theoretical age at length zero. Simon (2015) provided a detailed study on eel growth in the Elbe River based on back calculated data from otolilths. The reported values of Linf = 100.9, t0 = −0.96 and k = 0.089, currently used in stock assessment of the Elbe River, were adapted in the present study to convert age into length data.
System-specific mean weight per age-group was calculated based on the weight–length relationship W = a*Lb, where W is weight (in g) and L is length (in cm). The regression parameters a = 0.001 and b = 3.197 were derived from n = 4531 female eels from the Elbe River sampled between 1997 and 2011 (E. Fladung, unpublished data).
Model input data
All model input parameters are direct estimates from available literature data, as reported in the EMP of the Elbe River. A brief description of the procedures is given in the following [for details see Brämick et al. (2008), Fladung et al. (2012a, b) and Fladung et al. (2015)]. Parameter estimates given in percent always refer to the entity of individuals in an age-group at the beginning of the year and were transformed to mortality rates by Equation (1) (with Z being replaced by the respective mortality coefficient).
The number of stocked eels is directly adapted from official stocking statistics, while the amount of natural recruits at the Elbe estuary is an extrapolation of two elver monitoring programs in the Elbe River between 2005 and 2009. Recruitment outside the monitoring period was projected according to the decline in abundance in the time series of glass and yellow eel recruitment in European rivers (ICES, 2014b). The transition from yellow to silver eels was estimated based on samples of length frequencies of silver eels caught in the middle stretch of the Elbe River (Geesthacht, n =1172) in 2011 (Fladung et al., 2012a). A logit function increasing from 0 to 1 was used to describe the fraction of silver eel by age-group and a correction factor of 0.8 was added to achieve a better fit to empiric data (Oeberst and Fladung, 2012). According to the most recent data from monitoring programs a correction factor of 0.6 is used in the implementation of the EMP and was adopted for the presented study.
Natural mortality for female eels was calculated based on the model proposed by Bevaqua et al. (2015), incorporating mean water temperature, weight, sex and density of eels, with a mean water temperature of 11.3 °C and intermediate stock density. Hydropower mortality is highly variable and empiric data are scarce. Therefore, an average of 30% at hydropower plants (ICES, 2003) and 0.5% at cooling water abstraction sites (Rauck, 1980; Möller et al., 1991) was assumed. Based on the size of subareas with different cumulative hydropower mortalities an overall average of 24% hydropower mortality was estimated (as of 2007).
Absolute fishing mortality (i.e total catch per year) is reported in official landing statistics, estimates of absolute cormorant predation mortality were adopted from recent management reports, as described in the EMP for the Elbe river (Brämick et al., 2008). Accordingly, the amount of eels eaten by cormorants was estimated based on studies by Brämick and Fladung (2006), assessing daily food intake and the proportion of eel in the diet of cormorants based on analyses of stomach contents in the Elbe River in 2002, and Fladung (2006) assessing the duration of stay and food requirements of different cormorant sub-populations (overwintering, trans-migratory, breeding and non-breeding). Cormorant predation mortality in a given year and age-group was then extrapolated corresponding to cormorant abundance as reported in official statistics and if available additional data from ornithological institutes.
Parameter fitting and model calibration
In contrast to other model parameters only absolute values of fishing and cormorant predation mortality were available. In order to transform them to mortality rates, a best estimate of the age structure in 2010 was derived from the German eel model (GEM; Oeberst and Fladung, 2012), which is currently used in stock assessment of the Elbe River and was part of the “Pilot projects to estimate potential and actual escapement of silver eel” (POSE; Walker et al., 2011). Briefly, the GEM is an age-based BDIE-model (Birth, Deaths, Immigration, Emigration) starting with a dummy population in 1985. With known recruitment and absolute mortalities, stock size in subsequent years is calculated by addition or subtraction of the respective values. Under the assumption that eels stay in freshwater no longer than 20 years, the effect of the start population gets smaller with time and is considered negligible from 2005 onwards.
Fishing mortality rate (F) and cormorant predation mortality rate (P) were calculated by solving Equations (6) and (7) and Equations (8) and (9) based on the 2010 age-structure of the Elbe eel stock and calibrated to fit the respective total catch and losses due to cormorant predation in 2010. Since F and Pi are not independent they were calculated simultaneously (MS Excel® Solver) under the following constraints: (i) the sum of biomass in catches of all age-groups equals the reported catch in 2010, (ii) number of individuals per age-group eaten by cormorants equals the number of individuals in the respective age-group reported in the actual management calculations, assuming that cormorants show prey size selectivity (e.g. Brämick and Fladung, 2006; Skov et al., 2014), (iii) Fy = Fs, and (iv) F is equal for all eels in the fished population, assuming that fisheries are non-selective for eels above MLS (i.e. all eels >45 cm/older than 5 years in 2010). Note that the assumption of cormorant predation mortality rates (i.e. losses due to cormorant predation increase with stock size) is a simplification. In the following, hypothetical scenarios are calculated which have no or very low anthropogenic mortalities, resulting in a virtual population bigger than the 2010 stock. In turn, calculated losses due to cormorant predation exceeded the observed historic maximum. Accordingly, P was corrected by a factor of 0.84 in order to avoid overrating the influence of cormorant predation. A summary of model input parameters is given in Table 1.
Summary of model input parameters according to Brämick et al. (2008), Fladung et al. (2012a) and Fladung et al. (2015).
| Age class (i) | Recruits (n) | Length (cm) | Weight (g) | Natural mortality rate (M) | Cormorant mortality rate (P) | Hydropower mortality rate (H) | Proportion of silver eel (%) |
|---|---|---|---|---|---|---|---|
| 0 | 6.526.038 | 12.34 | 2.47 | 0.54 | 0.00 | 0.26 | 0.00 |
| 1 | 2.932.243 | 19.92 | 11.40 | 0.26 | 0.01 | 0.26 | 0.00 |
| 2 | 67.197 | 26.85 | 29.60 | 0.17 | 0.07 | 0.26 | 0.00 |
| 3 | 34.188 | 33.19 | 58.30 | 0.12 | 0.12 | 0.26 | 0.00 |
| 4 | 87.679 | 38.99 | 97.57 | 0.10 | 0.10 | 0.26 | 0.00 |
| 5 | 399 | 44.29 | 146.71 | 0.08 | 0.07 | 0.26 | 0.00 |
| 6 | 388 | 49.15 | 204.58 | 0.07 | 0.05 | 0.26 | 0.00 |
| 7 | 0 | 53.59 | 269.75 | 0.06 | 0.02 | 0.26 | 0.02 |
| 8 | 0 | 57.65 | 340.74 | 0.05 | 0.01 | 0.26 | 0.07 |
| 9 | 0 | 61.37 | 416.07 | 0.05 | 0.00 | 0.26 | 0.21 |
| 10 | 0 | 64.77 | 494.36 | 0.05 | 0.00 | 0.26 | 0.39 |
| 11 | 0 | 67.88 | 574.35 | 0.04 | 0.00 | 0.26 | 0.51 |
| 12 | 0 | 70.73 | 654.93 | 0.04 | 0.00 | 0.26 | 0.56 |
| 13 | 0 | 73.33 | 735.17 | 0.04 | 0.00 | 0.26 | 0.59 |
| 14 | 0 | 75.71 | 814.27 | 0.04 | 0.00 | 0.26 | 0.59 |
| 15 | 0 | 77.89 | 891.59 | 0.04 | 0.00 | 0.26 | 0.60 |
| 16 | 0 | 79.88 | 966.61 | 0.03 | 0.00 | 0.26 | 0.60 |
| 17 | 0 | 81.71 | 1038.94 | 0.03 | 0.00 | 0.26 | 0.60 |
| 18 | 0 | 83.38 | 1108.30 | 0.03 | 0.00 | 0.26 | 0.60 |
| 19 | 0 | 84.90 | 1174.48 | 0.03 | 0.00 | 0.26 | 0.60 |
| 20 | 0 | 86.30 | 1237.35 | 0.03 | 0.00 | 0.26 | 0.60 |
Natural mortality rate is estimated based on Bevaqua et al. (2015). Estimates for cormorant predation mortalities rate are based on Brämick and Fladung (2006) and Oeberst and Fladung (2012). Length and weight refer to the middle of the year (t + 0.5).
Effects of MLS and fishing regime
Total escapement was calculated as the sum of escapement in all age-groups and total yield was calculated as the sum of all yellow and silver eel catches in all age-groups. In order to investigate trends and patterns of different management approaches, we modelled the progression of the 2010 cohort under different (hypothetical) management scenarios including changes in MLS, fishing effort and fishing regime. Therefore, MLS was converted to age and displayed as tr (age at recruitment to the fished population) in the following. Escapement and yield was quantified for F between 0 and 1 (interval: 0.1) for all tr between 0 and 20, assuming that F is equal for yellow and silver eels. In order to account for different fishing regimes we defined three scenarios: MLSlow (tr = 0), MLSmed (tr = 6) and MLShigh (tr = 11) and calculated total yield and escapement for different Fy and Fs from 0 to 1 (interval: 0.1).
Since eels enter the Elbe River in age-groups 0–6 and no data on recruitment past 2010 was available, recruitment numbers from 2010 were added to the respective age-group for the progression of the cohort. We assumed that eels stay in freshwater for a maximum of 20 years (Tesch, 2003), thus, the model was restricted to 20 age-groups. Furthermore, male eels were excluded from the analysis since the proportion of male eels in the Elbe River is considered negligible (Fladung and Brämick, 2012). They could be however easily implemented by adding an additional branch to the model, similar to the differentiation of yellow and silver eels.
Naturally, the prediction of future eel stock development in a large river system like the Elbe is subject to numerous (often hardly quantifiable) uncertainties, which are discussed in detail below. Hence, results are presented in relative terms, i.e. escapement is given as the fraction of eels relative to escapement without any anthropogenic mortalities at actual recruitment including stocking (“potential escapement”: H = 0, F = 0), while yield is expressed as a fraction of the maximum yield at 40% escapement at current hydropower mortality (“potential MY40”: H = 0.26; tr, Fy and Fs fit to maximize yield).
Results
Parameter fitting
Fishing mortality in 2010 was calculated as F = 0.3, which corresponds to a proportion of 19% silver eels in catch. P varies from 0.01 to 0.12 (before correction) and <0.01 to 0.10 (after correction) for age-groups 1–9, with the highest and lowest mortalities in age-group 3 and 9, respectively. Potential maximum yield at 40% escapement (MY40) is achieved for tr = 10, Fy = 0 and Fs = 0.97.
Stock structure and future escapement/yield
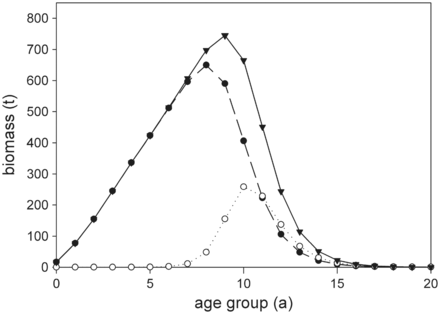
Theoretical development of the 2010 cohort biomass of European eel in the Elbe River system over 20 years. Results are based on model calculations without fishing mortality, showing total biomass per age-group (solid line, triangle), yellow eel biomass per age-group (dashed line, filled circle), and silver eel biomass per age-group (dotted line, circle).

Cumulative escapement (a) and yield (b) of the 2010 cohort in the Elbe River system for different fishing mortality rates (F) and ages at recruitment to the fishery (tr), based on equal fishing mortalities for yellow and silver eels. Results are presented as a fraction of escapement biomass without anthropogenic mortalities (i.e. hydropower and fisheries) and a fraction of the potential maximum yield at 40% of pristine escapement (i.e. escapement without anthropogenic mortalities).
Influence of fishing regime on yield/escapement
![Cumulative escapement (a, c and e) and yield (b, d and f) of the 2010 cohort in the Elbe River system for different fishing mortality rates of yellow (Fy) and silver eels (Fs) at different ages at recruitment to fisheries [tr = 0 (a and b), tr = 6 (c and d), tr = 11 (e and f)]. Results are presented as a fraction of escapement biomass without anthropogenic mortalities (i.e. hydropower and fisheries) and a fraction of the potential maximum yield at 40% of pristine escapement (i.e. escapement without anthropogenic mortalities).](https://oup.silverchair-cdn.com/oup/backfile/Content_public/Journal/icesjms/73/10/10.1093_icesjms_fsw090/3/m_fsw090f3p.gif?Expires=1749885547&Signature=K3b0wLmXBJZrEpvfmACRArw-oJQaPWD2hHElimaut-SrservrJaRHNVjgk2QZVwjodmkGE4oRdTeJ0CnSswEkD3G6sYTzB5SaKRbmxFMsOPGGtBPHN7IVhC8z~78cLwAXt-~7v4zV0lj8Sz7Na~mMTkQdjYl5Hnw2U6OH52ixlXcmxiP9ensUuW1XLyGX17~Gdokqc99HRvkiJ4Aqoo~adgfZOf6Z~miW8c~YWy6oOd-PKySaRlgxf9cHldCNxCGzaL3QE4mxNirbKvYn~Ce8Bf97EFEsJY8FYM9u~~72T2e33Q5-hkwlYUuihqUoiVgUIE2xDTiUJQPDDfhfUCg9A__&Key-Pair-Id=APKAIE5G5CRDK6RD3PGA)
Cumulative escapement (a, c and e) and yield (b, d and f) of the 2010 cohort in the Elbe River system for different fishing mortality rates of yellow (Fy) and silver eels (Fs) at different ages at recruitment to fisheries [tr = 0 (a and b), tr = 6 (c and d), tr = 11 (e and f)]. Results are presented as a fraction of escapement biomass without anthropogenic mortalities (i.e. hydropower and fisheries) and a fraction of the potential maximum yield at 40% of pristine escapement (i.e. escapement without anthropogenic mortalities).
Discussion
The aim of our study was to investigate whether MLS is a suitable tool to improve the escapement of eels, if procurable, while sustaining fisheries. Our findings clearly demonstrate that simplistic management approaches, such as solely imposing MLS, are inadequate in European eel fisheries management, especially considering that the species is semelparous. Since the rationale of implementing MLS could either be the immediate protection of potential spawners (i.e. silver eels) or fishing at an economically reasonable age/size, the two approaches are discussed separately:
If MLS were aiming at the immediate protection of silver eels, they consequently needed to be set at a level at which a sufficient proportion of silver eels (i.e. management objective of 40% of escapement under pristine conditions) escape the river system, independent of fishing effort. As indicated in Figure 2a, for the observed range of F a respective approach would require exceptionally high MLS of ∼68 cm (tr = 11), a level at which maximum yields are ∼ 84% of the potential MY40. Thus, fisheries would be rendered less profitable, though the usually higher market price of larger specimen (e.g. De Leo and Gatto, 2001) could partly compensate for the decrease in yield. In any case, this is a rather theoretical consideration and only valid if extremely effective fisheries, are possible. Given that vital population characteristics of the European eel vary considerably across its distributional range (Vøllestad, 1992; Poole and Reynolds, 1998; Lin et al., 2007), which is well reflected in a number of different growth functions published for the species (De Leo and Gatto, 1995; Poole and Reynolds, 1996; Holmgren et al., 1997; Simon, 2015), the use of MLS as a tool for the immediate protection of silver eels will largely depend on the respective system and related fisheries and should thus be evaluated case by case.
The question remains to which degree MLS contributes towards the optimization of yields and/or reducing time in the fished population. As indicated in Figure 2a and b, MLS possibly achieves both, consequently being a crucial tool in any reasonably managed (eel) fishery. For example, the recent increase of MLS in large parts of the Elbe River, from 40 to 45 cm (increase in tr from 5 to 6), at F = 0.3 results in an increase of escapement from 12% to 16% of potential escapement while yield is increased from 120% to 127% of the potential MY40. Though the increase of MLS is clearly beneficial, it is implicit in the result, that management goals are not achieved via the reduction of anthropogenic mortalities but largely depend on stocking (Brämick et al., 2008, 2015). Hence, a notable proportion of stocking material benefits fisheries or is lost at hydropower plants and it is disputable whether stocking in systems with <40% of the potential escapement will result in a net surplus production, especially against the background that eels cannot be reproduced artificially. At F = 0.3 MLS would need to be increased to at least 60 cm (tr = 9) resulting in ∼40% of potential escapement, while allowing an almost optimal yield of ∼99% of the potential MY40. In fisheries, however, it is a generic problem that the implementation of MLS as a sole management measure is susceptible to changes in fishing effort and/or efficiency, which can counteract the benefits to yield and/or stock size or, in case of the European eel, escapement. Thus, MLS as a conservation measure needs to be flanked by accessory measures, such as effort controls or catch quotas in order to ensure the desired effects. Hydropower mortality is however considered a fixed value in the presented example and it should be clearly stated that any reduction in H would have identical effects on escapement as compared to changes in F. In addition, yields would be increased for the same fishing mortalities since individuals otherwise lost to hydropower would be available to fisheries.
Studies on other fisheries for semelparous species, such as short-lived cephalopods (e.g. Loligo forbesi), mentioned that in addition to size selection (here via gear restrictions) other management measures “may be required in the foreseeable future” (Young et al., 2004, 2006). A prominent example of more comprehensive management approaches is found in semelparous species of pacific trout and salmon of the genus Oncorhynchus in USA, where a combination of MLS and closed seasons are put to use to regulate efforts in commercial, artisanal and recreational fisheries.
A distinct feature of eel fisheries is that, depending on season and applied fishing gear, they predominantly target yellow or silver eels. Therefore, a comprehensive management approach has to consider differences in fishing mortality of the respective life stage (further referred to as fishing regime). The presented scenarios highlight that yield for a given escapement (and vice versa) varies considerably for different fishing regimes. This is particularly pronounced without MLS, since yellow eel fisheries target more abundant smaller individuals (below the maximum population growth rate, Figure 1), while silver eel fisheries by definition target larger specimen. With increasing MLS, yellow eel catches are shifted towards larger specimen. Accordingly, fewer individuals are caught and the impact on silver eel abundance and escapement is reduced. At high MLS, fisheries target age-groups where the abundance of yellow and silver eels is almost identical, thus, escapement and yield are barely sensitive to changes in the fishing regime. Since MLS exceeds the maximum population growth rate, yields are however reduced.
Comparable studies are scarce; yet, few are available investigating the combined effects of fishing regime and MLS on yield in the European eel. In a study on eel fisheries in the Valli di Comacchio lagoon, Gatto et al. (1982) concluded that gross benefit in harvested biomass is optimal if only higher age classes of yellow eels were fished. Vøllestad (1990) found that in the Imsa River, where 100% of silver eels were caught, yellow eel fisheries had a negative effect on yield. This trend was however reversed with decreasing silver eel catch efficiency and increasing MLS. These findings are in line with our results, though we found the magnitude to which yellow eel fisheries positively affect yield (at higher MLS and/or lower Fs) to be higher, likely due to the implementation of hydropower and cormorant predation mortality in our model, which compete with fisheries. In summary, MLS are particularly important in yellow eel dominated fisheries in order to optimize yield and reduce the impact of fisheries on escapement. Hence, detailed knowledge on fishing regime is an important factor for management decisions. Given the less decisive character of fishing regime at high MLS, it could prove an interesting management opportunity in the absence of reliable data on yellow and silver eel fishing.
In the context of often large uncertainties or limited availability of habitat specific population data for the European eel, the presented model was designed to provide a conceptual view on the impact of potential management measures, with the distinct advantage of being independent of future recruitment. Therefore, simplifications were made which restrict the model’s capability in the prediction of absolute yield or escapement. In particular, an age-based approach requires the transformation of age-data to length-based data, which is problematic since eels often show considerable plasticity in body growth (De Leo and Gatto, 1995; Melià et al., 2006); However, the variability in the growth function adapted for this study was within acceptable limits (Simon, 2015) and it has been demonstrated that under these circumstances age-based models can provide robust estimates (e.g. Prigge et al., 2013). Conclusively, an age-structured model was the best fit with respect to the available data. Nonetheless, age- and length structured models (e.g. Aprahamian et al., 2007; Bevaqua et al., 2007) provide a more realistic approach and should be preferred if the necessary input data are available, though they are often based on the assumption of genetically determined growth trajectories which possibly change with environmental factors (e.g. Panfili et al., 1994), thus, introducing new uncertainties.
Further assumptions were necessary for the estimation mortality rates. While the availability of data on natural mortality is a generic problem in eel population dynamics, the model by Bevaqua is considered the best available estimate, yet it is desirable to generate system specific data if possible. The same accounts for data on hydropower mortality which is usually scarce and difficult to obtain. By reporting the results in relative terms, the impact of uncertainties in mortalities (except hydropower mortality) was minimized, since the respective reference values were subject to the same sources of error as the model output.
In conclusion, the results of our study demonstrate that a fishery management policy solely based on the application of MLS is not sufficient to guarantee sufficient spawner escapement. It is thus imperative that more comprehensive management approaches are needed and MLS is accompanied by additional measures, such as catch quotas or effort controls. The presented model pinpoints opportunities to address both, economic needs and species preservation, and highlights the necessity of reliable data on the fishing regime in order to establish appropriate management plans.
Acknowledgements
We would like to thank Erik Fladung from the Institute of Inland fisheries in Potsdam-Sacrow for providing detailed data on fisheries and stock assessment in the Elbe River. We also thank Lasse Marohn, Klaus Wysujack, and Ulrike Kammann from the Thünen-Instute of Fisheries Ecology for providing insightful comments on the manuscript and encouraging our work. Special thanks to Dietrich Schnack, for sharing his expertise and offering valuable food for thought throughout the study.
References
