


Abstract
The European eel stock has declined significantly since the 1980s, and the Eel Recovery Plan of the European Commission requires Member States to develop river basin Eel Management Plans (EMPs) that will achieve an escapement of silver eels that equals or exceeds 40% of the escapement biomass that would be produced in the absence of human activities. However, because silver eel escapement is not quantified within the UK, a modelling approach is required to estimate potential and actual escapement, and to assess the likely effects of management measures. We focus on two approaches developed in the UK, the Reference Condition Model (RCM) and the Scenario-based Model for Eel Populations (SMEP), and illustrate how such approaches can be used in EMPs using selected data from the River Severn. The RCM results indicate that the yellow eel population in the River Severn basin may be just 30–40% of the potential density indicated by reference conditions derived from a selection of rivers between the late 1970s and the early 1980s. The challenges of applying a model designed to be as realistic of eel production as possible, and the limited data on natural eel habitat and eel production in the Severn, preclude a SMEP analysis similar to that of the RCM, but simulations based on a simplified basin description and eel survey data from the early 1980s illustrate the potential of this model to assess compliance and test management scenarios.Aprahamian, M. W., Walker, A. M., Williams, B., Bark, A., and Knights, B. 2007. On the application of models of European eel (Anguilla anguilla) production and escapement to the development of Eel Management Plans: the River Severn. – ICES Journal of Marine Science, 64: 1472–1482.
Introduction
Recent recruitment of the glass eel stage of the European eel (Anguilla anguilla) has fallen on average to <5% of the peak levels of the late 1970s and early 1980s (measured Europe-wide) (Dekker et al., 2007), and ICES continues to advise that the stock is outside safe biological limits and that current fisheries are not sustainable (ICES, 2006). As a consequence, the European Commission has agreed an Eel Recovery Plan (ERP), the aim of which is to return the European eel stock to sustainable levels of adult abundance and glass eel recruitment.
The most recent molecular genetic evidence supports the hypothesis of a single panmictic eel stock within European waters (Dannewitz et al., 2005). Therefore, each Member State is expected to establish Eel Management Plans (EMPs) by which to achieve an escapement of silver eel biomass that equals or exceeds 40% of the potential escapement that would be produced in the absence of anthropogenic influences affecting the fishing area or the stock. It is anticipated that the EMPs will be developed at the River Basin District (RBD) level. Consequently, Member States are required to (i) set management targets based on an assessment of potential silver eel production for each RBD, (ii) assess the present day silver eel production in relation to this target (i.e. assess compliance), (iii) take the management actions necessary to achieve or maintain compliance, and (iv) collect data sufficient to support steps (i)–(iii) and to demonstrate whether compliance will be achieved in the future, i.e. that the measures described in the EMP are having the desired effect.
Eels are common to most river basins in England and Wales (Maitland, 2004). However, because silver eel escapement is not measured from any river in England and Wales, a modelling approach is required to estimate potential and actual escapement, and to assess the likely effects of management measures. Here, we focus on two approaches that have been developed in the UK: the Reference Condition Model (RCM: reported here) and the Scenario-based Model for Eel Populations [SMEP: developed for the Department for Environment, Food and Rural Affairs (Defra) by El-Hosaini, Bark, Knights, Williams (Kings College, London) and Kirkwood (Imperial College, London)]. We illustrate how these approaches can be applied in the EMP process to inform steps (i)–(iii) above, and their data requirements, for the River Severn basin. We stress that both models are still under development, so the results presented here must not be considered a definitive assessment of eel production from the River Severn. Moreover, the basin described for the SMEP simulation is derived from a subset of the Severn tributaries with eel population data, so the results of those simulations are not comparable with those of the RCM.
Material and methods
The River Severn and its eel population
The River Severn basin (∼10 000 km2) drains a large part of the English Midlands, which include large urban centres, and mid-Wales, which is predominantly rural in character. The main river flows 350 km to its estuary downstream of Gloucester, where it widens into the Bristol Channel (Figure 1). The funnel shape of the estuary, the high tidal range (13.2 m mean spring) and its southwesterly orientation all combine to promote strong recruitment of glass eels (Bark et al., 2007).
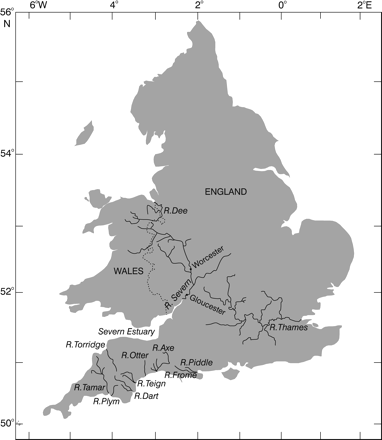
Map of England and Wales showing the rivers referred to (Dee, Severn, including its estuary, Otter, Tamar, Axe, Teign, Plym, Torridge, Dart, Frome, Piddle, and Thames).
Eel migration through the basin is hindered by major weirs upstream from a weir at the tidal limit, and in many tributaries by old mills (White and Knights, 1997). The river has also been managed extensively to control flooding, particularly in the lower and tidal reaches where low-lying land has been reclaimed for agriculture, and flood-control tidal flaps constructed since the 1950s in the marshes and creeks bordering the estuary may have reduced access for young eels.
The Severn estuary supports the largest fishery for glass eels in the UK, with 402 licensed dipnets operating in 2005. Although catch data are not available for the Severn estuary alone, it is assumed that the trend in catch per unit effort (cpue) for UK glass eel catches reflects the trend for the fishery in the Severn estuary. UK annual catches of glass eels/elvers over the past three decades have varied greatly (4–100 t year−1: Peter Wood, UK Glass Eels, pers. comm.), but according to government agency estimates and catch returns, they have declined by around 85% since the 1980s. The declared catch for the River Severn in 2005 was 500 kg of glass eels. However, the catch data for all life stages of eels declared to the UK Environment Agency are unreliable (Knights et al., 2001). In recent years, HM Customs and Excise net export data suggest that the declared glass eel catch has been under-reported by a factor of between 3.4 and ∼15 times, and that the true annual catch of glass eel is in the region of 10 t (ICES, 2006). Similarly, although the declared catches of yellow and silver eels in the Severn in 2005 were 1125 and 120 kg, respectively, from 121 licensed instruments, it is estimated that official catch returns underestimate the true combined catch of yellow and silver eel by a factor of 2.4–7.2 times (2002–2004 data; ICES, 2006).
Comparison of eel-specific survey data from tributaries joining the lower Severn, downstream of Worcester (Figure 1), undertaken in the early 1980s (Aprahamian, 1986, 1988), late 1990s (Knights et al., 2001), and from 2002 to 2004 (Bark et al., 2007) suggest no significant changes in the eel population in terms of their distribution, mean density, or mean biomass, nor in size structure (Aprahamian, 2000; Bark et al., 2007). No time-series data are available for the eel population in the middle or upper parts of the basin.
Reference Condition Model


![The relationship between eel density [y in Equation (1)] and distance upstream from tidal influence [x in Equation (1)] in 12 catchments in England and Wales (data from Knights et al., 2001; Ibbotson et al., 2002).](https://oup.silverchair-cdn.com/oup/backfile/Content_public/Journal/icesjms/64/7/10.1093_icesjms_fsm131/1/m_fsm13102.gif?Expires=1749847054&Signature=xDrBe98TD873Or5TPzKooZFfUdBbaHIuUgX~pMoNXSYSWHcYjNLPR5YtGerau51gOOiEl80Gxvu9O3OhGBEYtnUfTjjmI2EymOuFZXvYIt4ky2A2wEiijy-r1cU4YMDN6qi1eqRwIozMHHsE6JDPLliZG749r9vOaR7GtncZBxe4DNNrHKt1p0lyRIscTwjU-~LT8HjI5ypLIDNt9R6rdtv6Ri80dDqVwdkJc8qyFXL13hCwVhAGZuQkV0g07y2nF481KS0NuwEKMuZtDP2K-PqVRX3p0OkaV8ZsBGV-XadtuA9HNcicN0XUgsEmGEsMlsG7Afmcx1m7tNpmO043gA__&Key-Pair-Id=APKAIE5G5CRDK6RD3PGA)
The relationship between eel density [y in Equation (1)] and distance upstream from tidal influence [x in Equation (1)] in 12 catchments in England and Wales (data from Knights et al., 2001; Ibbotson et al., 2002).
![The relationship between the rate of decline in eel density [b in Equation (2)] and catchment gradient [g in Equation (2)] in 12 catchments in England and Wales.](https://oup.silverchair-cdn.com/oup/backfile/Content_public/Journal/icesjms/64/7/10.1093_icesjms_fsm131/1/m_fsm13103.gif?Expires=1749847054&Signature=n1AfdkNsXNUFrFQyjXWcHojkQI5LTrr5R9vKiuZdbPYZHijvGb2Tw6OiRmTkDHXXfRPwa8eXnQtviCVEwv0~IeWAFDm5iGPACpBC06cNNbWwxmhWxv~e-P1veKxo2ew7X0YJHLAt3MKHqTSzIo6VrHe02JeOS373rWz8wRwKnbzHD6nqG8wphk5NRSrq~LA9kYIEa0G2uz-MTjX4E-SXytrThqczyAllGOf5oq99D6TGKH56a63zVsa5BROBU~b2YKquv1U01YgHCgTRr4jfu6jiMiWf0KFEmrz4k9P3znPGvHYxGyoVFcUKGRGjqHOnNuJkSu95izMEeyJFPtGq~w__&Key-Pair-Id=APKAIE5G5CRDK6RD3PGA)
The relationship between the rate of decline in eel density [b in Equation (2)] and catchment gradient [g in Equation (2)] in 12 catchments in England and Wales.
Most of the data on eel density originate from surveys undertaken in the late 1970s and early 1980s, before the resident UK eel populations would have been affected significantly by the decline in glass eel recruitment from the early 1980s (ICES, 2006). Therefore, the decline [Equation (2)] can be used to predict the rate of decline of eel density with distance upstream for comparable basins, and to set a reference condition against which to compare current stocks. However, the reference dataset reflects the influences of exploitation and other anthropogenic influences acting on eel production in the late 1970s and early 1980s, and particularly the likely effects of barriers to migration and poor water quality. Therefore, the contemporary stock level does not represent pristine conditions; that is why we use the term reference condition to refer to this baseline period (as required by the EU Regulation).
As the RCM is based on density, further developments are required to meet the need to set escapement targets on biomass. It does provide, though, a simple approach to assessing yellow eel population density, and its data requirements are relative small. However, its simplicity comes at a price, because it can only provide a proxy indicator to silver eel escapement and cannot be used to simulate the effects of management measures or compare their relative contributions to eel enhancement. Assessment of silver eel escapement based on yellow eel production and the testing of management scenarios are goals of the SMEP development programme (see below).
Scenario-based Model for Eel Populations
The SMEP was developed for the UK's Defra, and further development is being supported by the Environment Agency. It is a much more complex model than RCM, and it was developed to provide a tool that can trace the dynamics of the species. To do so, it includes features that are not often included in population dynamics models applied to many other species (e.g. density-dependence at older ages, spatially disaggregated simulation of dynamics), all of which, however, might be of importance in the description of an eel's life cycle. The SMEP uses an age- and length-structured population dynamics model to simulate the estuarine/fresh-water phase of eel production in the UK. It is applied at a basin scale, and can incorporate both the biological characteristics of eel production (e.g. growth, natural mortality, sexual differentiation, maturation, and migration) and a number of potential anthropogenic influences (e.g. habitat quality, fishing, barriers, and stocking). The basin is defined as a series of adjoining reaches, with the productive area of each reach defined separately. The population is modelled as sexually undifferentiated eels, male and female yellow eels, and male and female silver eels. The model requires parameter values to describe the processes of growth, natural mortality, and maturation, along with values to describe the length–weight relationship and other forms of mortality. Such information is normally required to apply an age/length-structured model to simulate the dynamics of a population (Quinn and Deriso, 1999). However, modelling an eel's life cycle can become more complex if one needs to simulate features like the effects of density on processes such as sex differentiation, maturation, and movement. To capture those features, the SMEP also requires an indicator of the biomass of eels at which density-dependent effects are observed (after De Leo and Gatto, 1996; Feunteun et al., 2003; Acou et al., 2005; Davey and Jellyman, 2005). Moreover, because so little is known about the relationship between spawning stock and recruitment, the description of eel dynamics requires less conventional approaches (i.e. stock–recruitment relationships) than those applied to many other species for which information on the full life cycle is available. In this case, information on recruitment has to be derived from sources other than the size of the spawning stock, and is provided as an input, both quantitatively in terms of the maximum numbers of recruits, and qualitatively as trends in recruitment variation.
The SMEP allows a user to specify the structure of the population at the beginning of the calculations (e.g. based on survey data characterizing the status of the population) or only to provide annual recruitment values and to calculate the population under equilibrium. The model offers a range of outputs describing eel production per stage and per reach, including density, biomass, length frequency distributions, and sex ratios.
The increase in realism in the simulation of population dynamics that SMEP offers does come at a cost in terms of data requirements (high), increased uncertainty, and the need to translate knowledge into quantitative formulae. Here, we apply this version of the SMEP to eel population data from the early 1980s for a subset of tributaries in the Severn basin, to demonstrate the challenges and limitations faced when applying such a model to practical questions.
The reaches defined for the SMEP simulation are illustrated in Figure 4, and were selected to reflect areas of similar habitat type and the availability of suitable eel survey data. Reach wetted area is the product of length and mean width: length was expressed as the total stream length for all watercourses within the reach zone, and mean width was estimated either from survey site data or measurements from digital maps. The parameter values used to describe the biological processes are presented in Table 1, and were derived from data collected for the Severn or other eel populations from England and Wales, or taken from the literature, as described briefly later.
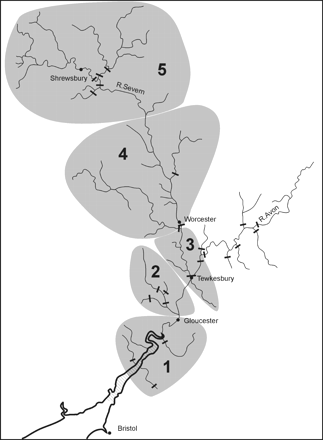
Map of the Severn catchment, indicating the reaches defined for the SMEP modelling (grey shading). Black bars represent major migration obstacles.
Eel production parameter values used in SMEP simulations.
| Process/parameter | Value | Source |
|---|---|---|
| Growth | ||
| L∞ for females (mm) | 895 | Survey data 1983, 1984 |
| k for females | 0.057 | Survey data 1983, 1984 |
| L∞ for males and undifferentiates (mm) | 363 | Survey data 1983, 1984 |
| k for males and undifferentiates | 0.0109 | Survey data 1983, 1984 |
| Reference biomass for density-dependence (g m−2) | ||
| Sensitivity analyses | 6.5–52 | Survey data 1983–1997 |
| Scenario simulations | 26 | |
| Sexual differentiation | ||
| Length at differentiation (mm) | 250 | Survey data 1983 |
| Ogive inflection and slope | 0.5; 1 | After Lobón-Cerviá et al. (1995) and Acou et al. (in press) |
| Natural mortality | ||
| Gamma for Weibull distribution | 0.2 | After De Leo and Gatto (1995) |
| Maturation | ||
| Inflection parameter for females (mm) | 458 | Survey data 1983, 1984 |
| Inflection parameter for males (mm) | 322 | Survey data 1983, 1984 |
| Curve parameter for both sexes | 1 000 | – |
| Migration | ||
| Rate for undifferentiates and yellow eels (km year−1) | 30 | Aprahamian (1988) |
| Tendency of undifferentiates to move upstream | 100% | See text |
| Tendency of yellows to move upstream | 80% | See text |
| Tendency of silver eels to move downstream | 100% | See text |
| Length/weight | ||
| α | 5.00 × 10⁻⁷ | Aprahamian (1986, 1988), Knights et al. (2001), and Bark et al. (2007) |
| β | 3.1906 | |
| Number of settlers | ||
| Sensitivity analyses | 103–1013 | – |
| Scenario testing | 6 × 10⁶ | – |
| Length at settlement | 60 mm | Survey data 1983 |
The reference biomass, the saturation level for density-dependent effects, was set at 26 g m−2, because this was the maximum biomass of yellow eels reported for lower Severn tributaries in 1983 and 1984 (Aprahamian, 2000). We derived von Bertalanffy growth coefficients for male and female eels, using Ford–Walford plots, from length-at-age data for yellow and silver eels collected from the Severn during 1983 and 1984 (Aprahamian, 1988). Although the model allows a user to define separate growth curves for eels at densities close to and far below saturation levels, no such data were available for eels in the Severn. Therefore, the simulations presented here do not take account of the possible influence of density-dependence on growth rates.
No information has been published on length-at-sex differentiation (Ldiff) of eels in the River Severn. However, our analysis of data held by the Environment Agency for Severn eels from 1983 and 1984 revealed that the minimum length class at which the proportion of differentiated eels exceeded 0.5 was 270 mm (10 mm intervals). We applied a value for Ldiff of 250 mm here, based on the 50-mm length class boundary used by the current parameterization of the model. The influence of density-dependence on sex differentiation was represented by a linear, negative relationship between density and the proportion of females, and was based on the proportions of female eels produced in French and Spanish river populations of relatively high and low densities (Lobón-Cervía et al., 1995; Acou et al., in press).
Natural mortality was modelled as a Weibull distribution, with a gamma value of 0.2 that produces a length-based probability distribution for mortality similar in form to the inverse of annual survival of Commachio eels as a function of age (De Leo and Gatto, 1995), but here reflecting the assumption that mortality rate decreases exponentially with an increase in length (De Leo and Gatto, 1996). As with growth, density-dependent effects on mortality can be incorporated in the SMEP, but in the absence of data describing this relationship, such effects were not simulated in the models presented here.
Maturation, or the transformation from the yellow to the silver eel stage, can be simulated by the SMEP separately for males and females, according to a logistic model based on fish length, allowing for an increasing probability that a yellow eel will mature with increasing length (De Leo and Gatto, 1995). Appropriate probability distributions for the Severn eel male and female populations are not available. For this reason, we simplified the simulation by assuming a stepwise maturation process, with threshold lengths-at-maturation set according to the mean lengths of male and female silver eels (322 and 458 mm), which we derived from Environment Agency data for Severn eels sampled in 1983 and 1984.
A migration rate for undifferentiated and yellow eels of 30 km year−1 was applied, based on estimates for the Severn eel population (Aprahamian, 1988). It was assumed that undifferentiated eels would tend to disperse upstream, given both the natural diffusive upstream dispersal and density-dependent migration elements proposed by Ibbotson et al. (2002) and Feunteun et al. (2003), but that differentiated yellow eels might move in either direction, though tending more towards dispersal upstream. We were unable to find any source-to-estuary measures of downstream migration rates for silver eels in the scientific literature, but tracking over a few days of actively migrating silver eels in the River Mosel, Germany, indicated average speeds of 0.3–1.2 m s−1 (Behrmann-Godel and Eckmann, 2003). At that speed, unhindered downstream-migrating silver eels in the Severn basin would be expected to reach the estuary within a maximum of 25 d. In its current form, the model cannot simulate such rapid movements because it uses a 3-month time-step and only allows eels to move one reach per time-step. Consequently, in our parameterization, silver eels from the most upstream reach will not emigrate from the system until the year after they mature. There is some biological precedence for using such a time-delay, however, because Feunteun et al. (2000) estimated that just 20% of silver eels sampled within 15 km of the tidal influence in the River Fremur, France, emigrated in the same year as they matured.
Sensitivity analyses
It is apparent from the above that application of the SMEP is only possible with the use of a number of assumptions about eel-production processes for which our understanding is limited. For example, density-dependence could influence different aspects of the biology and behaviour of eels, but there is limited information from which to derive appropriate formulae. Similarly, the level of settlement of elvers is a key process in determining the number of eels that support the population of yellow and silver eels described by the model, but limited knowledge is available to describe that process quantitatively. A way to gain an insight into how important it is to increase the accuracy in the description of those processes is to vary model parameters or assumptions and to examine the sensitivity of the model outputs to the variations. For this reason, we have conducted sensitivity analyses focusing on those two processes. Starting from a basin with no eels, we conducted simulations either varying the levels of settlement of elvers or the reference biomass for density-dependence to test the effects of the processes on modelled silver eel production. These sensitivity runs are just a small contribution to the exploratory analysis that would be required to cover all aspects of uncertainty in the SMEP. However, they do provide a flavour of the work required if we were to adopt the use of a model such as SMEP to provide management advice for eels.
Management scenario testing
The initial population for simulations to demonstrate the effects of management scenarios was based on descriptions of yellow eel populations in tributaries of reaches 1–3 in 1983: few or no data were available on eel populations in tributaries of reaches 4 and 5 then. Mean density, proportion of females, and length-frequency distribution were derived for each reach from data pooled for survey sites within tributaries, and weighted according to the relative wetted surface area of each tributary compared with the total wetted area of the reach.
In the absence of quantitative data on recruitment to the Severn eel population, as is the case for all UK eel populations, we had to make assumptions about annual recruitment. The default assumption was that the recruitment remains constant in all years of the calculations. The quantity of elver settlement was then chosen such that it would result in the same number of silver eels as that which the model predicted would have been produced in 1 year by the yellow eel population of reaches 1–3 in 1983 (see below).
Forward projections were conducted from the baseline 1983 population using the recruitment level derived above, assuming either (i) no change in recruitment of elvers to the Severn from the 1980s to now, as suggested by various authors (Aprahamian, 2000; Knights et al., 2001; Bark et al., 2007), or (ii) an 85% decline in recruitment over 20 years based on the trend in UK government agency estimates and catch returns on glass eels (ICES, 2006). In the absence of significant fisheries exploitation limiting eel production in a basin, and given the relatively low level of glass eel recruitment and the likely enormous expense and extended time-scale associated with mitigating the impacts of barriers to eel migration, stocking may be one of the most effective methods to increase silver eel production in the medium term (5–15 years). Therefore, we used the SMEP to simulate the effects of annual stocking with 500 000 elvers in reaches 2 or 4 over a further period of 20 years. Those two reaches were chosen to illustrate the relative effects of stocking in more downstream areas with higher densities of eel vs. areas farther upstream in the basin, where the density of eel was expected to be lower.
Results
RCM: setting targets and assessing compliance
The gradient of the Severn catchment from tide to source (Ordnance Survey map data) is 0.0022, and from Equation (2), the predicted rate of decline in eel density was 0.035 (95% CL: 0.0311, 0.0396) eels km–1 (Figure 5). By comparison, the observed rate of decline based on eel-specific surveys from tributaries throughout the basin in 1983 and 1984 was 0.086 eels km–1 (Aprahamian, 1986, 1988). Therefore, the RCM model predicts that the Severn eel population in the early 1980s declined faster with distance from the tidal influence than would be expected under the reference condition. Comparison of the observed situation with that estimated under reference conditions (Figure 5: area under the curve) suggests that yellow eel production from the Severn represented about 41% (95% CL: 35.4%, 46.2%) of potential production in density terms under reference conditions.
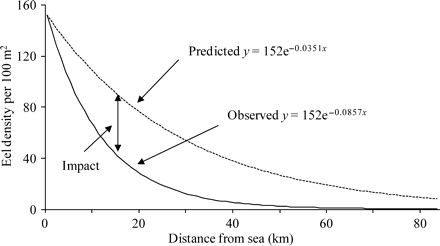
River Severn eel population: the RCM predicted (dotted line) and observed (1983/1984) rate of decline in eel density (black line) with distance upstream from tidal waters (after ICES, 2003).
Given that catch data/abundance indices suggest no significant change in the yellow eel population of the lower to middle parts of the catchment from the early 1980s to today (Aprahamian, 1986, 1988; Knights et al., 2001; Bark et al., 2007), and assuming that the density of settled eels at the tidal limit has remained constant (152 eels 100 m–2; after Ibbotson et al., 2002), and that there has been no change in the productive potential of the habitat, several authors (Aprahamian, 1986, 1988; Knights et al., 2001; Bark et al., 2007) have suggested that yellow eel production in the River Severn today is similar to that in the early 1980s. If their belief is correct, and if the relative production estimate of the RCM is weighted according to the amount of habitat available to eels at various distances from the tidal limit [Equation (3)], then present output is estimated at 34% (95% CL: 28%, 40%) of the reference condition derived from the 12 rivers.
Scenario-based Model for Eel Populations
Sensitivity analyses
The simulated relationship between the number of settled elvers (recruitment) and the absolute and relative production of male and female silver eels is illustrated in Figure 6. Female production increases rapidly between settlement levels from 103 to 107, but shows little further increase, to 1010, and declines rapidly at greater levels of settlement, because density-dependent effects on sexual differentiation produce an all-male population. Similarly, density-dependence limits the production of male silver eels at lesser levels of settlement, leading to female-dominated production. The sex ratio reaches unity at around 6 × 10⁶. The assumption used for this calculation was that density-dependence influences sex differentiation, but does not impose limits on the maximum number of eels, leading to a continuous increase in male silver eel production, as shown in Figure 6. Although this is a simplification, the assumption is not expected to affect the predictions as long as the population size remains small, which is appropriate for present-day populations but may not be appropriate for simulating populations under historical, reference conditions of greater recruitment, as required by the Recovery Plan.
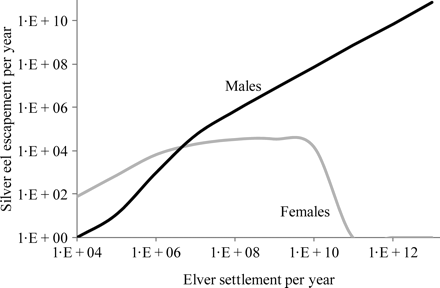
Variation in male and female silver eel escapement (numbers) under the conditions of stable equilibrium, simulated by the SMEP with increasing levels of elver settlement.
The effect of varying the relative influence of density-dependence on production of silver eels is illustrated in Figure 7 as the numbers of male and female silver eels produced by a population under stable equilibrium conditions with fixed annual settlement (6 × 10⁶), but with saturation biomass ranging from 6.5 to 104 g m–2. As expected, males dominate the silver eel population when the saturation biomass is low, whereas females dominate at higher levels of saturation. However, the total number of silver eels varies little across the range of saturation levels because, under the current SMEP parameterization, density-dependence acts primarily on sexual differentiation.
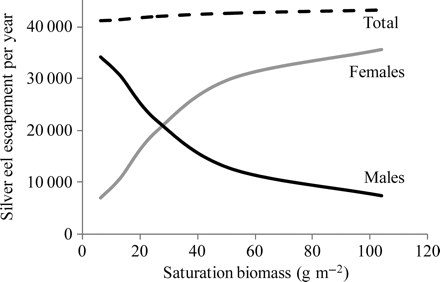
Relative production (numbers) of male, female, and all silver eels under conditions of stable equilibrium, simulated by the SMEP for a fixed elver settlement of 6 × 10⁶ but varying levels of saturation biomass.
Comparison of the distributions of undifferentiated and differentiated yellow eels across the five reaches in the basin at different levels of settlement illustrates the importance of density-dependence in dispersing eels upstream through the basin (in the model). Even after 50 years, undifferentiated and differentiated yellow eels are limited to the first two and three reaches, respectively, at an annual settlement of 106 elvers and a saturation biomass of 26 g m–2, and the basin is not fully utilized by eels until settlement exceeds 107 elvers (Figure 8). Clearly, the current parameterization of yellow eel migration in the SMEP does not represent reality particularly well, because observations indicate a more widespread distribution of eels than suggested by the model.
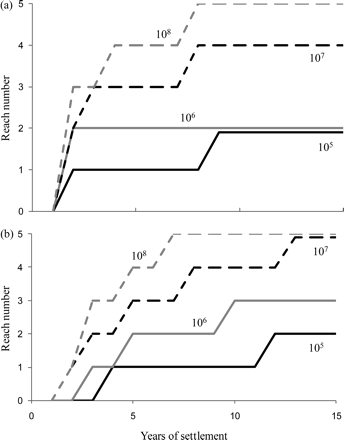
SMEP simulations of the progressive, upstream dispersal over time of (a) undifferentiated, and (b) differentiated yellow eels through reaches 1–5 in the study basin under levels of annual elver settlement varying from 105 to 108.
Scenario testing
According to the SMEP, a stable equilibrium settlement level of 9 million elvers year−1 would result in annual silver eel production similar to that estimated by the SMEP for 1984 from the yellow eel population in reaches 1–3, based on the survey data from 1983. Therefore, the model was run starting with the data on yellow eels from the 1983 survey, and the population was projected forward assuming a stable settlement level of 9 million elvers. Silver eel production declined rapidly after the first year and for the next 4 years of the simulation, before increasing again to reach >98% of equilibrium output by year 20 (Figure 9a). This trend suggests that the younger eel component in the population at the start of the simulation was not sufficiently numerous to sustain the predicted level of silver eel production in 1984, or put another way, that settlement had declined in the period before the first year of the simulation, i.e. 1983. Nevertheless, we use this level of silver eel production as the baseline against which to compare the effects of a decreasing trend in settlement and/or subsequent stocking scenarios.
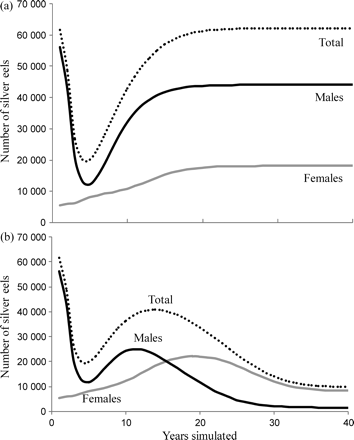
SMEP simulations of the production of silver eels from a baseline yellow eel population similar to that in tributaries of the lower Severn in 1983, projected forwards in time with either (a) stable annual elver settlement (9 million), and (b) an 85% decline in elver settlement over 20 years followed by another 20 years at a minimum level of settlement.
Assuming a fixed quantity of elver settlement of 9 million “per annum” over the 40 years, silver eel production stabilizes around year 20 and reaches ∼62 000 eels, 29% of which are female (Figure 9a). In contrast, applying a decline in settlement to 15% over the first 20 years reduces annual silver eel production by almost 50%, and it is female-dominated from year 17 on (Figure 9b). Maintaining the lesser settlement of 15% for another 20 years reduces silver eel production to 16% of its initial level (Figure 9b). Both settlement scenarios show rapid decreases in production of male silver eels over the first 5 years, presumably as the older eels from the 1983 base population, which was dominated by males, mature and leave the basin. Male production then increases under both scenarios, returning to a stable, though lower, level than that predicted for 1984 in the fixed settlement scenario, but decreasing again after 12 years in the declining settlement scenario to stabilize at a very low level commensurate with the low annual settlement and resultant low densities of undifferentiated eels. Female production increases over the first 20 years in both scenarios, but thereafter stabilizes under the fixed settlement regime, and decreases again in the minimum quantity settlement scenario. Despite the 100-fold difference in the range of male silver eel production under the two scenarios, female production in both cases only ranges fourfold from ∼5000 to 20 000, showing how important it is to have a good understanding of the relationship between population size and female population size (i.e. density-dependence). If the relationship we use is close to reality, the results would suggest that the decline in recruitment might not make a big difference in the size of the female population, but that it can seriously reduce the size of the male population. In such a case, there might be a need to protect specific groups of eels, e.g. to protect emigrating male silver eels by an appropriate minimum landing size, or to protect males and females by slot limits.
Stocking 500 000 small elvers annually into reach 2 from years 41 to 60 of the low-settlement scenario would increase by more than five times the density of undifferentiated eels in this reach. As there were almost no undifferentiated eels in reach 4 at this low level of settlement, a similar stocking exercise would increase their density by a factor of 10 000. Some 20 years of stocking in either reach would increase silver eel output by ∼2900–3300 eels, 89–97% of which would be females. Employing these stocking regimes in the high-settlement scenario resulted in similar increases in silver eel output, but the additional silver eels resulting from stocking into reach 2 were predominantly male, reflecting the relatively high density of undifferentiated eels in the recipient population of that reach.
The contribution of stocked eels relative to the 9 million elvers at the beginning of the time-series is similar to the increased silver eel output as a proportion of maximum output, which demonstrates the direct, if time-delayed, link between settlement and silver eel output in this parameterization of the SMEP.
Discussion
Although both the RCM and SMEP modelling approaches require further development, the results here illustrate their potential application to inform various aspects of the development of EMPs. As noted earlier, the EMP process will require an assessment of present and future silver eel production against a management target set at 40% of the biomass of silver eel production expected from natural eel habitat in the basin in the absence of anthropogenic impact.
The RCM does not provide estimates of the target or present-day levels of silver eel production, but it does provide a surrogate assessment of yellow eel production across the basin as a proportion of a historical, reference level of production derived from other selected rivers. If one assumes a linear relationship between yellow eel and silver eel production, one can use the RCM to derive at least a reasonably realistic and pragmatic quantitative assessment of relative production. The example illustrated here suggests that the silver eel output from the Severn basin may be just meeting the 40% escapement target, but this assumes that relative production measured in terms of density (for the RCM) is equivalent to relative production measured in terms of biomass, which will be required for the ERP.
Of course, both the procedure and the RCM model rely on a number of assumptions that have yet to be tested thoroughly. For example, the lack of recent yellow eel survey data throughout the length of the Severn basin means that the RCM assessment can only be applied using survey data from the early 1980s. This approach may be justified if, as several have suggested, the yellow eel population throughout the Severn basin has not changed significantly during the past two decades. Certainly, this assumption appears valid for the yellow eel populations in the lower tributaries (i.e. reaches 1–3 in Figure 4) based on comparisons of population size and structure (Aprahamian, 1986, 1988; Knights et al., 2001; Bark et al., 2007), but these are areas closest to the estuary, and would be the last to show the effects of declining recruitment. The lack of recent data from previously surveyed sites in the middle and upper basin (reaches 4 and 5 in Figure 4) preclude an acceptance of this assumption for the eel population as a whole. On the other hand, water quality has improved across many UK river basins in the past 20 years, so the Severn basin today may provide more potentially productive eel habitat and fewer water-quality-based impacts on production than were present in the early 1980s.
The model is based on a very limited dataset of rivers, mainly from southwest England, which are relatively short and rise steeply up to low-productivity moorlands. For example, the eel density–gradient relationship is heavily influenced by one river, the Plym (g = 0.021; b = 0.241 km−1). More data are required from a variety of river types covering a wider geographical area, especially east coast lowland systems with relatively low recruitment and those with on-line lakes. It is also important to examine a wider suite of explanatory variables, particularly other catchment and water quality variables.
Further, it is not possible with the RCM approach to identify whether any shortfall in escapement relative to the management target relates to specific impacting factors, or to combinations of factors. The current RCM application does not take into account the loss of habitat in the UK during the second half of the 20th century when, for example, the area of potentially productive eel habitat in the Severn basin was considered to have declined, particularly in the lower reaches. Such deterioration will have had a concomitant impact on escapement. These limitations will be addressed during further development of the RCM.
Although some other eel production models have been developed (see review by De Leo et al., in press, and some of the papers included in this volume), only GlobAng (Lambert and Rochard, 2007) and the SMEP have attempted to incorporate the full range of biological processes that govern the continental phase of eel production, including the effects of density-dependence, within a spatial modelling framework that can be applied to basins split into a number of different reaches. GlobAng is an age-based model, whereas the SMEP simulates both age- and length-based processes, providing a more flexible modelling framework which can describe possible influences of growth rates on eel dynamics (e.g. movements, maturation) (Davey and Jellyman, 2005), and the relationships between fish length and their propensity to disperse throughout the basin (Laffaille et al., 2003) and the onset of maturation (Vøllestad, 1992; Svedang et al., 1996).
The SMEP has the potential to provide a comprehensive tool for managers to use in the development and implementation of EMPs. Given an appropriate set of parameters to describe the production of eels in a specific river basin, and an accurate description of the eel-producing habitat, the SMEP approach should provide an estimate of the target silver eel escapement. Note that here we assume no post-maturation mortality of silver eels and therefore that production is synonymous with escapement. Moreover, an appropriate description of the size and structure of the yellow eel population in one or more recent years, or during a previous period with an associated knowledge of trends in recruitment from then to today, should allow an estimate to be generated for silver eel production and hence an assessment of compliance with the management target, plus an assessment of the likely impact or benefit of various management options.
In using the SMEP, we chose to apply a complex length- and age-based model in an attempt to capture all processes involved in the production of eels during the continental phase of the life cycle. However, the price for using such a realistic but complex modelling framework is that, given our limited understanding of some key eel production processes and limited data describing populations of eels in UK rivers, the SMEP relies on a number of assumptions about eel production processes, the consequence of which is that the model results have to be considered with an associated level of uncertainty and caution. Therefore, we stress that the results presented cannot be read as a definitive assessment but, rather, that they illustrate the benefits and the complexities of the approach, and the types of knowledge and data required in its application for management purposes.
As already noted, density-dependence may influence a number of the processes controlling eel production. Our sensitivity analysis showed that the influence of density-dependence on mortality in the current parameterization of the SMEP was limited to the undifferentiated yellow eel stage. Effectively, this meant that production of yellow and silver eels was not limited (Figure 6) and, therefore, an assessment of the potential production of silver eel for a management target would be limited only by recruitment. To make this a realistic approach would require prior knowledge of the maximum level of recruitment. Setting a carrying capacity to limit production may be a more pragmatic approach in light of our limited understanding of glass eel recruitment and elver settlement in UK eel populations. Lambert and Rochard (2007) adopted this approach for GlobAng, limiting carrying capacity on a purely hypothetical basin to a biomass per reach equivalent to 200 eels of age 13 years.
The SMEP results presented here support those of GlobAng (Lambert and Rochard, 2007) in highlighting the importance of accounting for the effects of density-dependent influences on sex differentiation in models of silver eel production, at least with respect to management targets set for EMPs. Although the silver eel production predicted by the SMEP remained similar at all levels of saturation (Figure 7), the substantial changes in absolute and relative numbers of male and female silver eels produced from a fixed input of elvers under varying saturation biomass levels highlights the importance of both this process and parameter choice in the present simulations. The present target for EMPs is to be measured as the biomass of total silver eel escapement. Given the concept that male eels typically mature and emigrate at smaller size and younger age than females (Tesch, 2003), low saturation levels that produce relatively high proportions of male eels for a fixed input of elvers will result in a smaller annual biomass of silver eels than higher saturation levels that produce a greater proportion of larger, older female silver eels. However, it seems that the male-dominated population would respond faster, in terms of silver eel production, to any increase in the input of elvers. This may be important in terms of the management target for any EMP, because this also has a time limit, although it has yet to be defined. This dynamic between the sex ratio of silver eels and total biomass production will need to be carefully considered by those tasked with increasing silver eel production in basins that are currently not meeting their EMP target. Monitoring schemes to collect the data necessary to assess compliance or at least the increase in silver eel production towards the target should include an assessment of sex ratio among eel populations. However, this by itself could cause concerns, because there is no non-lethal procedure for determining the sex of eels. This is another area of general eel research where improvements could be very helpful.
In addition to incorporating the potential effects of density-dependence on the propensity of eels to move from one reach to the next, the SMEP incorporates the propensity of yellow eels to migrate upstream through a basin, even at low levels of recruitment where migration is not influenced by density-dependence (Ibbotson et al., 2002; Feunteun et al., 2003). However, only limited dispersal of yellow eels over an extended time-frame (50 years) was achieved at all but the highest levels of elver input (Figure 8). Therefore, more work is needed to understand better the factors that might trigger movement, and to find ways to describe them quantitatively. A realistic migration function will be important in assessing the benefits of management measures that increase the input of eels to the lower parts of the basin.
Spatial models such as the SMEP provide a facility to moderate production based not only on the productive area, but also on the productive potential of different types of habitat. Ultimately, this should allow a user to transport a model derived from a data-rich basin to another basin with limited information on the eel population, but an appropriate description of the habitat available to eels. This approach has been applied in management of some Atlantic salmon stocks (Wyatt and Barnard, 1997), and has been recognized as one of the potential methods for setting targets in the ERP. The SMEP model application reported here is based on a simplified description of part of the Severn basin. A full assessment of eel production in the Severn basin will require appropriate quantification of the productive catchment and the locations and impacts of both physical barriers and poor habitat and water quality. The reaches were defined according to an arbitrary classification of habitat types, and on the availability of eel population data from surveys. Alternatively, reaches can be defined according to significant changes in the yellow eel population, such as zones dominated by different length classes (E. Feunteun, pers. comm.), or perhaps related to some measure of eel abundance. The latter option might be especially applicable to basins where the distribution of eels is limited by barriers.
Sampling in the Severn was confined to sites where electrofishing could be used effectively (i.e. mainly shallow tributary sites), so the description of eel populations derived from these data may not be representative of the eel populations in the wider river sections that contribute significantly to the productive area of the lower four reaches. The study of eel populations in deep habitats has been limited to date, but this is recognized as an area that requires immediate attention. Moreover, data were available from fewer than five surveys per tributary, and it is unlikely that these adequately represented the eel population throughout the tributaries, some of which were more than 20 km long. Knights et al. (2001) suggested a minimum of 20 survey sites throughout a basin as necessary to provide statistically robust data with which to assess trends in eel production.
Stocking elvers has been identified in the Eel Recovery Regulation as one of several potential methods available to increase silver eel production in non-complying basins. The simulations conducted here illustrate the potential use of the SMEP approach to assessing the benefits of stocking per se, and the effects of varying the numbers and size of stocked eels and the recipient areas of the basin. However, this application is hindered at present by our limited understanding of the processes involved in eel production, and in the relative cost and benefits in terms of relative mortalities in the donor and recipient eel populations associated with stocking. Clearly, the impetus for a quantitative understanding of eel life history has never been stronger.
Acknowledgements
The views expressed in this paper are those of the authors and do not necessarily reflect those of the funders. The study was funded by Defra and the Environment Agency, and aspects of the SMEP analyses were based on earlier analyses reported in the Report of FP6-project FP6-022488 “Restoration of the European eel population; pilot studies for a scientific framework in support of sustainable management”, code-named SLIME—Study Leading to Informed Management of Eels, Priority 8.1, Policy-orientated research, Scientific Support to Policies. We acknowledge the work of Heidi El-Hosaini (King's College, London) and the late Geoff Kirkwood (Imperial College, London) in developing SMEP as part of project CTG0102 funded by Defra, and Panayiota Apostolaki and Johan van der Molen (Cefas) for contributing to the further development of the model, and thank Defra for allowing us to use SMEP in our research. We also extend our thanks to the Environment Agency staff and others who assisted in the collection of the data used here, to Irene Gooch (Cefas) for producing the artwork, and to Mike Pawson, Mårten Åström, and an anonymous reviewer for their valued suggestions that significantly improved the manuscript.
