


Abstract
Polycystic ovary syndrome (PCOS) is the most frequent cause of anovulatory infertility. In women with PCOS, effective ovulation induction serves as an important first-line treatment for anovulatory infertility. Individual participant data (IPD) meta-analysis is considered as the gold standard for evidence synthesis which provides accurate assessments of outcomes from primary randomised controlled trials (RCTs) and allows additional analyses for time-to-event outcomes. It also facilitates treatment–covariate interaction analyses and therefore offers an opportunity for personalised medicine.
We aimed to evaluate the effectiveness of different ovulation induction agents, in particular letrozole alone and clomiphene citrate (CC) plus metformin, as compared to CC alone, as the first-line choice for ovulation induction in women with PCOS and infertility, and to explore interactions between treatment and participant-level baseline characteristics.
We searched electronic databases including MEDLINE, EMBASE and Cochrane Central Register of Controlled Trials up to 20 December 2018. We included RCTs comparing the following interventions with each other or placebo/no treatment in women with PCOS and infertility: CC, metformin, CC plus metformin, letrozole, gonadotrophin and tamoxifen. We excluded studies on treatment-resistant women. The primary outcome was live birth. We contacted the investigators of eligible RCTs to share the IPD and performed IPD meta-analyses. We assessed the risk of bias by using the Cochrane risk of bias tool for RCTs.
IPD of 20 RCTs including 3962 women with PCOS were obtained. Six RCTs compared letrozole and CC in 1284 women. Compared with CC, letrozole improved live birth rates (3 RCTs, 1043 women, risk ratio [RR] 1.43, 95% confidence interval [CI] 1.17–1.75, moderate-certainty evidence) and clinical pregnancy rates (6 RCTs, 1284 women, RR 1.45, 95% CI 1.23–1.70, moderate-certainty evidence) and reduced time-to-pregnancy (6 RCTs, 1235 women, hazard ratio [HR] 1.72, 95% CI 1.38–2.15, moderate-certainty evidence). Meta-analyses of effect modifications showed a positive interaction between baseline serum total testosterone levels and treatment effects on live birth (interaction RR 1.29, 95% CI 1.01–1.65). Eight RCTs compared CC plus metformin to CC alone in 1039 women. Compared with CC alone, CC plus metformin might improve clinical pregnancy rates (8 RCTs, 1039 women, RR 1.18, 95% CI 1.00–1.39, low-certainty evidence) and might reduce time-to-pregnancy (7 RCTs, 898 women, HR 1.25, 95% CI 1.00–1.57, low-certainty evidence), but there was insufficient evidence of a difference on live birth rates (5 RCTs, 907 women, RR 1.08, 95% CI 0.87–1.35, low-certainty evidence). Meta-analyses of effect modifications showed a positive interaction between baseline insulin levels and treatment effects on live birth in the comparison between CC plus metformin and CC (interaction RR 1.03, 95% CI 1.01–1.06).
In women with PCOS, letrozole improves live birth and clinical pregnancy rates and reduces time-to-pregnancy compared to CC and therefore can be recommended as the preferred first-line treatment for women with PCOS and infertility. CC plus metformin may increase clinical pregnancy and may reduce time-to-pregnancy compared to CC alone, while there is insufficient evidence of a difference on live birth. Treatment effects of letrozole are influenced by baseline serum levels of total testosterone, while those of CC plus metformin are affected by baseline serum levels of insulin. These interactions between treatments and biomarkers on hyperandrogenaemia and insulin resistance provide further insights into a personalised approach for the management of anovulatory infertility related to PCOS.
Introduction
Polycystic ovary syndrome (PCOS) is the most common endocrine disorder of reproductive age women, and the prevalence among different geographic regions ranges from 5 to 21%, depending on the criteria used (Lizneva et al., 2016). PCOS is a heterogeneous syndrome comprising of at least two of the following clinical characteristics according to the Rotterdam diagnostic criteria: oligo-/anovulation, clinical and/or biochemical hyperandrogenism or polycystic ovaries morphology based on ultrasound assessment (Rotterdam ESHRE/ASRM-Sponsored PCOS Consensus Workshop Group, 2004).
Anovulatory infertility is usually one of the key features that women with PCOS are confronted with. Simple and effective infertility treatments as the first-line choice are therefore important. Our previous network meta-analysis compared available first-line treatment options for women with PCOS with infertility and found that letrozole and combined clomiphene citrate (CC)–metformin were superior to other ovulation induction medications in terms of clinical pregnancy and that letrozole resulted in more live births than other interventions, including CC (Wang et al., 2017). These findings are in agreement with the evidence summarised in the international evidence based guideline for the assessment and management of PCOS (Teede et al., 2018).
As women with PCOS represent a heterogeneous population according to the diagnostic criteria, it is important to identify which individuals benefit most from a particular treatment so that clinicians can provide personalised care (Wang and Mol, 2017). However, primary RCTs are usually underpowered to detect subgroup effects (Riley et al., 2010). Subgroup analyses in meta-analyses of aggregate data are at risk of ecological bias due to the ignorance of within-study interactions or are even impossible to perform due to heterogeneous reporting of subgroup data in the primary trials (Riley et al., 2010).
Moreover, time-to-pregnancy is also an important patient-centred outcome, but it has never been reported in previous meta-analyses on PCOS. This is likely due to the unavailability of the data in the publication as well as the methodological challenges on data extraction and synthesis. In addition, the primary trials are not always of high quality in terms of analyses and reports (Eshre Capri Workshop Group, 2018), which can directly affect the data extraction, analysis and risk of bias assessment process in subsequent meta-analyses.
These deficiencies in aggregate data meta-analyses can potentially be overcome by using individual participant data (IPD). IPD meta-analysis has been described as the gold standard in evidence synthesis, by engaging investigators of the primary trials to provide the raw data of the primary trials (Broeze et al., 2010). Such strategy facilitates derivation of the information beyond the primary publication, standardisation of inclusion criteria, outcomes and analyses across trials and investigations of subgroup effects and time-to-event outcomes. (Broeze et al., 2010; Riley et al., 2010).
We therefore performed an IPD meta-analysis to evaluate the effectiveness of different ovulation induction agents, in particular letrozole alone and CC plus metformin, as compared to CC alone, as the first-line choice for ovulation induction in women with PCOS and infertility, and to explore interactions between treatment and participant-level baseline characteristics.
Methods
Registration and literature search
This IPD meta-analysis was conducted based on a registered protocol (PROSPERO CRD42017059251) and reported according to the Preferred Reporting Items for Systematic Review and Meta-Analyses of individual participant data (PRISMA-IPD) statement (Stewart et al., 2015).
We updated the searches in MEDLINE, EMBASE and Cochrane Central Register of Controlled Trials in September 2017, based on our previous search strategies for a network meta-analysis on treatment strategies for World Health Organization (WHO) II anovulation (Wang et al., 2017). In brief, the search terms included both index terms as well as free words on PCOS, anovulation and ovulation induction. After completing data requesting process, we further updated the search on 20 December 2018 to identify the latest studies. We also searched the WHO International Clinical Trials Registry Platform (WHO ICTRP) and US National Institutes of Health (clinicaltrials.gov) and ISRCTN registry to identify ongoing trials. In addition, we reviewed the references lists of relevant papers and corresponded with trialists in PCOS to identify potential eligible trials that we might have missed.
Eligibility criteria
We included RCTs comparing the following interventions with each other or placebo/no treatment: CC, metformin, CC and metformin combined, letrozole, gonadotrophins and tamoxifen in women with WHO II anovulation, including PCOS. We excluded trials reporting on treatment-resistant women, trials comparing different doses of the same intervention and quasi-RCTs. We did not apply language restrictions. For crossover trials, we only included the data in the first phase.
The primary outcome was live birth. The secondary outcomes were clinical pregnancy, ovulation, miscarriage, multiple pregnancy and time to pregnancy.
Study selection and data collection
Two members of the review team (from R.W., W.L. and E.M.B.) independently assessed the titles and abstracts to exclude irrelevant studies and subsequently reviewed the full-text articles to evaluate their eligibility. Disagreements were resolved by discussion with a third author (B.W.M., M.v.W. or R.J.N.).
We contacted investigators of eligible RCTs to share the de-identified IPD and established the International Ovulation Induction IPDMA Collaboration. We sent at least two more reminders when we did not receive responses.
We obtained de-identified IPD including baseline characteristics including age, body mass index (BMI), ethnicity, type of infertility (primary/secondary), treatment history (treatment-naïve or not), fasting glucose, fasting insulin, total testosterone, sex hormone-binding globulin (SHBG), ovarian volume and the Ferriman–Gallwey score for hirsutism. We also obtained data on allocated treatments, number of ovulation induction cycles, ovulation and fertility outcomes including live birth, clinical pregnancy, miscarriage and multiple pregnancy.
We checked data for consistency by comparing the analyses from obtained IPD with the original publications. We discussed any inconsistencies or obvious errors with investigators of primary RCTs and solved discrepancies by consensus.
Risk of bias assessment
Two members of the review team independently evaluated the risk of bias in each included RCT, using the domain-based evaluation tool described in the Cochrane Handbook for Systematic Reviews of Interventions (Higgins and Green, 2011). We assessed the following domains as low risk of bias, unclear or high risk of bias: random sequence generation, allocation concealment, blinding of participants and personnel, blinding of outcome assessors, incomplete outcome data, selective reporting (reporting bias) and other sources of bias. When the risk of bias for a domain was unclear, investigators of these RCTs were asked to provide additional information to resolve the uncertainty.
We assessed the overall certainty of the evidence across RCTs by using the Grading of Recommendations Assessment, Development and Evaluation (GRADE) approach, including the risk of bias, consistency of effect, imprecision, indirectness and publication bias.
Data synthesis
We conducted all analyses based on an intention-to-treat principle using women randomised per allocated group as the unit of all analyses. We performed two-stage random-effects IPD meta-analyses for letrozole versus CC alone and CC with metformin versus CC alone. For dichotomous outcomes, we calculated RRs and 95% confidence intervals (CIs) and presented statistical heterogeneity by using I2 statistic (Higgins and Green, 2011). For time-to-event outcomes, we used the number of treatment cycles as an approximate estimate for time and visualised the summary time-to-event in simple non-stratified Kaplan–Meier curves. We also estimated hazard ratios (HRs) in Cox proportional hazards regression models for discrete time and pooled HRs and 95% CI, by using the generic inverse variance method (Fisher, 2015).
Subgroup effects were estimated for the primary outcome by treatment–covariate interaction terms within trials and subsequent meta-analyses of interactions, as interactions using within-trial information alone without considering between-trial interactions are recommended as the standard practice to avoid ecological bias (Fisher et al., 2017). We explored the treatment–covariate interactions of the following pre-specified baseline covariates: age, BMI, ethnicity, primary/secondary infertility, treatment history, hirsutism score, insulin resistance (serum glucose and insulin level), hyperandrogenaemia status (testosterone, SHBG, free androgen index) and ovarian volume. We also added the analysis of homeostatic model assessment for insulin resistance (HOMA-IR) as requested during the peer review process. For dichotomous covariates with statistically significant interaction, we further performed stratified analyses to illustrate the treatment effects in different strata of the subgroups. Continuous variables were analysed as such without categorisation. For continuous covariates with statistically significant interaction, we further presented a weighted mean curve and pointwise CI based on treatment–covariate interactions estimated in relevant studies. Due to the potential type I error, the results of subgroup analyses were all considered exploratory.
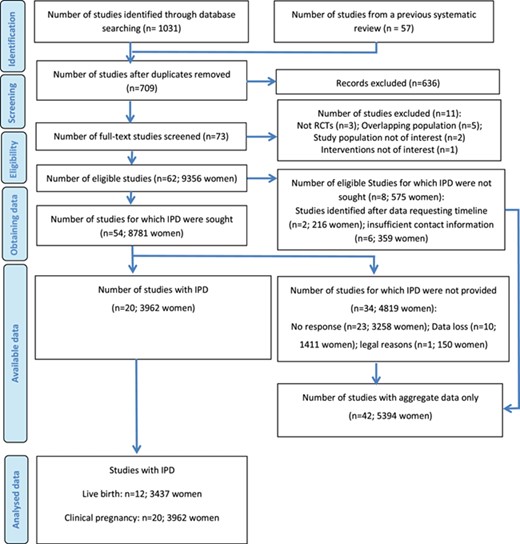
PRISMA-IPD flow diagram.
To evaluate the IPD availability bias, we performed a network meta-analysis of RCTs with IPD in a random-effects multivariate meta-analysis model (Riley et al., 2017; White, 2015) on live birth and clinical pregnancy and then compared the results with a network meta-analysis of all eligible RCTs. If these results were consistent, we considered the included RCTs with IPD representative of all the eligible RCTs.
We performed a sensitivity analysis on studies with low risk of bias in allocation concealment as planned. As the majority of eligible studies focused only on treatment-naïve women with PCOS, these studies did not contribute to within-study interaction for treatment history and were not included in the treatment-covariate analysis. We performed a post hoc sensitivity analysis by including only treatment-naïve women to demonstrate the robustness of the results.
We conducted all the analyses in Stata software version 15.1 (Stata Corp, College Station, TX, USA).
Results
Characteristics of included studies
The final updated search yielded 709 non-duplicated studies (Fig. 1). After screening the titles and abstracts, 636 irrelevant studies were excluded. Finally, a total of 62 studies (61 publications, 9356 women) fulfilled the inclusion criteria and were included. These studies were published in English (n = 58), French (n = 1) (Boudhraa et al., 2010), Italian (n = 1) (Santonocito et al., 2009), Turkish (n = 1) (Aygen et al., 2007) and Persian (n = 1) (Lorzadeh et al., 2011).
IPD was not sought from eight studies (575 women), due to insufficient contact information (n = 6; 359 women) (Beigi, 2006; Boudhraa et al., 2010; Cudmore and Tupper, 1966; El-Biely and Habba, 2001; Garcia et al., 1985; Johnson et al., 1966) or because the studies were identified after our data requesting timeline (n = 2; 216 women) (Fatima et al., 2018; Topçu et al., 2017). For the remaining 54 studies (8781 women), the primary investigators were contacted to share IPD of the primary studies. IPD from 34 studies (4819 women) were not available, due to no response (n = 23; 3258 women) (Abuelghar et al., 2013; Atay et al., 2006; Ayaz et al., 2013; Banerjee Ray et al., 2012; Basirat et al., 2012; Boostanfar et al., 2001; Chen et al., 2016; Dasari and Pranahita, 2009; Dehbashi et al., 2009; Hossein-Rashidi et al., 2016; Jahan, 2015; Karimzadeh et al., 2007; Karimzadeh and Javedani, 2010; Lopez et al., 2004; Lorzadeh et al., 2011; Maged et al., 2015; Robinson et al., 2003; Roy et al., 2012; Selim and Borg, 2012; Seyedoshohadaei et al., 2012; Sharief and Nafee, 2015; Sheikh-El-Arab Elsedeek and Elmaghraby, 2011; Zeinalzadeh et al., 2010), data loss (n = 10; 1411 women) (Aygen et al., 2007; Badawy et al., 2009; Badawy and Gibreal, 2011; Fleming et al., 2002; Keikha and Shahraki, 2011; Khorram et al., 2006; Mobusher, 2014; Santonocito et al., 2009; Tang et al., 2006; Zain et al., 2009) or legal reasons (n = 1; 150 women) (Moussa et al., 2016). These studies are listed in Supplementary Table S1.
IPD were available for at least one outcome from 20 studies (3962 women Table 1), including three from the USA (Legro et al., 2007; Legro et al., 2014; Williams et al., 2009), three from Italy (Leanza et al., 2014; Palomba et al., 2005; Vegetti et al., 1999), three from Turkey (Bayar et al., 2006; Nazik and Kumtepe, 2012; Sahin et al., 2004), two from the UK (Amer et al., 2017; Lord et al., 2006), two from China (Liu et al., 2017; Wu et al., 2017), two from India (Kar, 2012; Kar and Sanchita, 2015), two studies (in one publication) from New Zealand (Johnson et al., 2010), one from the Netherlands (Moll et al., 2006), one from Finland (Morin-Papunen et al., 2012) and one from multiple countries (the Netherlands, UK, Malta, Belgium, Argentina and Colombia) (Homburg et al., 2012). These RCTs were published in English between 1999 and 2017, with 11 (55%) published after 2010.
Participants in all 20 RCTs were women with PCOS. In one RCT, participants were diagnosed with PCOS by fulfilling at least three of the following: PCO morphology, oligo/amenorrhoea, hirsutism, hyperandrogenaemia and elevated serum LH/FSH ratio (Sahin et al., 2004), while in the remaining 19 RCTs, the participants were women with PCOS based on the Rotterdam criteria (Bayar et al., 2006; Kar, 2012; Leanza et al., 2014; Liu et al., 2017; Nazik and Kumtepe, 2012) or different phenotypes, including Phenotype B (ovulatory dysfunction + androgen excess) (Amer et al., 2017; Homburg et al., 2012; Johnson et al., 2010; Kar and Sanchita, 2015; Legro et al., 2007; Legro et al., 2014; Lord et al., 2006; Morin-Papunen et al., 2012; Palomba et al., 2005; Williams et al., 2009; Wu et al., 2017) or Phenotype D (ovulatory dysfunction + PCO) (Moll et al., 2006; Vegetti et al., 1999).
Characteristics of included studies.
| Study | Comparisons | Sample size | Age (mean) | BMI (mean) | Treatment-naïve(%) | Outcomes |
|---|---|---|---|---|---|---|
| (Amer et al., 2017) | Letrozole vs CC | 159 | 28.2 ± 4.3 | 27.5 ± 4.8 | 100% | Live birth, clinical pregnancy, time to pregnancy, miscarriage, multiple pregnancy, ovulation |
| (Bayar et al., 2006) | Letrozole vs CC | 80 (74) | 31.4 ± 4.0 | NA | 100% | Clinical pregnancy, multiple pregnancy, time to pregnancy |
| (Homburg et al., 2012) | FSH vs CC | 302 | 29.5 ± 3.9 | 25.4 ± 5.6 | 100% | Live birth, clinical pregnancy, time to pregnancy, miscarriage, multiple pregnancy, ovulation |
| (Johnson et al., 2010)A | Metformin vs placebo | 65 | 29.6 ± 4.2 | 37.8 ± 3.5 | 69% | Live birth, clinical pregnancy, time to pregnancy, miscarriage, multiple pregnancy, ovulation |
| (Johnson et al., 2010)B | CC + metformin vs CC vs metformin | 106 | 28.7 ± 4.4 | 26.5 ± 3.7 | 78% | Live birth, clinical pregnancy, time to pregnancy, miscarriage, multiple pregnancy, ovulation |
| (Kar 2012) | Letrozole vs CC | 103 | NA | 25.9 ± 3.4 | 100% | Clinical pregnancy, time to pregnancy, ovulation |
| (Kar and Sanchita 2015) | CC + metformin vs CC vs metformin | 105 (81) | 25.6 ± 3.3 | 26.1 ± 4.3 | 100% | Live birth, clinical pregnancy, time to pregnancy, miscarriage, multiple pregnancy, ovulation |
| (Leanza et al., 2014) | CC + metformin vs CC | 56 | 31.1 ± 2.0 | 29.5 ± 1.4 | 100% | Clinical pregnancy, miscarriage, ovulation |
| (Legro et al., 2007) | CC + metformin vs CC vs metformin | 626 | 28.1 ± 4.0 | 35.2 ± 8.7 | 45% | Live birth, clinical pregnancy, time to pregnancy, miscarriage, multiple pregnancy, ovulation |
| (Legro et al., 2014) | Letrozole vs CC | 750 | 28.9 ± 4.3 | 35.1 ± 9.3 | 45% | Live birth, clinical pregnancy, time to pregnancy, miscarriage, multiple pregnancy, ovulation |
| (Liu et al., 2017) | CC + metformin vs letrozole vs CC | 203 | 27.0 ± 3.0 | 21.5 ± 2.9 | 100% | Live birth, clinical pregnancy, time to pregnancy, miscarriage, multiple pregnancy, ovulation |
| (Lord et al., 2006) | Metformin vs placebo | 44 | 29.1 ± 4.9 | 34.8 ± 7.0 | unknown | Clinical pregnancy, ovulation |
| (Moll et al., 2006) | CC + metformin vs CC | 225 | 28.4 ± 3.8 | 28.1 ± 6.9 | 100% | Live birth, clinical pregnancy, time to pregnancy, miscarriage, multiple pregnancy, ovulation |
| (Morin-Papunen et al., 2012) | Metformin vs placebo | 320 | 28.2 ± 4.0 | 27.2 ± 6.3 | 69% | Live birth, clinical pregnancy, time to pregnancy, miscarriage, multiple pregnancy, ovulation |
| (Nazik and Kumtepe, 2012) | Letrozole vs CC | 64 | 26.8 ± 5.6 | 25.1 ± 4.3 | 100% | Clinical pregnancy, time to pregnancy, ovulation |
| (Palomba et al., 2005) | CC vs metformin | 100 | 26.2 ± 4.4 | 26.7 ± 2.3 | 100% | Live birth, clinical pregnancy, time to pregnancy, miscarriage, multiple pregnancy, ovulation |
| (Sahin et al., 2004) | CC + metformin vs CC | 21 | 25.1 ± 3.3 | 28.2 ± 3.7 | 100% | Clinical pregnancy, time to pregnancy, ovulation |
| (Vegetti et al., 1999) | Tamoxifen vs CC | 95 (108) | 30.9 ± 3.1 | 22.7 ± 4.2 | 100% | Clinical pregnancy, time to pregnancy, ovulation |
| (Williams et al., 2009) | CC + metformin vs CC | 59 (55) | NA | NA | 100% | Clinical pregnancy, time to pregnancy, ovulation |
| (Wu et al., 2017) | CC vs placebo | 500 | 27.9 ± 3.3 | 24.5 ± 4.2 | 70% | Live birth, clinical pregnancy, time to pregnancy, miscarriage, multiple pregnancy, ovulation |
For RCTs involving two stages of different interventions, including cross-over studies, we only included the data in the first stage. We included the IPD comparing letrozole versus CC before crossing over (Amer et al., 2017) and included the IPD comparing metformin versus placebo within the first 3 months before starting other ovulation induction agents (Morin-Papunen et al., 2012). In one RCT (Nazik and Kumtepe, 2012), switching between intervention and the control after the first cycle was allowed during the trial and the analysis in the primary publication was on a per-cycle basis, and therefore, we only included the IPD of the first cycle.
In summary, four RCTs compared three interventions (CC plus metformin or CC alone versus metformin (Johnson et al., 2010; Kar and Sanchita, 2015; Legro et al., 2007) or CC with metformin or letrozole versus CC (Liu et al., 2017)) and the remaining 16 compared two interventions. The most common comparisons were CC with metformin versus CC alone (8 RCTs) (Johnson et al., 2010; Kar and Sanchita 2015; Leanza et al., 2014; Legro et al., 2007; Liu et al., 2017; Moll et al., 2006; Sahin et al., 2004; Williams et al., 2009) and letrozole versus CC alone (6 RCTs) (Amer et al., 2017; Bayar et al., 2006; Kar, 2012; Legro et al., 2014; Liu et al., 2017; Nazik and Kumtepe, 2012).
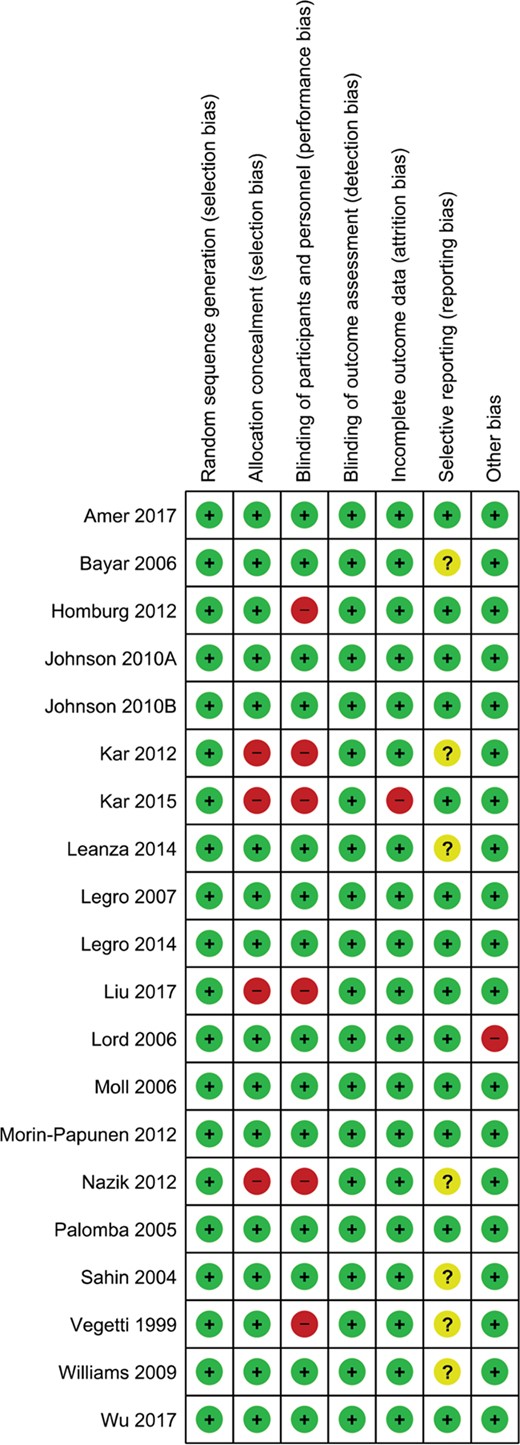
Risk of bias assessments of individual RCTs.
Quality of evidence of individual studies
The details of risks of bias assessments within individual studies are presented in Figure 2. All RCTs (n = 20) reported adequate methods of random sequence generation. Sixteen RCTs (80%) reported adequate methods of allocation concealment while the other four used an open allocation schedule without concealment (Kar, 2012; Kar and Sanchita, 2015; Liu et al., 2017; Nazik and Kumtepe, 2012). Fourteen RCTs (70%) blinded the participants and personnel during the trial while six RCTs applied an open label design (Homburg et al., 2012; Kar, 2012; Kar and Sanchita, 2015; Liu et al., 2017; Nazik and Kumtepe, 2012; Vegetti et al., 1999). Given that all outcomes of interest were objective outcomes, it is unlikely that the non-blinded design will affect the outcome measurement and therefore detection bias was rated at low risk for all the included studies. One RCT (5%) had high risk of attrition bias, with 22% overall missing outcome data and 31% missing outcome data in the metformin group (Kar and Sanchita, 2015). One RCT (5%) was at another risk of bias due to allowing imbalanced CC in both groups.
Meta-analyses of letrozole versus CC
Live birth
IPD were available in six RCTs comparing letrozole and CC, including 1284 women with PCOS. The forest plot of IPD meta-analysis on live birth is presented in Figure 3a. Compared with CC, letrozole increased live birth rates (3 RCTs, 1043 women, RR 1.43, 95% CI 1.17–1.75, I2 = 0, moderate certainty of evidence). Sensitivity analysis on studies with low risk of bias at allocation concealment and on treatment-naïve women was consistent with the main findings (2 RCTs, 909 women, RR 1.42, 95% CI 1.14–1.76, I2 = 0; 3 RCTs, 627 women, RR 1.41, 95% CI 1.11–1.79, I2 = 0) (Supplementary Table SII).
Meta-analyses and GRADE assessments of all outcomes.
| Comparison | Outcome | Number of RCTs | Number of participants | Risk ratio (RR) | 95% confidence interval (CI) | I2 | Overall certainty of evidence (GRADE) |
|---|---|---|---|---|---|---|---|
| Letrozole vs CC | Live birth | 3 | 1043 | 1.43 | 1.17–1.75 | 0 | Moderatea |
| Clinical pregnancy | 6 | 1284 | 1.45 | 1.23–1.70 | 0 | Moderatea | |
| Multiple pregnancy | 2 | 909 | 1.45 | 0.17–12.45 | 50.9% | Very lowa,b,c | |
| Miscarriage | 3 | 1043 | 1.50 | 0.95–2.38 | 0 | Lowa,c | |
| Ovulation | 5 | 1210 | 1.13 | 1.07–1.20 | 0 | Moderatea | |
| CC + metformin vs CC | Live birth | 5 | 907 | 1.08 | 0.87–1.35 | 5.6% | Lowa,c |
| Clinical pregnancy | 8 | 1039 | 1.18 | 1.00–1.39 | 6.9% | Lowa,c | |
| Multiple pregnancy | 4 | 771 | 0.76 | 0.24–2.42 | 0 | Lowa,c | |
| Miscarriage | 6 | 963 | 1.33 | 0.79–2.26 | 0 | Lowa,c | |
| Ovulation | 7 | 968 | 1.02 | 0.93–1.12 | 35.2% | Lowa,c |
aDowngraded by one level due to concerns on risk of bias.
bDowngraded by one level due to inconsistency.
cDowngraded by one level due to imprecision.
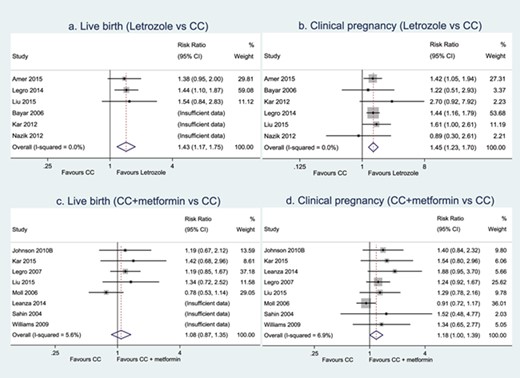
Meta-analyses of letrozole versus CC and CC plus metformin versus CC on live birth and clinical pregnancy.
Secondary outcomes
Compared with CC alone, letrozole improved clinical pregnancy (6 RCTs, 1284 women, RR 1.45, 95% CI 1.23–1.70, I2 = 0, moderate certainty of evidence, Fig. 3b) and ovulation rates (5 RCTs, 1210 women, RR 1.13, 95% CI 1.07–1.20, I2 = 0, moderate certainty of evidence, Table II). There was insufficient evidence of a difference between letrozole and CC alone in terms of multiple pregnancy or miscarriage (Table II).
The summary Kaplan–Meier curve for time to pregnancy is presented in Fig. 4a. Subsequent pooled analysis of HRs showed that compared to CC, letrozole reduced time-to-pregnancy (6 RCTs, 1235 women, HR 1.72, 95% CI 1.38–2.15, I2 = 0, moderate certainty of evidence).
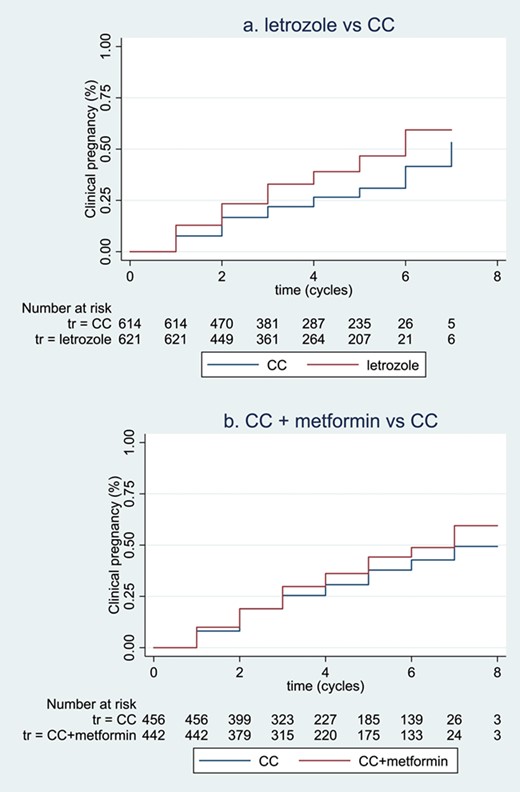
Summary of Kaplan–Meier curves for time-to-event outcomes. (a, b) illustrates the non-stratified summary Kaplan–Meier curves for time-to-pregnancy in the comparisons of letrozole versus CC and CC plus metformin versus CC, respectively. Participants with pregnancy before the first treatment cycles were not included in the ‘Numbers at risk’ table below, and data were not stratified by trial in this Kaplan–Meier curve. The figures were intended to visualise time-to-event outcomes, but not to show statistical significance.
Treatment–covariate interactions
A meta-analyses of effect modifications showed a positive interaction between baseline serum total testosterone levels and treatment effects on live birth in the comparison between letrozole and CC (interaction RR 1.29, 95% CI 1.01–1.65, 3 RCTs, 1039 women, Fig. 5a). This suggests that women with a higher baseline serum total testosterone level have a larger treatment effect of letrozole versus CC on live birth, compared to women with a lower baseline serum total testosterone level. Such an interaction was consistent across studies (I2 = 0). To directly illustrate the association between baseline serum total testosterone level and relative treatment effects, this interaction is also presented in a weighted mean curve with 95% CI (Fig. 5b). Meta-analyses did not find any other treatment–covariate interactions (Table III).
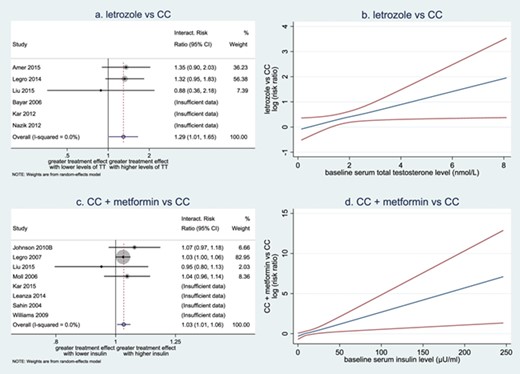
Forest plots and weighted mean curves for treatment-covariate interactions. (a) Forest plot of interactions between baseline serum total testosterone (TT) level and effect of letrozole versus CC on live birth. (b) Weighted mean curve with pointwise 95% CI of interactions between baseline serum total testosterone level and relative effect of letrozole versus CC on live birth. (c) Forest plot of interactions between baseline serum insulin level and effect of CC plus metformin versus CC on live birth. (d) Weighted mean curve with pointwise 95% CIs of interactions between baseline serum insulin level and effect of CC plus metformin versus CC on live birth. (a, c) Circles are used to depict the interaction effects within individual trials as well as the overall interaction effect. The sizes of the circles are in proportion to the inverse of the variance of the estimates. (b, d) Blue line represents for the weighted mean effect of covariate on log risk ratios in the comparison between letrozole and CC. Red lines represent for pointwise 95% CI of interactions.
Meta-analyses of treatment-covariate interactions on live birth.
| Comparison | Baseline covariate | Number of RCTs | Number of participants | Interaction RR | Interaction 95% CI | Interaction I2 |
|---|---|---|---|---|---|---|
| Letrozole vs CC | Age | 3 | 1043 | 0.98 | 0.93–1.05 | 24.9% |
| BMI | 3 | 1043 | 0.98 | 0.90–1.05 | 65.2% | |
| Ethnicity (non-Caucasian vs Caucasian) | 2 | 909 | 1.42 | 0.80–2.45 | 0 | |
| Treatment history (yes vs no) | 1 | 750 | 1.07 | 0.63–1.82 | / | |
| Type of infertility (secondary vs primary) | 3 | 1043 | 0.83 | 0.43–1.60 | 52% | |
| Total testosterone (nmol/L) | 3 | 1039 | 1.29 | 1.01–1.65 | 0 | |
| SHBG (nmol/L) | 2 | 907 | 1.00 | 0.99–1.02 | 69.7% | |
| Free androgen index | 2 | 907 | 1.02 | 0.91–1.15 | 79.2% | |
| Fasting glucose (mmol/L) | 3 | 1002 | 1.27 | 0.93–1.73 | 0 | |
| Fasting insulin (μU/mL) | 3 | 977 | 1.01 | 1.00–1.02 | 0 | |
| HOMA-IR | 3 | 975 | 1.04 | 0.98–1.09 | 0 | |
| Ferriman–Gallwey score for hirsutism | 2 | 884 | 1.03 | 0.99–1.06 | 0 | |
| Ovarian volume (ml) | 3 | 837 | 1.01 | 0.95–1.07 | 33.9% | |
| CC + metformin vs CC | Age | 5 | 895 | 1.06 | 0.98–1.15 | 43.7% |
| BMI | 5 | 885 | 1.02 | 0.98–1.07 | 25.1% | |
| Ethnicity (non-Caucasian vs Caucasian) | 3 | 705 | 0.91 | 0.21–3.90 | 66.8% | |
| Treatment history (yes vs no) | 1 | 418 | 0.90 | 0.46–1.78 | / | |
| Type of infertility (secondary vs primary) | 3 | 622 | 0.91 | 0.50–1.65 | 0 | |
| Total testosterone (nmol/L) | 4 | 824 | 1.02 | 0.95–1.08 | 0 | |
| SHBG (nmol/L) | 2 | 550 | 1.00 | 0.99–1.01 | 0 | |
| Free androgen index | 2 | 546 | 1.04 | 0.98–1.09 | 50.2% | |
| Fasting glucose (mmol/L) | 4 | 812 | 1.01 | 0.74–1.37 | 0 | |
| Fasting insulin (μU/mL) | 4 | 741 | 1.03 | 1.01–1.06 | 0 | |
| HOMA-IR | 4 | 736 | 1.14 | 1.03–1.25 | 0 | |
| Ferriman–Gallwey score for hirsutism | 3 | 705 | 0.91 | 0.21–3.9 | 66.8% | |
| Ovarian volume (mL) | 2 | 495 | 0.99 | 0.95–1.04 | 0 |
Meta-analyses of CC plus metformin versus CC
Live birth
IPD were available in eight RCTs comparing CC with metformin and CC alone, including 1039 women with PCOS. The forest plot of IPD meta-analysis on live birth is presented in Figure 3c. Compared with CC alone, there was insufficient evidence of a difference between CC with metformin and CC alone on live birth (5 RCTs, 907 women, RR 1.08, 95% CI 0.87–1.35, I2 = 5.6%, low certainty of evidence). Sensitivity analyses on studies with low risk of bias at allocation concealment and on treatment-naïve women showed very small treatment effects with wide CIs (3 RCTs, 714 women, RR 1.02, 95% CI 0.76–1.37, I2 = 33.2%; 5 RCTs, 662 women, RR 1.06, 95% CI 0.83–1.34, I2 = 3.9%) (Supplementary Table SII).
Secondary outcomes
Compared with CC alone, CC with metformin might improve clinical pregnancy (8 RCTs, 1039 women, RR 1.18, 95% CI 1.00–1.39, I2 = 6.9%, low certainty of evidence, Fig. 3b). There was insufficient evidence of a difference between CC with metformin and CC alone on ovulation, multiple pregnancy or miscarriage (Table II).
The summary Kaplan–Meier curve is presented in Figure 4b. Pooled analysis of HRs showed that compared to CC alone, CC with metformin might reduce time-to-pregnancy (7 RCTs, 898 women, HR 1.25, 95% CI 1.00–1.57, I2 = 0, low certainty of evidence).
Treatment–covariate interactions
Meta-analyses of effect modifications showed a positive interaction between baseline insulin levels and treatment effects on live birth in the comparison between CC with metformin and CC alone (interaction RR 1.03, 95% CI 1.01–1.06, 4 RCTs, 741 women, Fig. 5c). Such an interaction was consistent across studies (I2 = 0). This suggests that women with a higher baseline serum insulin level have larger treatment effects of CC with metformin versus CC alone on live birth, compared to women with a lower baseline serum insulin level. Such an interaction was also presented in a weighted mean curve with 95% CI (Fig. 5d). Additional meta-analysis of interactions for HOMA-IR was performed as requested during the peer review process, and it also showed a positive interaction between baseline HOMA-IR and treatment effects on live birth in the comparison between CC with metformin and CC alone (interaction RR 1.14, 95% CI 1.03–1.25, 4 RCTs, 736 women, I2 = 0, Table III). Meta-analyses did not find any other treatment-covariate interactions (Table III).
IPD availability bias
With regards to IPD availability bias, network meta-analyses of 20 RCTs with IPD showed similar results to network meta-analyses of all eligible RCTs on both live birth and clinical pregnancy (Supplementary Table SIII). Therefore, the participants in RCTs with IPD were representative of all the eligible participants with PCOS. The transitivity assumption of network meta-analyses was considered valid as the interventions of interest and placebo/no treatment were jointly randomisable.
Discussion
Summary of evidence
This IPD meta-analysis showed that in women with PCOS, letrozole increased live birth rates compared to CC alone and the overall certainty of evidence was moderate. Such treatment benefits of letrozole compared to CC alone were more predominant in women with higher baseline serum levels of total testosterone. There was insufficient evidence of a difference between CC plus metformin and CC alone in live birth rates, and the overall certainty of evidence was low, mainly due to risk of bias and imprecision. The potential benefit of CC in combination with metformin compared to CC alone was more pronounced in women with higher baseline serum insulin or HOMA-IR levels. We did not find other treatment–covariate interactions on live birth for other pre-specified covariates including age, BMI, ethnicity, primary/secondary infertility, treatment history, Ferriman–Gallwey score for hirsutism, SHBG, free androgen index, fasting glucose levels or ovarian volume.
Strengths and limitations
Establishing the International Ovulation Induction IPDMA Collaboration facilitated a platform for key trialists in PCOS to collaborate and share the IPD of the primary trials. It provided us the opportunity to collect unpublished information of the primary trials including the details of randomisation and allocation concealment, treatment history, subgroup data and time-to-pregnancy. Such information allowed us to assess the quality of included trials precisely, to investigate treatment–covariate interactions and to take account of the time in the analyses. The findings of this IPD meta-analysis provide the best available up-to-date evidence.
Moreover, we applied a comprehensive search strategy without language restrictions and updated the search after completing data requesting in case we missed the most recent RCTs. Of the newly identified RCTs, one compared CC plus metformin vs CC in 128 women but did not report live birth (Fatima et al., 2018), while the other one compared tamoxifen vs CC in 88 women (Topçu et al., 2017). Although we did not seek IPD from two RCTs identified after the data requesting deadline, adding IPD of these two studies is unlikely to change the main findings.
In addition, the investigation of subgroup effects includes within-study interaction only according to current statistical practice for IPD meta-analyses (Fisher et al., 2017) and therefore is free from ecological bias. For continuous covariates, without categorisation of the data, the statistical power was not compromised. Further illustration of interactions in weighted mean curve makes the interactions easier to interpret.
Nevertheless, this IPD meta-analysis has a few limitations. First, we were not able to access the IPD of all eligible studies. IPD were available for 32% (20/62) of the included trials, comprising 42% (3962/9356) of the eligible women with PCOS, and the proportions of IPD availability was higher for studies reporting live birth (44% trials including 65% eligible women, Supplementary Table SIII). This seems to be partly due to the long history of research on ovulation induction, with the first trial published in 1966. We were however able to access IPD of the highest-quality trials published within the last 15 years, and we did not detect evidence of availability bias. Second, most of the planned subgroup analyses were based on two to three of the included studies and therefore may still be underpowered due to the unavailability of data on relevant covariates and/or live birth. Some primary trials only included a relatively homogeneous ethnicity group, and therefore, IPD in such trials could not contribute to the analysis of treatment–ethnicity interaction as no within-trial interaction was available. Third, as treatment-resistant women were excluded from this IPD meta-analysis, the findings can be applied in clinical practice on the choice of first-line treatment only. Last, we planned a one-stage IPD meta-analysis in the protocol but decided to use a two-stage approach before the final analysis. A two-stage approach allows graphical presentations for both overall treatment effects and treatment–covariate interactions, which is important for clinical interpretation, while it is not obvious how best to present graphically the results of a one-stage model (Fisher et al., 2017). In addition, the two-stage approach automatically avoids ecological bias by accounting for within-trial interactions only (Fisher et al., 2017). Given the relatively large number of participants, low heterogeneity and overall good to moderate quality of included studies, we would expect both approaches to give very similar results.
Interpretations and clinical implications
The overall effects of letrozole and CC plus metformin vs CC on live birth and clinical pregnancy in this IPD meta-analysis were in agreement with existing systematic reviews (Franik et al., 2018; Morley et al., 2017; Wang et al., 2017) as well as the most recent international evidence-based guideline recommendations (Teede et al., 2018). Based on the findings of this IPD meta-analysis, letrozole can be recommended as the first-line ovulation induction medication in women with PCOS and infertility, provided off-label use is allowed and women are fully informed. Compared to CC alone, CC plus metformin may increase clinical pregnancy rates but the evidence on live birth was insufficient. Sensitivity analysis showed that the treatment effects on live birth seemed very small. The discrepancies between clinical pregnancy and live birth were likely due to the bias arising from low quality of studies which did not report live birth. Further evidence is needed to address this question.
Subgroup analyses showed that women with higher baseline serum levels of total testosterone may benefit more from letrozole compared to CC and women with higher baseline serum levels of insulin may benefit more from CC plus metformin compared to CC alone. Such positive interactions were consistent across trials and supported from a biological perspective. Letrozole has been introduced as an ovulation induction agent since 2001, and it inhibits aromatase, therefore increasing gonadotropin secretion by release of the hypothalamic/pituitary axis from estrogenic negative feedback and resulting in stimulation of ovarian follicle development (Mitwally and Casper, 2001). According to the recent ‘two triangles hypothesis’ for folliculogenesis in PCOS, pre-antral follicle growth is excessive due to intrinsic androgen excess that renders granulosa cells hypersensitive to FSH, with consequently excessive AMH expression (Dewailly et al., 2016) Therefore, hyperandrogenaemia may improve the response to letrozole by enhancing the sensitivity of FSH receptors. However, such an interaction was not observed in other biomarkers of hyperandrogenaemia or hirsutism. This is likely due to the fact that the severity of hirsutism does not correlate well with the magnitude of androgen excess, as hirsutism is an expression of hyperandrogenism on hair follicles mediated through different pathways from those affecting the ovaries and follicles (Escobar-Morreale et al., 2012). Metformin is an insulin-sensitising agent that decreases gluconeogenesis and lipogenesis and enhances peripheral glucose uptake and therefore increases insulin sensitivity (Naderpoor et al., 2015). The addition of metformin may further improve insulin resistance in women with higher fasting insulin or HOMA-IR levels and therefore improve pregnancy outcomes. We acknowledge that insulin levels are affected by many factors, ranging from physical activity and pre-test duration of fasting to sample handling and assay variability (Cassar et al., 2016). Therefore, the international evidence-based guideline does not recommend clinical measurement of insulin resistance at present due to the lack of accuracy (Teede et al., 2018). In addition, SHBG has been proposed as a measure of insulin resistance (Cassar et al., 2016), but the findings in our IPD meta-analysis did not support treatment-by-SHBG interactions. Our work provides preliminary evidence that there may be a role for assessing insulin resistance in PCOS and infertility and supports the need to assess insulin resistance in infertility studies.
We did not find ethnicity differences on treatment effects. This could be partly due to self-reported ethnicity without objective or DNA validation in all trials. We also did not find other treatment–covariate interactions on live birth for other pre-specified covariates including age, BMI, primary/secondary infertility, treatment history, Ferriman–Gallwey score for hirsutism, SHBG, free androgen index, fasting glucose levels or ovarian volume. Although analyses of subgroup effects were pre-specified in the protocol, these results should still be considered exploratory due to multiplicity.
Time is an important measurement for infertility outcomes, especially in the assessment of the effectiveness of multi-cycle treatments. However, time-to-event outcomes have seldom been reported in meta-analyses of infertility trials as fertility outcomes are usually considered as dichotomous outcomes and Kaplan–Meier curves are rarely presented. Our IPD meta-analysis used number of cycles as a measure of time and evaluated time-to-pregnancy by estimating HRs and presenting summary Kaplan–Meier curves. Time-to-event analysis takes time and censored participants into account and provides more accurate estimates of treatment effect. Our analyses on time-to-pregnancy were inconsistent with those of clinical pregnancy.
Research implications
IPD meta-analyses are useful to inform the design, conduct, analysis and interpretation of trials (Tierney et al., 2015). Given the consistent treatment benefits of letrozole across different fertility outcomes, future trials investigating new interventions for PCOS should choose letrozole as the reference arm. New trials are encouraged to incorporate treatment selection markers in their design to guide treatment decision (Janes et al., 2011), and the impact of these, including age, BMI and other biomarkers, needs to be confirmed in future trials. More specifically, biomarkers for hyperandrogenaemia and insulin resistance could be applied in trials that evaluate metformin. Due to the limited accuracy for measuring existing insulin resistance biomarkers, optimal methods to assess insulin resistance in future trials should also be considered.
Developing and implementing a core outcome set for infertility (Duffy et al., 2018) and PCOS should be recommended to ensure outcomes are reported and collected consistently across future trials on infertility and PCOS to reduce research waste.
Conclusions
Our IPD meta-analysis shows that in women with PCOS, letrozole improves live birth and clinical pregnancy rates and reduces time-to-pregnancy compared to CC alone. CC plus metformin may improve clinical pregnancy rates and may reduce time-to-pregnancy compared to CC alone, but there is insufficient evidence of a difference on live birth.
Treatment effects of letrozole are influenced by baseline serum levels of total testosterone while those of CC plus metformin are affected by baseline serum levels of insulin. These interactions between treatments and biomarkers on hyperandrogenaemia and insulin resistance provide further insights into a personalised approach towards the clinical management of anovulatory infertility related to PCOS and therefore should be confirmed in future studies.
Acknowledgements
We would like to thank Mr M. Draper from Barr Smith Library, University of Adelaide, for his assistance in developing the search strategies and Dr M. H. Zafarmand from University of Amsterdam for assisting with the translation. We would like to acknowledge all the investigators and participants of the primary trials. The investigators of individual trials are listed in Supplementary Table SIV. We would like to acknowledge the assistance of NICHD, the Reproductive Medicine Network (RMN) and the Protocol Subcommittee, in making the database for PPCOS I and II available. +The authors of the Reproductive Medicine Network are R.S.L., R.G. Brzyski, M.P. Diamond, C. Coutifaris, W.D. Schlaff, P. Casson, G.M. Christman, H. Huang, Q. Yan, R. Alvero, D.J. Haisenleder, K.T. Barnhart, G.W. Bates, R. Usadi, S. Lucidi, V. Baker, J.C. Trussell, S.A. Krawetz, P. Snyder, D. Ohl, N. Santoro, H.X. Barnhart, B.R. Carr, S.A. Carson, M.P. Steinkampf, P.G. McGovern, N.A. Cataldo, G.G. Gosman, J.E. Nestler, L.C. Giudice, P.C. Leppert, E.R. Myers, E. Eisenberg and H. Zhang. The details of their affiliations and NIH Grants are listed in Supplementary Table SV.
Authors’ roles
R.W., R.S.L., S.B., R.J.N., M.v.W. and B.W.M. conceptualised and designed the study. R.W., W.L., E.M.B., R.J.N., M.v.W. and B.W.M. collected the data. R.S.L., H.Z., X.W., J.G., L.M.P., R.H., T.E.K., E.M., S.K., W.H., N.P.J., S.A.A., W.V., S.P., A.F., U.O., H.N., C.D.W., G.F., J.L. and Y.S. provided and interpreted data from the included trials. R.W., W.L., E.M.B., M.v.W. and B.W.M. cleaned and analysed the data. R.W. drafted the first manuscript. All authors interpreted the pooled data, critically revised the manuscript for important intellectual content and approved the final version.
Funding
An Australian government research training programme scholarship (to R.W.); Australian National Health and Medical Research Council-funded Centre for Research Excellence in Polycystic Ovary Syndrome (APP1078444).
The funders had no role in study design, data collection and analysis, decision to publish or preparation of the manuscript.
Conflict of interest
R.S.L. reports consultancy fees from AbbVie, Bayer, Fractyl and Ogeda and research sponsorship from Ferring. N.P.J. has received conference expenses from Bayer Pharma, Merck Serono and Merck, Sharp and Dohme (MSD) and a research funding from AbbVie and Myovant Sciences and is a consultant to Vifor Pharma, Guerbet and Myovant Sciences. W.V. has received conference expenses from Ferring and Merck Serono, and his department has received research funding from Ferring and Merck Serono. S.B. is Editor in Chief of Human Reproduction Open and receives an honorarium and support for travel to conferences from Oxford University Press for his role. R.J.N. has received grant funding from Ferring and conference support from Merck. B.W.M. is supported by a NHMRC Practitioner Fellowship (GNT1082548) and reports consultancy for ObsEva, Merck and Guerbet. The other authors have no conflict of interest to declare.
