


Abstract
Is virtual reality (VR) an effective non-pharmacological tool to reduce procedural pain during hysterosalpingography (HSG)?
An HSG with VR does not reduce procedural pain scores compared to an HSG without VR.
An HSG is often experienced as painful and uncomfortable. VR has been proven successful to reduce acute procedural pain during a variety of medical procedures and interventions.
We performed a two-centre open-label randomized controlled trial between January 2021 and October 2022.
Women scheduled for HSG as part of their infertility work-up were screened for participation. After informed consent, women were randomized between HSG with or without VR. Due to the nature of the intervention, the study was not blinded. VR was administered by a head-mounted device displaying nature movies and/or relaxation exercises. The primary endpoint was procedural pain measured using VAS (scale 0.0–10.0 cm). Procedural pain was divided into overall pain score and peak pain score during the procedure. It was measured immediately after HSG. Secondary endpoints included patient satisfaction, VR preferences, and adverse effects of VR.
We included a total of 134 women, 69 to the intervention group (HSG with VR) and 65 to the control group (HSG without VR). The mean VAS for peak pain was 6.80 cm (SD 2.25) in the intervention group versus 6.60 cm (SD 2.40) in the control group (mean difference 0.28 (95% CI −0.57, 1.12), P = 0.52). The mean VAS for overall pain was 5.00 cm (SD 2.10) in the intervention group versus 4.90 cm (SD 2.13) in the control group (mean difference 0.06 (95% CI −0.71, 0.84), P = 0.88). The expectation that VR would be a good distraction from pain during HSG was correlated with both overall and peak pain scores. When correcting for this expectation, we found that women in the intervention group reported significantly higher scores, both in peak (adjusted MD 0.58 (95% CI −0.81, 1.97), P = 0.021) and overall (adjusted MD 0.43 (95% CI −0.84, 1.71), P = 0.013) pain, compared to the control group. There were no differences in the prevalence of symptoms that were considered as adverse effects of VR.
The study was not blinded. Reasons for declining participation in the study were anxiety or wanting full control during HSG, which might have created selection bias. The distraction score possibly indicates that the level of VR immersiveness was not optimal due to the lack of sound and/or the type of VR applications. Future studies should investigate whether more immersive or interactive VR applications could decrease procedural pain scores during HSG.
Since VR does not reduce procedural pain, this additional tool should not be used during HSG.
There was no external funding for this study. KR and AvH report receiving a travel grant from Merck outside the scope of this study. BM is supported by a National Health and Medical Research Council (NHMRC) investigator grant (GNT1176437) and BM reports consultancy for Merck, Organon, and Norgine and travel and research funding from Merck. BM holds stock for ObsEva. CL reports receiving research grants from Merck, and Ferring. KD and VM report receiving travel and speaker’s fees from Guerbet and research grants from Guerbet. VM also reports research grants from Merck and Ferring. The remaining authors have nothing to declare.
The trial is registered prospectively in the Netherlands Trial Register (trialregister.nl registration number NL9203, currently accessible on trialsearch.who.int).
16-01-2021.
The first participant was enrolled on 19 January 2021.
Introduction
Infertility affects roughly one in six couples worldwide with the prevalence ranging between approximately 12.6% and 17.5% of the adult population. In the Netherlands, 11.4% of women wishing to conceive suffer from infertility. This can significantly compromise quality of life (van der Linden et al., 2004; Aarts et al., 2011; Cox et al., 2022). The most common causes of infertility include tubal pathology and pelvic adhesions. Therefore, evaluation of the Fallopian tubes is essential as part of the fertility work-up, especially in patients with an increased risk for tubal pathology (Bhattacharya et al., 2009; NICE, 2013). The traditional method for investigating tubal patency during fertility work-up is hysterosalpingography (HSG). During HSG, iodine-containing contrast is infused into the uterine cavity and subsequently into the Fallopian tubes. The contrast is visualized by fluoroscopy to determine whether it enters the abdominal cavity, indicating patency of the Fallopian tubes. HSG was initially introduced as a diagnostic test. However, a therapeutic effect has been proven in women with unexplained infertility, by increasing the chance of an ongoing pregnancy especially when oil-based contrast is used (Dreyer et al., 2017; van Rijswijk et al., 2020; Wang et al., 2020). Despite this, HSG can cause discomfort and pain during and immediately after the procedure, with average reported pain scores ranging from 3.7 to 5.0 cm on the visual analogue scale (VAS, scale 0.0–10.0 cm) (Dreyer et al., 2014; van Welie et al., 2019; Serrano González et al., 2022). The painful cramping sensations are caused by cannulation of the cervix with instruments, by distention of the uterine cavity due to infusion of contrast, by increasing the pressure in the Fallopian tubes, and by peritoneal irritation caused by contrast spillage into the abdomen (Hindocha et al., 2015). Since the different parts of the female reproductive system are innervated by different pathways and nerves, targeting the overall pain with local analgesics is challenging (Moore, 1982).
Several regimens of analgesics have been studied using various routes of administration, e.g. oral, topical (a spray on the cervix or intrauterine installation with analgesics), locally injected, and intravenous administration of analgesics. A meta-analysis by Hindocha et al. showed that topical and locally injected analgesics can reduce the median pain score during the procedure, whereas the most obvious pain reduction was established by intravenous opioids. However, because of potential cardiorespiratory adverse effects, administration of intravenous opioids requires continuous monitoring, making this a not attractive method of pain management to apply during HSG. In addition, it is important to note that the quality of evidence in the study was low to very low (Hindocha et al., 2015).
Virtual reality (VR), a non-pharmacological intervention, has been introduced in medical practice in the past couple of years and is increasingly used to reduce pain and anxiety. It creates a distraction from the present and diverts attention away from physical sensations by taking the user into a 3-dimensional virtual world, usually without any major adverse effects (Hoffman et al., 2011). VR for medical use has been proven successful in decreasing acute pain during different medical procedures and interventions, including a reduction in procedural pain during office hysteroscopy and episiotomy repair (JahaniShoorab et al., 2015; Mallari et al., 2019; Deo et al., 2021). During office hysteroscopy, similar medical instruments are used as during HSG. A speculum is inserted, after which a hysteroscope is inserted through the cervical canal, and fluid is used to achieve distention of the uterine cavity (Salazar and Isaacson, 2018). However, it is possible that during HSG more pain can be experienced compared to that during hysteroscopy. This is because, during HSG, the fluid travels from the uterine cavity, through the Fallopian tubes into the abdominal cavity whereas during hysteroscopy the fluid remains in the uterine cavity. This can result in larger quantities of fluid infusion during HSG, and therefore larger pressure build-up. Nonetheless, pain experienced during both procedures is considered mild to moderate in severity (Jones et al., 2007). It is therefore possible that VR could also be considered effective in reducing pain during HSG. This hypothesis is confirmed by a recently published study where VR was found effective in reducing pain during HSG. This study was performed with a small sample size (62 participants) which was based on a small aimed effect size (0.88). In addition, they did not provide any pain medication during HSG (Yılmaz Sezer et al., 2023). Aside from targeting pain, VR can also lead to lower stress scores (Bekelis et al., 2017; Mosso Vázquez et al., 2017) and anxiety scores (Hoxhallari et al., 2019; Yılmaz Sezer et al., 2023) as well as higher satisfaction scores during medical procedures (Haisley et al., 2020; Yılmaz Sezer et al., 2023).
Considering these favourable outcomes of VR on the perception of procedural pain, we hypothesized that the application of VR could reduce pain during HSG in infertile patients. Therefore, the aim of this study is to investigate whether VR is an effective non-pharmacological method to reduce pain during HSG in women undergoing infertility workup.
Materials and methods
Study design
This randomized controlled trial (RCT) was performed in one university hospital, with two locations, and one teaching hospital in the Netherlands. The study was approved by the institutional review board of the Amsterdam UMC, location VUmc (reference number 2020.0687). The trial was prospectively registered in the Dutch trial register (http://www.trialregister.nl; registration number NL9203).
Participants
All women referred for HSG were screened for eligibility. Women were eligible for study participation if they were evaluated for infertility and had sufficient knowledge of the Dutch or English language to read and understand the patient information sheet. Women were excluded from study participation if they had a history of surgery to the cervix, if they had undergone an HSG before, if they had a known allergy to iodinated contrast, or if they currently used antidepressants, sedatives, or analgesics on a daily basis.
Randomization
After providing written informed consent, participants were randomized between the HSG with VR (intervention) group or HSG without VR (control) group. Randomization was performed in a 1:1 ratio with variable block sizes varying from four to eight using the web-based system Castor (Castor Electronic Data Capture, Ciwit BV, Amsterdam, the Netherlands) and stratified per centre. Due to the nature of the intervention, blinding of participants and physicians was not possible.
Study procedures
The HSG was performed according to local standard procedure protocols. It was scheduled in the follicular phase of the menstrual cycle after cessation of menstrual bleeding, or after cessation of progesterone-induced bleeding in case of amenorrhea. According to local protocols, all women were advised to take non-steroid anti-inflammatory drugs such as naproxen or ibuprofen as pain management the evening before and 2 h before HSG. During the procedure, the patient was placed in lithotomy position after which a speculum was inserted. The cervix was cannulated with a cervical vacuum cup, a metal cannula (hysterophore), or an HSG balloon catheter, depending on the preference of the physician performing HSG and local availability. During infusion of approximately 10 ml of oil-based (Lipiodol Ultra Fluid®, Guerbet, Villepinte, France) or water-based (iodixanol, Visipaque®, General Electric Healthcare, Buc, France) contrast medium, four to six radiographs were obtained. The radiographs were examined by a gynaecologist and/or radiologist to evaluate the patency of both Fallopian tubes according to local protocols.
Participants assigned to the intervention group were given a short instruction of the VR headset prior to the HSG procedure. After meeting their physician and getting into lithotomy position on the radiology table, women placed the VR headset over their eyes. Participants were asked to wear the VR headset during the entire procedure, until all instruments were removed. Sound from the VR headset was switched off to enable participants to communicate with the physician performing the procedure at all times. A dedicated researcher was present during the entire procedure for technical support with the VR system. In case of complaints or potential adverse events of the VR headset, the participants were able to adjust or remove the headset themselves or ask for assistance from the dedicated researcher.
VR technology
The VR headset and software used in this study were CE-certified and obtained from SyncVR (SyncVR Medical B.V., Utrecht, the Netherlands). The head-mounted PICO G2 4K device (Pico Interactive Inc., San Francisco, USA) included a VR headset and a remote control (Fig. 1a). Participants were able to navigate the VR headset on their own using the remote control. However, if they felt unsure navigating the system, the researcher was able to take over control of the VR headset on a hand-held device. SyncVR Relax & Distract is a software module installed on the VR headset which enables patients to choose between approximately 20 relaxing movies and breathing exercises, all designed for use in medical practice (Fig. 1). Games, requiring movement of the participant, and movies with an element of surprise were removed from the library to decrease the chance of sudden movements during the HSG. It was thought that sudden movements were undesirable and unsafe for participants.
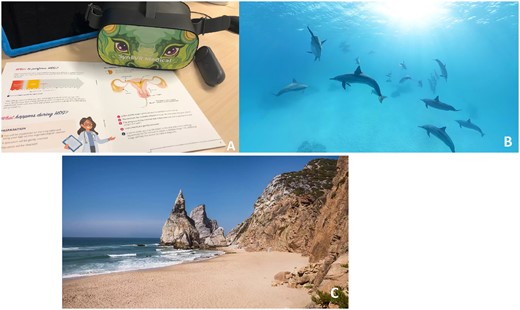
Virtual reality (VR) intervention and the installed VR applications. The VR applications were provided by SyncVR. (A) The head-mounted VR device (PICO G2 4K) with remote control. (B) Example of the nature movies. (C) Example of the breathing exercises.
Outcomes
The primary outcome of this study was procedural pain during HSG, divided into overall pain and most severe pain that participants experienced. Pain was measured using a VAS ruler (scale 0.0–10.0 cm) immediately after HSG. Secondary outcomes included use of oral analgesics within the first 24 h following HSG, VR experience and satisfaction, and VR-related adverse events (nausea, dizziness, headache, blurry vision). The anxiety level, VR expectations prior to HSG, and HSG-procedure characteristics were considered as possible confounding factors.
Data collection
Three questionnaires were distributed over the course of the study. First, all participants received a short questionnaire, usually distributed before randomization was performed, with an adapted version of the Amsterdam Preoperative Anxiety and Information Scale (APAIS; N. Moerman, F.S.A.M. van Dam, M.J. Muller, and J. Oosting) to determine their level of anxiety prior to the procedure. It additionally contained questions regarding their usage of oral analgesics prior to the procedure. In the second questionnaire, distributed immediately after the HSG procedure, participants were asked to score their overall pain level and their highest level of pain during the HSG procedure using a VAS-ruler (0.0–10.0 cm). The second questionnaire additionally contained questions on possible VR-related adverse events and evaluated participant satisfaction with the procedure. Participants in the intervention group received questions on their satisfaction with their chosen VR application. All questions used a 5-point Likert scale ranging from 1–5, where 1 represented ‘not at all’ and 5 represented ‘completely/all the time’. During the conduct of the study, both the first and second questionnaire were extended. The added questions inquired on VR expectations and expected preferences for the VR software before the procedure. These questions were distributed to women in both the intervention and control group. The second questionnaire was extended with questions on VR experiences after the procedure. Only women in the intervention group received the questions regarding VR experiences.
The final questionnaire was sent by email using Castor EDC to all participants 24 h after the HSG procedure. This last questionnaire inquired on adverse events or complaints, willingness to undergo the procedure again, and use of oral analgesics within the first 24 h after the procedure. All questionnaires can be found in the Supplementary Data File S1. Finally, medical details from the HSG procedure (e.g. the type and volume of contrast medium used, instrument used for instalment of contrast) and results of the HSG were collected from the electronic patient files.
Statistics
All data were analysed using IBM SPSS for Windows, version 26.0 (IBM Corp., Armonk, NY, USA). Baseline characteristics were presented using descriptive statistics with medians and interquartile ranges for non-normally distributed continuous variables, and with a mean and standard deviation (SD) for normally distributed continuous variables. Categorical variables were presented as absolute numbers and percentages. Continuous outcomes were analysed with the use of an independent t-test or the Mann-Whitney U-test as appropriate, whereas categorical variables were analysed with use of the chi-square test or the Fishers exact test. Two-sided P-values of less than 0.05 were considered to indicate statistical significance. Anxiety level, VR expectations, and use of analgesics were analysed as possible confounders prior to the procedure. The used instruments during HSG, type of contrast used, and HSG outcomes were analysed as possible confounders during HSG. A multiple linear regression model was fitted to assess the influence of the predefined confounders on the primary outcome measures. The significant confounders were subsequently used in an ANCOVA test to compare group means while controlling for the effects of these confounders.
Sample size
Based on previous research in a similar, Dutch population, we anticipated an overall pain score of 5.0 cm (in VAS, scale 0.0–10.0 cm) in the control group (Dreyer et al., 2017). We considered a reduction of 1.5 cm and a SD of 1.7 cm in pain score to be clinically relevant, which resulted in a calculated sample size of 134 women (67 in each group) with an obtained power of 80%, an alpha of 0.05, and a loss to follow-up rate of 5% using PASS (15.0.5).
Results
Between January 2021 and October 2022, a total of 211 women were screened for eligibility, of whom 140 women provided informed consent. We randomly allocated 71 women to HSG with VR (intervention group), and 69 to HSG without VR (control group). Five women ultimately did not meet the inclusion criteria and one woman did not undergo an HSG, leading to missing data with regards to our primary endpoints. This meant that there were 69 women in the intervention group and 65 women in the control group (Fig. 2). The two groups were similar in terms of baseline characteristics, except for the anxiety score prior to HSG which was 9.2 (SD 2.3) in the intervention group and 10.1 (SD 2.4) in the control group (APAIS range 3.0 to 15.0, P = 0.018). Bilateral tubal patency was seen in 52 out of 69 women in the VR group and in 52 out of 65 women in the non-VR group. All other baseline characteristics are shown in Table 1.
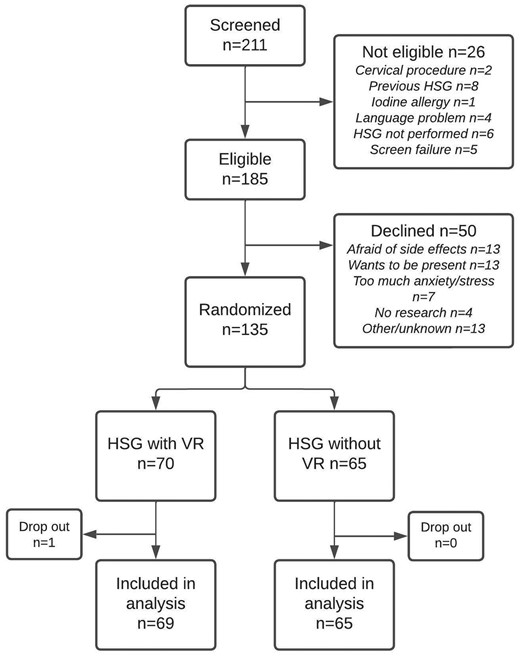
Flow chart of inclusions.
Baseline characteristics and HSG procedure details of all participants.
| Characteristic | Intervention n = 69 | Control n = 65 | P-value |
|---|---|---|---|
| Age (year) (median (IQR)) | 35 (5.00) | 35 (4.00) | |
| BMI (kg/m2) (mean (SD)) | 23.9 (4.4) | 24.6 (4.4) | |
| Duration of infertility (months) (mean (SD)) | 29.8 (15.4) | 27.0 (16.4) | |
| Primary infertility (%) | 47 (72.3) | 45 (65.2) | |
| Risk assessment for tubal pathology1 (%) | |||
| High risk | 11 (15.9) | 12 (18.5) | |
| Low Risk | 58 (84.1) | 53 (81.5) | |
| Cause of infertility (%) | |||
| Male factor | 7 (10.1) | 5 (7.7) | |
| Female factor | 12 (17.4) | 7 (10.8) | |
| Male and female factor | 1 (1.4) | 2 (3.1) | |
| Unexplained | 49 71.0) | 51 (78.5) | |
| Current smoker (%) | 3 (4.3) | 4 (6.3) | |
| Pain medication used prior to HSG (%) | 65 (94.2) | 62 (95.4) | |
| Type of pain mediation used (%)2 | |||
| Paracetamol/Panadol | 18 (36.5) | 12 (18.5) | |
| NSAIDs | 54 (78.3) | 56 (86.2) | |
| Opioids | 0 | 0 | |
| Other | 0 | 1 (1.5) | |
| Mean Anxiety score (APAIS) (mean (SD)) | 9.2 (2.3) | 10.1 (2.4) | 0.018 |
| Type of HSG instruments | |||
| Cervical vacuum cup | 42 (60.0) | 41 (63.1) | |
| Hysterophore | 5 (7.2) | 4 (6.1) | |
| Balloon catheter | 18 (26.0) | 18 (27.7) | |
| Multiple | 4 (5.8) | 2 (3.1) | |
| Type of contrast (%) | |||
| Oil-based | 66 (95.7) | 61 (93.8) | |
| Water-based | 3 (4.3) | 4 (6.2) | |
| Tubal patency (%) | |||
| Bilateral tubal patency | 52 (75.4) | 52 (80.0) | 0.481 |
| Unilateral tubal patency | 15 (21.7) | 9 (13.9) | |
| No tubal patency | 2 (2.9) | 1 (1.5) | |
| Unknown3 | 0 (0) | 3 (4.6) | |
HSG, hysterosalpingography; NSAIDs, non-steroidal anti-inflammatory drugs; APAIS, the Amsterdam Preoperative Anxiety and Information Scale (measured on a scale of 3–15).
Considered as high risk for tubal pathology were history of symptomatic Chlamydia Trachomatis infection, a positive chlamydia antibody test (CAT) on screening, history of Pelvic Inflammatory Disease (PID), history of endometriosis, history of surgery on ovaries or fallopian tubes, and a history of ectopic pregnancy.
Some patients used multiple types of pain medication.
HSG could not confirm bilateral tubal patency, e.g. because the HSG was stopped prematurely due to intravasation.
Worst and average pain during HSG
Women in the intervention group reported similar mean overall pain scores compared to women in the control group, with a score of 5.0 cm (SD 2.10) versus 4.9 cm (SD 2.13), respectively (mean difference (MD) 0.06 (95% CI 0.71, 0.84), P = 0.88). In addition, women in the intervention group reported a mean peak pain score of 6.8 cm (SD 2.25) whereas women in the control group reported a mean peak pain score of 6.6 cm (SD 2.40) (MD 0.28 (95% CI −0.57, 1.12), P = 0.52). There was no significant difference in time spent thinking about pain, between the intervention and control group (Table 2).
Primary outcome.
| Outcome | Intervention (n = 69) | Control (n = 65) | Mean difference (95% CI)1 | P-value2 |
|---|---|---|---|---|
| Overall pain (VAS) (mean (SD))3 | 5.0 (2.10) | 4.9 (2.13) | 0.06 (−0.71, 0.84) | 0.876 |
| Peak pain (VAS) (mean (SD))3 | 6.8 (2.25) | 6.6 (2.40) | 0.28 (−0.57, 1.12) | 0.519 |
| Time spent thinking about pain (mean (SD))4 | 3.3 (0.99) | 3.5 (1.10) | 0.159 | |
| Pain medication used within 24 h after HSG (%)5 | 0.360 | |||
| Yes | 9 (18.8) | 10 (21.3) | ||
| No | 37 (77) | 37 (78.7) | ||
| Unknown | 2 (4.2) | 0 | ||
| Type of pain medication used (%)6 | ||||
| Paracetamol | 3 (33.3) | 6 (60) | 0.317 | |
| NSAIDs | 8 (88.9) | 6 (60) | 0.779 | |
Pain scores (in VAS) immediately after HSG, measured in peak pain and overall experienced pain.
HSG, hysterosalpingography.
Statistics with use of the independent samples t-test.
Statistics with use of the Fisher’s exact test or chi-square test.
Measured using a VAS-ruler, scale 0.0–10.0 cm.
Reported for n = 68 intervention group, n = 63 control group, measured using a 5-point Likert scale.
Reported for n = 48 intervention group, n = 47 control group.
Reported for n = 65 intervention group, n = 62 control group.
Several factors were studied as confounding factors for the peak and overall pain scores, including the expectation that VR would provide distraction or pain relief, pre-HSG anxiety levels, tubal patency, instrument type, contrast medium usage, or prior VR experience (Supplementary Table S1). Since overall pain scores were notably affected by the expectation that VR would be an effective distraction tool, reported by 44 out of 57 women who were asked on their VR expectation, both peak and overall pain scores were adjusted for this influence. When adjusting for expected distraction, we found significant higher pain scores in the intervention group, compared to the control group. This was seen both in peak pain scores (adjusted MD 0.58 (95% CI −0.81, 1.97), P = 0.021) and in overall pain scores (adjusted MD 0.43 (95% CI −0.84, 1.71), P = 0.013) (Table 3).
Adjustment of peak and overall pain scores for the expectation of distraction, calculated using ANCOVA.
| Covariate | Adjusted mean (SD) | Mean difference (95% CI) | P-value | |||||
|---|---|---|---|---|---|---|---|---|
| Peak pain score | Overall pain score | Peak pain score | Overall pain score | Peak pain score | Overall pain score | |||
| Intervention | Control | Intervention | Control | |||||
| Expect distraction | 7.03 (0.45) | 6.45 (0.50) | 5.31 (0.41) | 4.88 (0.46) | 0.58 (−0.81, 1.97) | 0.43 (−0.84, 1.71) | 0.021 | 0.013 |
VR experience
A subset of women (n = 57) received an additional questionnaire. To the women who received VR during HSG (n = 30), questions were asked about their VR experience. All scores were measured on a 5-point Likert scale (scale 1–5). These women reported a mean score of 3.2 (SD 0.84) on being able to concentrate on the VR application and mean score of 3.5 (SD 0.76) on feeling distracted from the medical procedure by VR (Table 4). Women reported missing sound from the VR intervention with a mean score of 2.5 (SD 1.30). In total, 60% (18/30) of women in the subset that had received VR reported that their expectations regarding VR were fully met. As for the participants whose expectations were only partially met (11/30) or not met at all (1/30), they most frequently mentioned that pain predominated over VR or that the videos were insufficiently engaging.
Virtual Reality (VR) experiences.
| VR experiences | Total n = 301 |
|---|---|
| Distracted by VR (mean (SD)) | 3.54 (0.76) |
| Able to concentrate (mean (SD)) | 3.19 (0.94) |
| Feeling into the VR environment (mean (SD)) | 2.90 (1.14) |
| Missing sound (mean (SD)) | 2.50 (1.30) |
| Satisfaction with film options (%) | 14 (53.8) |
| VR expectations were met (%) | |
| Yes | 18 (60.0) |
| No | 1 (3.3) |
| Partially | 11 (36.7) |
Full questions (range 1–5, ‘not at all’ to ‘completely/all the time’): ‘To what extend did the movie(s) distract you from the HSG?’ ‘To what extend were you able to focus on the movie(s)?’ ‘There was no sound with the movie(s). Did you miss this?’.
These questions were answered by women from the subset (n = 57) that had received the VR intervention (n = 30).
Patient satisfaction and adverse effects
Satisfaction
Both women in the intervention group and in the control group reported comparable mean satisfaction scores on a 5-point Likert scale (4.1 (SD 0.84) vs. 3.8 (SD 1.02), respectively, P = 0.20). Moreover, women in the intervention group expressed a similar willingness to undergo another HSG with VR compared to the control group (3.4 (SD 1.35) vs. 3.6 (SD 1.37), respectively, P = 0.61). However, women in the intervention group indicated significantly lower willingness to undergo another HSG without VR compared to women in the control group (2.7 (SD 1.25) vs. 3.6 (SD 1.38), respectively, P = 0.01) (Table 5).
Patient satisfaction.
| Outcome | Intervention n = 30 | Control n = 27 | P-value |
|---|---|---|---|
| Satisfaction score (mean (SD)) | 4.12 (0.86) | 3.78 (0.90) | 0.197 |
| Another HSG with VR (mean (SD)) | 3.43 (1.35) | 3.61 (1.37) | 0.608 |
| Another HSG without VR (mean (SD)) | 2.73 (1.25) | 3.63 (1.38) | 0.005 |
| Advise an HSG with VR to others (mean (SD))1 | 4.23 (0.91) | N/A |
HSG, hysterosalpingography.
Full questions (range 1–5): ‘How satisfied are you with the HSG with/without VR?’ ‘Would you be willing to undergo another HSG without VR?’ ‘Would you be willing to undergo another HSG with VR?’ ‘Would you advise to use VR if someone else had to undergo HSG?’.
All measured using a 5-point Likert scale (scale 1–5).
Only answered by women in the VR group.
Adverse effects
There was no significant difference in symptoms that have been described as side effects from VR between women in the intervention group and in the control group (Supplementary Table S2). Seven patients removed the VR headset during the procedure. The reported reasons were discomfort (three patients), being nauseous (one patient), and too much pain from the procedure (three patients).
Discussion
This RCT showed that the use of VR during HSG did not reduce peak pain and overall pain. The expectation that VR would offer a distraction from HSG-related pain was found to be a confounding factor. After correcting for this confounder, significantly higher overall pain scores and peak pain scores were seen in the intervention group, compared with the control group. On the other hand, women receiving VR during HSG were significantly less willing to undergo a future HSG without VR than women not receiving VR.
Our study has several strengths. Patients were recruited from two locations of a university hospital as well as a non-academic teaching hospital, ensuring a diverse patient population. In addition to collecting pain scores, we included several confounding factors to study whether this might have affected experienced pain. Our study also has some limitations. A significant number of eligible women (50/185) declined participation in this study, potentially introducing a selection bias. Additionally, VR immersiveness was relatively low in the intervention group due to the absence of sound. According to previous studies, this might have reduced interactivity while this is known to enhance immersion and attentional involvement (Slater et al., 2009; Won et al., 2017; Di Guardo and Palumbo, 2022). Finally, there is a possibility that a placebo effect, nocebo effect, or Hawthorne effect could have influenced pain scores (Sedgwick and Greenwood, 2015; Colloca and Barsky, 2020). Because a randomized design was chosen for this study, we assume that this effect would have occurred equally in both groups which is confirmed by the fact that we found similar pain scores in both groups.
VR has been found to be effective in pain and/or anxiety management during labour (Frey et al., 2019; Wong et al., 2021; Carus et al., 2022; Ebrahimian et al., 2022). However, in gynaecological procedures other than labour the evidence is limited. Regarding the appliance of VR in outpatient gynaecological procedures, the results of our study are in line with the RCT by Fouks et al. (2022), where VR was applied during office hysteroscopy. They applied a similar VR intervention to ours, but with the addition of background sounds. VR did not result in lower pain scores during the procedure (median pain score 5.0 (NRS, range 0.0–10.0) in the intervention compared to the control group, P = 0.67). Contrary to our results, a recently published study applying VR during HSG found that women receiving VR reported significantly less pain during HSG, compared to the control group (1.81 vs 3.55, P = 0.02) (Yılmaz Sezer et al., 2023). They incorporated relaxing background music to the VR intervention. However, they excluded patients with procedural difficulties during HSG or VR discontinuation which may have introduced bias. Additionally, women did not receive any analgesics prior to HSG, whereas in our study 95% of participants used oral analgesics prior to HSG. Therefore, the effect of VR on pain reduction in our study could be too small to exceed the effect of the oral analgesics taken by most participants. However, a previous systematic review by Mallari et al. (2019) contradicts this as they stated VR was more effective when added to analgesics. Significant pain reduction was also seen in the study by Deo et al. (2021), where VR was applied during outpatient hysteroscopy (mean average pain 3.7 (SD 2.66) in the intervention group vs 6.0 (SD 2.62) in the control group, numeric rating scale 0.0–10.0, P = 0.01) and in the study by JahaniShoorab et al. (2015), where VR was applied during episiotomy repair (mean VAS 9.0 mm (SD 12.6) vs 23.6 mm (SD 19.8), VAS 0.0–100.0 mm, P = 0.04).
There are several explanations for the lack of effect in the reported pain scores in our study. One possibility is that the high expectations for VR to alleviate HSG-related pain by distraction were not met. Despite the randomized design of this study, it is possible that pain scores of women receiving VR during HSG were more influenced by the expectation that VR reduces pain, compared to women not receiving VR during HSG. This hypothesis is confirmed by the fact that, after correcting the pain scores for these expectations, pain scores were significantly lower in the control group. In addition, by disabling sound and interactive games, VR immersion was reduced, and this is now acknowledged to be an important contributing factor to successful pain reduction by VR application (Slater et al., 2009; Di Guardo and Palumbo, 2022). Finally, HSG can be more painful in women with tubal blockage, since this prevents outflow of contrast, therefore leading to intrauterine pressure build-up (Szymusik et al., 2015). However, the prevalence of bilateral tubal blockage in our study was very low in both groups and was not statistically significant confounding factor.
This study suggests that VR was not beneficial in terms of pain reduction during HSG. However, other studies regarding this subject have found a positive effect of VR on pain. Therefore, it is possible that only certain subgroups of patients could benefit from VR during gynaecological procedures, rather than all patients undergoing the procedure. In future studies, it could be beneficial to perform more research into the mechanism of action of VR in the field of Gynaecology and Reproductive Medicine. This way, subgroups of patients who would or would not benefit from VR can be identified. Distinguishing factors could be different coping strategies, e.g. wanting to have full control or wanting to be ‘absent’ during the procedure, or different levels of anxiety before the procedure.
In conclusion, VR does not reduce procedural pain experienced during HSG. More importantly, women who expected VR to distract them during HSG experienced more pain.
Data availability
The data underlying this article will be shared on reasonable request to the corresponding author.
Acknowledgements
We would like to thank all participating women in this study. We thank statistician Dr R. van Eekelen for his help with the analyses. We would also like to thank F. van der Breggen and R. Brouwer from SyncVR for their great help and technical support with the VR applications.
Authors’ roles
K.R., A.P.v.H., B.W.J.M., C.B.L., K.D., and V.M. designed the study. K.R., A.P.v.H., E.A.M.K., N.T., D.E.N.B.K., M.A.O., and R.v.d.I.J. were responsible for patient recruitment, the logistic aspects of the study, and data acquisition. K.R. and A.P.v.H. analysed the data. K.R. and A.P.v.H. drafted the manuscript together with K.D. and V.M. All authors critically read and approved this final version of the manuscript.
Funding
There was no external funding for this study.
Conflict of interest
K.R. and A.P.v.H. report receiving a travel grant from Merck outside the scope of this study. B.W.J.M. is supported by a National Health and Medical Research Council (NHMRC) investigator grant (GNT1176437) and B.W.J.M. reports consultancy for Merck, Organon, and Norgine and travel and research funding from Merck. B.W.J.M. holds stock for ObsEva. C.B.L. reports receiving research grants from Merck and Ferring. K.D. and V.M. report receiving travel and speaker’s fees from Guerbet and research grants from Guerbet. V.M. also reports research grants from Merck and Ferring. The remaining authors have nothing to declare.
