


Abstract
Does offering the Pleasure&Pregnancy (P&P) programme rather than expectant management improve naturally conceived ongoing pregnancy rates in couples diagnosed with unexplained infertility?
The P&P programme had no effect on the ongoing pregnancy rates of couples with unexplained infertility.
Underpowered studies suggested that face-to-face interventions targeting sexual health may increase pregnancy rates. The impact of an eHealth sexual health programme had yet to be evaluated by a large randomized controlled trial.
This is a nationwide multi-centre, unblinded, randomized controlled superiority trial (web-based randomization programme, 1:1 allocation ratio). This RCT intended to recruit 1164 couples within 3 years but was put on hold after having included 700 couples over 5 years (2016–2021). The web-based P&P programme contains psychosexual information and couple communication, mindfulness and sensate focus exercises aiming to help maintain or improve sexual health, mainly pleasure, and hence increase pregnancy rates. The P&P programme additionally offers information on the biology of conception and enables couples to interact online with peers and via email with coaches.
Heterosexual couples with unexplained infertility and a Hunault-prognosis of at least 30% chance of naturally conceiving a live-born child within 12 months were included, after their diagnostic work-up in 41 Dutch secondary and tertiary fertility centres. The primary outcome was an ongoing pregnancy, defined as a viable intrauterine pregnancy of at least 12 weeks duration confirmed by an ultrasound scan, conceived naturally within 6 months after randomization. Secondary outcomes were time to pregnancy, live birth, sexual health, and personal and relational well-being at baseline and after 3 and 6 months. The primary analyses were according to intention-to-treat principles. We calculated relative risks (RRs, pregnancy rates) and a risk difference (RD, pregnancy rates), Kaplan–Meier survival curves (live birth over time), and time, group, and interactive effects with mixed models analyses (sexual health and well-being).
Totals of 352 (one withdrawal) and 348 (three withdrawals) couples were allocated to, respectively the P&P group and the expectant management group. Web-based tracking of the intervention group showed a high attrition rate (57% of couples) and limited engagement (i.e. median of 16 visits and 33 min total visitation time per couple). Intention-to-treat analyses showed that 19.4% (n = 68/351) of the P&P group and 22.6% (n = 78/345) of the expectant management group achieved a naturally conceived ongoing pregnancy (RR = 0.86; 95% CI = 0.64–1.15, RD = −3.24%; 95% CI −9.28 to 2.81). The time to pregnancy did not differ between the groups (Log rank = 0.23). Live birth occurred in 18.8% (n = 66/351) of the couples of the P&P group and 22.3% (n = 77/345) of the couples of the expectant management group (RR = 0.84; 95% CI = 0.63–1.1). Intercourse frequency decreased equally over time in both groups. Sexual pleasure, orgasm, and satisfaction of women of the P&P group improved while these outcomes remained stable in the expectant management group. Male orgasm, intercourse satisfaction, and overall satisfaction decreased over time with no differences between groups. The intervention did not affect personal and relational well-being. Non-compliance by prematurely starting medically assisted reproduction, and clinical loss to follow-up were, respectively, 15.1% and 1.4% for the complete study population. Per protocol analysis for the primary outcome did not indicate a difference between the groups. Comparing the most engaged users with the expectant management group added that coital frequency decreased less, and that male sexual desire improved in the intervention group.
The intended sample size of 1164 was not reached because of a slow recruitment rate. The achieved sample size was, however, large enough to exclude an improvement of more than 8% of the P&P programme on our primary outcome.
The P&P programme should not be offered to increase natural pregnancy rates but may be considered to improve sexual health. The attrition from and limited engagement with the P&P programme is in line with research on other eHealth programmes and underlines the importance of a user experience study.
Funded by The Netherlands Organisation for Health Research and Development (ZonMw, reference: 843001605) and Flanders Research Foundation. C.B.L. is editor-in-chief of Human Reproduction. H.W.L. received royalties or licences from Prometheus Publishers Springer Media Thieme Verlag. J.B. received support from MercK for attending the ESHRE course ‘The ESHRE guideline on ovarian stimulation, do we have agreement?’ J.v.D. reports consulting fees and lecture payments from Ferring, not related to the presented work, and support for attending ESHRE from Goodlife and for attending NFI Riga from Merck. A.H. reports consulting fees by Ferring Pharmaceutical company, The Netherlands, paid to institution UMCG, not related to the presented work. H.V. reports consulting fees from Ferring Pharmaceutical company, The Netherlands, and he is a member of the ESHRE guideline development group unexplained infertility and Chair of the Dutch guideline on unexplained infertility (unpaid). M.G. declares unrestricted research and educational grants from Ferring not related to the presented work, paid to their institution VU Medical Centre. The other authors have no conflicts to declare.
NTR5709.
4 February 2016.
27 June 2016.
Introduction
Infertility or the inability to conceive after at least 1 year of unprotected intercourse, affects one in six heterosexual couples, and about half of them will seek medical help (Boivin et al., 2007, https://www.who.int/news-room/fact-sheets/detail/infertility, Zegers-Hochschild et al., 2017). At least one in four of the couples seeking medical help are diagnosed with unexplained infertility if no identifiable cause for their infertility is found (Brandes et al., 2010; Zegers-Hochschild et al., 2017). In case of a good prognosis, different international professional guidelines advise 6–24 months of expectant management as a first-line approach (Buckett and Sierra, 2019, https://www.nice.org.uk/guidance/CG156, NICE 2017, https://www.nvog.nl/wp-content/uploads/2018/02/Subfertiliteit-landelijke-netwerkrichtlijn-1.0-20-05-2011.pdf). As the term suggests, current expectant management lacks an active approach and support from professionals wished for by patients (Steures et al., 2005; Bhattacharya et al., 2008; van den Boogaard et al., 2011; Dreischor et al., 2022). This may subsequently contribute to the premature start of medically assisted reproduction, exposing couples to the unnecessary risks and burden associated with assisted reproduction, and pressuring healthcare systems pertaining to time and costs (van den Boogaard et al., 2011, 2012).
Sexual health depends, amongst others, on sexual functioning (e.g. absence of sexual dysfunctions) and sexual well-being (e.g. sexual pleasure) and is important for overall health, quality of life, and natural conception rates. We hypothesized that a web-based comprehensive educational programme focussed on sexual health, responding to the patient’s needs for a more active approach, could improve natural pregnancy rates (Boivin, 2003; Dancet et al., 2019; Dreischor et al., 2020). The rationale for the latter hypothesis is that suboptimal or reduced sexual functioning (e.g. reduced coital frequency) is a possible contributing factor to unexplained infertility (Wilcox et al., 1995; Wischmann, 2010; Perlis et al., 2013; Kucur Suna et al., 2016; Diamond et al., 2017; Mendonca et al., 2017; Capri-Workshop-Group, 2019; Coward et al., 2019; Capogrosso et al., 2021). This could also explain the findings of the two studies known so far, showing that face-to-face sex counselling improves natural conception rates in couples with unexplained infertility compared to expectant management (Sarrel and DeCherney, 1985; Tuschen-Caffier et al., 1999). Research, including patient interviews, indicates there is a need to focus on the sexual health of infertile couples (Wischmann, 2010; Capri-Workshop-Group, 2019; Starc et al., 2019; Dreischor et al., 2022). Nevertheless, as far as we know, there were no other evidence-based interventions targeting the sexual health (specifically sexual functioning or pleasure) of infertile couples continuing to attempt natural conception besides the two old studies with methodological limitations.
eHealth applications, such as web-based programmes, are considered to be a good alternative for face-to-face interventions, for example, to enhance convenience, reduce costs, or reduce barriers for uptake of psychosocial interventions (Lee and Hitt, 2020; Meyers and Domar, 2021). eHealth is increasingly recognized as part of gynaecologic healthcare, including fertility care (Aarts et al., 2012; Lee and Hitt, 2020) and is expected to become more acceptable after the forced adoption and normalization of telemedicine during the COVID-19 pandemic (Rotker and Velez, 2020). eHealth applications targeting lifestyle or mental health of infertile populations, have been found to reduce fertility-related distress, anxiety, depression, and sexual concerns, and have been associated with improved pregnancy rates (Cousineau et al., 2008; van Dijk et al., 2017; Clifton et al., 2020). For the success of eHealth applications, evidence-based approaches and patient engagement are of importance (Enam et al., 2018; Tossaint-Schoenmakers et al., 2021). Our group, therefore, first developed the new web-based ‘Pleasure&Pregnancy’ (P&P)-programme based on evidence, expert opinion, and patients’ needs (Dreischor et al., 2020) and now evaluates its effectiveness. The aim of the current study is to examine whether adding the web-based P&P programme to the standard of care of 6 months of expectant management versus expected management alone results in higher naturally conceived ongoing pregnancy rates by improving or maintaining sexual health.
Materials and methods
Study design, setting, and ethics
A nationwide, multi-centre, unblinded, two-arm, parallel-group, superiority randomized controlled trial was conducted. The study was carried out in the Netherlands between July 2016 and May 2022, whilst being coordinated and monitored by the Dutch Consortium for Healthcare Evaluation and Research in Obstetrics and Gynaecology (NVOG). The Medical Ethics Committee of Amsterdam University Medical Centre (METC 2015_317) and boards of directors from all participating centres approved the study. The detailed study protocol has been registered (NTR5709) and published (Dancet et al., 2019). Before the start of the RCT the Dutch patient association, Freya, and the Dutch Society for Obstetrics and Gynaecology (NVOG) confirmed their support for this research.
Participants
Heterosexual couples, with a female age between 18 and 39 years old, were eligible in case of a diagnosis of unexplained infertility (i.e. patency of at least one fallopian tube, being ovulatory and having more than three million progressive motile spermatozoa per ejaculate); (https://richtlijnendatabase.nl/richtlijn/orienterend_fertiliteitsonderzoek_ofo/startpagina_orienterend_fertilitietsonderzoek.html) and a Hunault-prognosis of at least 30% (https://www.freya.nl/probability.php, Hunault et al., 2004). Couples were excluded if their medical history detected an inability to have sexual intercourse, such as in cases of vaginismus or erectile dysfunction. Couples were not excluded based on risk factors for reduced sexual functioning (e.g. medication use, medical conditions) or mental health status.
Procedures, randomization, and blinding
Eligible couples were informed about the aim of the study, the novel P&P programme (without disclosing detailed content), and study procedures during face-to-face counselling by professionals involved in their fertility care (e.g. clinicians, study nurse). Internet literacy was assumed as they agreed to participate in a web-based programme. After both partners gave their consent in writing after the recruitment visit, recruiters contacted eligible consenting couples over the phone in order to randomly allocate them to a group. Diagnostic, demographic, and lifestyle background characteristics were entered in an electronic case report form prior to randomization.
A central web-based randomization programme randomized (non-stratified; 1:1 allocation ratio; permuted block design with block sizes of two, four, or six) couples between the P&P and the expectant management groups. Minimization ensured a balanced allocation within each centre. Allocation concealment was ensured by non-disclosure of the allocation sequence to the project group or recruiters. Blinding of participants and recruiters was not possible because of the nature of the interventions. However, the statistician was blinded.
Immediately after randomization, both partners of participating couples of both groups provided an email address on which they received a personal access code for filling out study questionnaires and, for the intervention group only, gaining access to the online P&P programme. The intervention group participants also chose a pseudonym to guarantee their privacy in group chat sessions at that point in time.
Interventions
The P&P group participants were advised to continue to attempt natural conception for at least 6 months whilst gaining access to the P&P programme for 6 months.
The expert opinion-, evidence-, and patient-driven P&P programme was developed based on the Medical Research Councils’ (MRC) framework and was built into a web-site by a team of software engineers and web-designers (https://www.peercode.nl/nl/welkom) (Craig et al., 2013; Dreischor et al., 2020). No changes were made to the P&P programme during the RCT, except from a software (security) update (January 2020; downtime of 2 h) and the replacement of a dysfunctional movie with a comparable one in Module 3 (September 2020).
The P&P programme is a comprehensive educational programme as it aims to improve knowledge and to train a range of skills (Boivin, 2003). The hypothesized mechanism of action was that the programme would help couples to maintain or even improve their sexual pleasure, and hence would increase coital frequency and pregnancy rates. The programme focused on sexual pleasure as fertility patients had shared that their fertility journey had turned sex into a duty rather than a desire-driven activity, and as experiencing pleasurable sex is important for the desire to have sex (Laan et al., 2021). Our paper on the development of the P&P programme reports in detail on the hypothesized mechanism of action, delivery characteristics (e.g. type of material and schedule), and content of the P&P-programme according to intervention taxonomy (Schulz et al., 2010; Dreischor et al., 2020). The P&P programme consists of eight progressive modules which become available with 2-week intervals (email prompts for both partners announced new modules) and remain available till the end of the 6-month period. The first six modules becoming available during the first 3 months are considered required to complete the programme, whereas the latter two modules were aimed to prevent relapse (i.e. reinforcing the knowledge and skills gained in the first six modules, ensuring retention of the established effect of the programme). Reading through a module takes about 10–15 min, but study participants will have differed in whether and how often they performed each exercise. Each module includes psychosexual education (n = 2–3), couple communication exercises (n = 2), solo and couple sensate focus exercises (n = 2–3), and a solo mindfulness exercise (n = 1) delivered via mixed media such as texts, videos, audio recordings, and drawings. Supplementary Table S1 describes the theme of each module and provides concrete examples of psycho-education and of each different type of exercise (Schnarch, 2004).
In addition to the modules, the P&P programme includes: (i) evidence-based information on the biology of conception, (ii) the possibility of patient-initiated interaction with coaches via email, and (iii) 2–3 email invitations (send at the latest 6, 12, and 24 weeks after randomization) to participate in moderated online group chat sessions with peers. A midwife researcher (E.A.F.D.) and a fertility doctor (F.D.) interacted with the participants via email and during the chat sessions on behalf of the team and consulted a sex therapist (E.L.) and/or gynaecologist (I.M.C.) if needed.
The control group was advised standard expectant management for at least 6 months without being offered interaction with health care staff, in line with the Dutch guideline (https://www.nvog.nl/wp-content/uploads/2018/02/Subfertiliteit-landelijke-netwerkrichtlijn-1.0-20-05-2011.pdf).
Follow-up and compliance
Follow-up was continued until 6 months after randomization in case of no pregnancy. Follow-up was continued until live birth in case of pregnancy, except that couples were no longer required to fill out the patient-reported outcome measure (PROM) assessing fertility-specific quality of life.
We registered non-compliance with the advice to delay medically assisted reproduction for 6 months after randomization for all randomized couples. Engagement with and attrition from the P&P programme were followed up by web-based tracking. Regarding engagement, the number, timing, and duration of visits to the online P&P programme were registered. Regarding attrition from the P&P programme, the timing of the last visit by one of the partners of a couple was registered for couples who did not complete the programme. Couples were considered to have completed the programme if one partner visited at least the first six modules, while the other partner visited at least one module. In line with CONSORT-eHealth guideline, an attrition diagram plotted the following over the eight modules of the P&P programme as a survival curve (Eysenbach, 2011): (i) the proportion of couples still logging in and (ii) the proportion of couples being considered among the most engaged users. The most engaged users were those couples who completed the programme and who (together) minimally spent the median amount of minutes on the modules (Cousineau et al., 2008).
Outcomes
The primary outcome was a naturally conceived ongoing pregnancy, defined as a viable intrauterine pregnancy of at least 12 weeks duration confirmed by an ultrasound scan (Braakhekke et al., 2014), within 6 months after randomization.
Secondary outcomes were live birth rate, time to pregnancy, and several PROMs assessing different domains of sexual functioning, coital frequency, sexual pleasure, and different measures of personal and relational well-being.
The gender-specific PROMs included the Female Sexual Function Index (FSFI) (Rosen et al., 2000; ter Kuile et al., 2006) and the International Index of Erectile Function (IIEF) (https://www.ysl.nl/fileadmin/ijsselland/folders_patientenvoorlichting/URO/Vragenlijst_Erectiele_Dysfunctie_voor_website.pdf, Rosen et al., 1997). The following PROMs were disseminated among both men and women: the Quality of Sexual Experience (QSE) (Sanders et al., 2013), fertility quality of life (FertiQoL; Core FertiQoL without treatment module) (Aarts et al., 2011). EuroQol-5 dimension 3 level version (EQ-5D-3L) (EuroQolgroup, 1990), Hospital Anxiety and Depression Scale (HADS) (Spinhoven et al., 1997), and the Revised Dyadic Adjustment Scale (R-DAS) (Busby et al., 1995). We relied on previously validated Dutch versions of the PROMS, or reciprocally translated the PROMs (R-DAS, QSE). PROMs were disseminated to both partners at baseline and 3 and 6 months after randomization. Non-responders were sent two email reminders and were contacted once by the local recruiter if needed.
Statistical analysis
The intended sample size was 1164 couples in order to detect a difference of 8% in ongoing pregnancy rate between the groups (two-sided test, power of 80%, α = 0.05; 10% clinical loss to follow-up) (Tuschen-Caffier et al., 1999; Steures et al., 2006; Dancet et al., 2019). No interim analysis has been performed.
Baseline characteristics were summarized for the P&P and expectant management group with descriptive statistics.
All statistical tests to examine intervention effects were two-sided and P-values ≤0.05 were considered to indicate statistically significant differences. All outcomes were analysed according to intention-to-treat principles. Pregnancy rates were expressed as relative risk and Kaplan–Meier survival curves for each treatment group were used to calculate differences in time to ongoing pregnancy. No imputation was considered for the primary or secondary outcomes. For the primary outcome, an additional per protocol analysis was performed. An exploratory subgroup analysis was performed to explore effects of the P&P programme on sexual desire, sexual pleasure, and coital frequency in the most engaged users.
PROMs were processed according to their manuals (Cappelleri et al., 1999, http://sites.cardiff.ac.uk/fertiqol/files/2015/02/fertiqol-Dutch.pdf, https://euroqol.org/wp-content/uploads/2023/11/EQ-5D-3LUserguide-23-07.pdf, 2018, https://meetinstrumentenzorg.nl/instrumenten/hospital-anxiety-and-depression-scale/, https://therelationshipdoc.org/pdf/RDAS.pdf, Rosen et al., 1997, 2000; Wiegel et al., 2005; Sanders et al., 2013). Means and mean change scores are reported. Linear mixed models or generalized linear mixed models were used to evaluate group (P&P vs expectant management group), time, and interactive effects on all PROMS in women and men separately, while adjusting for own baseline measurements. Couple analyses could not be performed due to limited complete-couple response rates.
Results
Between July 2016 and February 2021, 700 couples were randomized, and four couples withdrew their consent. Figure 1 shows the flow diagram of the study. The intended sample size of 1164 couples was not reached due to a recruitment rate, which was much slower than expected, which led to a depletion of research funds (see Supplementary Fig. S1 for the study’s recruitment chart). Non-compliance with the advice to delay medically assisted reproduction for 6 months and clinical loss to follow-up were, respectively, 15.1% and 1.4% for the complete study population.
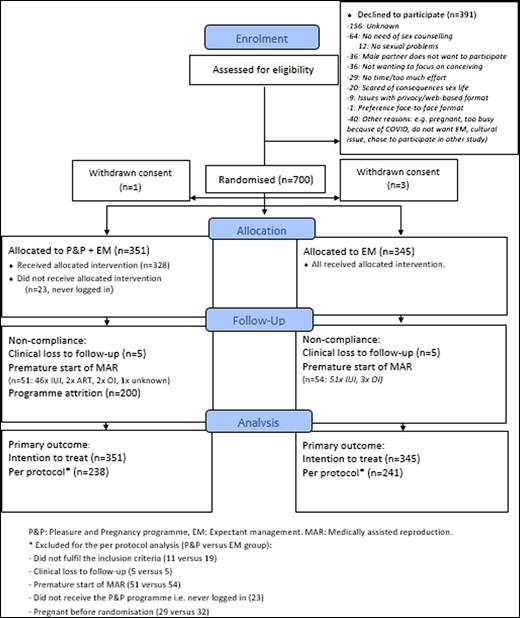
Study flow chart.
The baseline characteristics (Table 1) were equally distributed between the P&P and expectant management group, except for small differences in BMI and secondary infertility rate.
Baseline demographic and clinical characteristics.
| Pleasure&Pregnancy programme group | Expectant management group | |||
|---|---|---|---|---|
| (n = 351 couples) | (n = 345 couples) | |||
| Characteristics | Women | Men | Women | Men |
| Agea | 30.7 ± 3.3 (n = 351) | 33.8 ± 4.8 (n = 350) | 30.9 ± 3.5 (n = 345) | 33.4 ± 4.5 (n = 344) |
| BMIa | 24.8 ± 5.1 (n = 346) | 25.3 ± 4.0 (n = 321) | 23.9 ± 4.3 (n = 340) | 24.6 ± 3.5 (n = 307) |
| Obese | 51 (14.7%) | 33 (10.3%) | 34 (10.0%) | 23 (7.5%) |
| Intoxicationa | ||||
| Smoking | 38/350 (10.9%) | 61/344 (17.7%) | 38/340 (11.2%) | 58 (17.3%) |
| Alcohol | 172/350 (49.1%) | 260/342 (76.0%) | 168/338 (49.7%) | 251 (74.7%) |
| Drugs | 1/338 (0.3%) | 18/331 (5.4%) | 6/324 (1.9%) | 11 (3.2%) |
| Medication | 79/349 (22.6%) | 57/344 (16.6%) | 58/337 (16.8%) | 67/333 (20.1%) |
| Anti-depressive | 10 (2.9%) | 6 (1.7%) | 6 (1.8%) | 8 (2.4%) |
| Anti-diabetic | 1 (0.3%) | 4 (1.2%) | 0 (0%) | 3 (0.9%) |
| Anti-hypertensive | 4 (1.1%) | 5 (1.5%) | 0 (0%) | 7 (2.1%) |
| Previous Surgery | 115/349 (33.0%) | 123/339 (36.3%) | 130/340 (38.2%) | 115/336 (34.2%) |
| Gynaecologic | 42 (12%) | – | 46 (13.5%) | – |
| Urologic | 3 (0.9%) | 44 (13.0%) | 3 (0.9%) | 39 (11.6%) |
| Treatment specialist | 33/346 (9.5%) | 19/334 (5.7%) | 21/336 (6.3%) | 21/333 (6.3%) |
| Sexologist | – | – | – | – |
| Psychologist/psychiatrista | 6 (1.7%) | 1 (0.3%) | 1 (0.3%) | 1 (0.3%) |
| Education: | 137/227 (60.4%) | 129 (57.1%) | 156/225 (69.3%) | 121/204 (59.3%) |
| University degree or higher professional school | ||||
| Work status | (n = 315) | (n = 318) | (n = 311) | (n = 310) |
| Employed | 302 (95.9%) | 311 (97.8%) | 296 (95.2%) | 307 (99%) |
| Unemployed | 10 (3.2%) | 6 (1.9%) | 15 (4.8%) | 3 (1.0%) |
| Disabled | 3 (1.0%) | 1 (0.3%) | 0 (0%) | 0 (0%) |
| Infertility characteristics | ||||
| Duration in monthsa | 18.5 ± 5.8 (n = 351) | 18.2 ± 5.4 (n = 345) | ||
| Hunault Score | 40.8 ± 8.8 (n = 349) | 41.3 ± 8.7 (n = 345) | ||
| Secondary infertilitya(based on current or previous relationships) | 121/351 (34.5%) | 112/349 (32.1%) | 145/345 (42.0%) | 144/341 (42.2%) |
| -IUI conceived | 0 | 0 | 0 | 0 |
| -IVF conceived | 1 | 1 | 1 | 1 |
| One-sided tubal pathology (detected by HSG or laparoscopy) | 13/242 (5.4%) | – | 16/230 (7.0%) | – |
| Positive CAT | 28/296 (9.5%) | – | 24/301 (8.0%) | – |
| Total motile sperm counta | – | 68.6 × 10⁶ [37.5–131.6] | – | 70.5 × 10⁶ [30.6–141.9] |
Data are mean (SD), n/N (%) (N = number with valid data), median [IQR].
Characteristics that were compared between the P&P and EM group.
Outcomes of pregnancies conceived within study period.
| Intention to treat | Pleasure&Pregnancy programme group | Expectant management group | Relative risk |
|---|---|---|---|
| (n = 351 couples) | (n = 345 couples) | (95% CI) | |
| Naturally conceived ongoing pregnancies | 68 (19.4%) | 78 (22.6%) | 0.86 (0.64–1.14) |
| Live birth after natural conception | 66 (18.8%) | 77 (22.3%) | 0.84 (0.63–1.13) |
| All clinical pregnancies (MAR+naturally conceived) | 105 (29.9%) | 116 (33.6%) | 0.88 (0.72–1.11) |
| All ongoing pregnancies (MAR+naturally conceived) | 80 (22.8%) | 91 (26.4%) | 0.86 (0.67–1.12) |
MAR, medically assisted reproduction.
Web-based tracking showed attrition prior to completing the P&P programme among 57% of the couples in the intervention group. In addition, engagement with the P&P programme in the entire P&P group was limited as couples logged in for a median of 16 visits (range 0–192 times) and spent a median of 32.7 min in total (range 0–1696 min) on the website. Among the couples who completed the P&P programme, the median number of visits was 28 (9–192 visits) and the median time spent on the website was 68.3 min (2.0–1696 min) or 8.5 min per module. Supplementary Figure S2 shows that attrition from the P&P-programme and engagement with the P&P programme declined over modules and thus time. Sixty couples (17%; female and/or male partner) participated in 31 chat sessions and less than 5% of participants asked a question via email. Supplementary Table S2 shows the user metrics per module for all participants of the intervention group and for chat group participants only. Some participants, who dropped out, explained that they experienced the modules and/or questionnaires as burdensome (e.g. time consuming).
Pregnancy outcomes
No significant differences were found between the P&P and expectant management group in rates of ongoing pregnancies, live births, clinical pregnancy, or time to pregnancy (see Table 2 and Fig. 2). Naturally conceived ongoing pregnancy rates were 19.4% (68/351) in the P&P group and 22.6% (78/345) in the expectant management group, corresponding with a risk ratio of 0.86 (95% CI 0.64–1.14) and a risk difference of −3.24% (95% CI −9.28 to 2.81). A per protocol analysis did not indicate a significant difference between the groups.
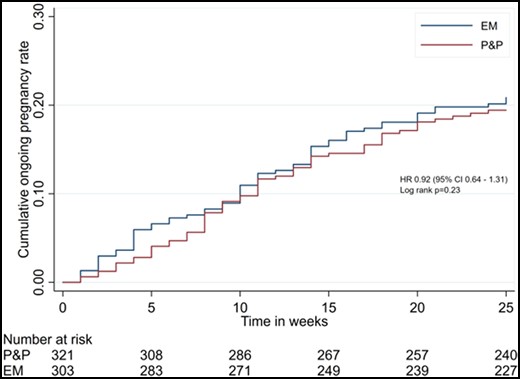
Kaplan–Meier survival curves of time to last menstrual period leading to a naturally conceived ongoing pregnancy in the Pleasure&Pregnancy (P&P) and Expectant Management (EM) group. Numbers at risk at baseline were adjusted due to censoring of the couples who became pregnant before randomization. EM, expectant management; HR, hazard rate; P&P, Pleasure&Pregnancy programme.
Means, mean change scores, standard deviations at baseline and follow-ups, and mixed models results of the change scores in the Pleasure&Pregnancy (P&P) and expectant management (EM) groups.
| PROMS | T0 | T1 | T2 | ΔT0-T1 | ΔT0-T2 | Time | Group | Interaction | |
|---|---|---|---|---|---|---|---|---|---|
| ♀ Sexual pleasure (P&P/EM) | n = 257/209 | n = 187/151 | n = 79/85 | n = 169/136 | n = 74/82 | ||||
| QSE (2–10) | P&P | 5.41 ± 0.74 | 5.44 ± 0.79 | 5.61 ± 0.79 | 0.05 ± 0.66 | 0.18 ± 0.59 | P = 0.8 | P = 0.04 | P = 0.04 |
| EM | 5.47 ± 0.85 | 5.41 ± 0.93 | 5.55 ± 1.01 | −0.05 ± 0.67 | 0.01 ± 0.94 | ||||
| ♂ Sexual pleasure (P&P/EM) | n = 153/121 | n = 109/68 | n = 34/45 | n = 92/61 | n = 33/41 | ||||
| QSE (2–10) | P&P | 5.55 ± 0.78 | 5.54 ± 0.74 | 5.67 ± 0.79 | 0.02 ± 0.64 | 0.22 ± 0.57 | P < 0.01 | P = 0.59 | P = 0.59 |
| EM | 5.45 ± 0.75 | 5.56 ± 0.73 | 5.64 ± 0.97 | 0.10 ± 0.68 | 0.21 ± 0.84 | ||||
| ♀ Sexual functioning (P&P/EM) | n = 317/264 | n = 201/170 | n = 139/126 | n = 194/160 | n = 133/121 | ||||
| Sexual dysfunction | P&P | 81 (25.6%) | 36 (17.9%) | 33 (23.74%) | – | – | P = 0.63 | P = 0.38 | P = 0.13 |
| EM | 59 (22.3%) | 44 (25.88%) | 32 (25.40%) | – | – | ||||
| Total score (2–36) | P&P | 28.82 ± 4.44 | 29.61 ± 4.04 | 29.20 ± 4.45 | 0.59 ± 4.15 | 0.21 ± 4.55 | P = 0.32 | P = 0.24 | P = 0.24 |
| EM | 29.00 ± 4.20 | 28.81 ± 4.92 | 29.28 ± 4.55 | −0.09 ± 3.40 | −0.01 ± 3.17 | ||||
| Desire (1.2–6) | P&P | 3.81 ± 0.99 | 3.94 ± 0.98 | 3.78 ± 1.00 | 0.08 ± 1.00 | −0.06 ± 0.97 | P = 0.70 | P = 0.72 | P = 0.72 |
| EM | 3.77 ± 0.94 | 3.73 ± 1.12 | 3.78 ± 1.05 | −0.04 ± 0.93 | −0.02 ± 0.98 | ||||
| Arousal (0–6) | P&P | 4.78 ± 1.03 | 4.90 ± 0.98 | 4.92 ± 0.98 | 0.07 ± 1.00 | 0.07 ± 0.93 | P = 0.17 | P = 0.70 | P = 0.70 |
| EM | 4.83 ± 1.00 | 4.81 ± 1.10 | 4.90 ± 0.97 | 0.02 ± 0.88 | 0.04 ± 0.90 | ||||
| Lubrication (0–6) | P&P | 5.45 ± 1.26 | 5.43 ± 0.81 | 5.45 ± 0.86 | −0.03 ± 0.80 | −0.01 ± 0.90 | P = 0.30 | P = 0.95 | P = 0.95 |
| EM | 5.56 ± 0.85 | 5.38 ± 0.91 | 5.45 ± 0.84 | −0.04 ± 0.79 | −0.02 ± 0.60 | ||||
| Orgasm (0–6) | P&P | 4.56 ± 1.29 | 4.69 ± 1.31 | 4.71 ± 1.31 | 0.18 ± 1.06 | 0.20 ± 1.18 | P = 0.03 | P = 0.02 | P = 0.02 |
| EM | 4.54 ± 1.41 | 4.56 ± 1.50 | 4.70 ± 1.46 | −0.03 ± 0.85 | 0.00 ± 0.84 | ||||
| Satisfaction (0.8–6) | P&P | 4.75 ± 1.06 | 4.96 ± 0.98 | 4.96 ± 0.96 | 0.15 ± 1.11 | 0.15 ± 1.11 | P = 0.26 | P = 0.03 | P = 0.03 |
| EM | 4.87 ± 1.00 | 4.86 ± 1.10 | 4.89 ± 1.08 | 0.01 ± 0.97 | −0.09 ± 1.01 | ||||
| Pain (0–6) | P&P | 5.48 ± 0.95 | 5.68 ± 0.59 | 5.47 ± 1.26 | 0.13 ± 0.83 | −0.12 ± 1.35 | P = 0.37 | P = 0.90 | P = 0.90 |
| EM | 5.59 ± 0.67 | 5.48 ± 0.86 | 5.56 ± 0.85 | 0.00 ± 0.76 | 0.09 ± 0.67 | ||||
| ♂ Sexual functioning (P&P/EM) | n = 269/210 | n = 133/102 | n = 81/75 | n = 126/91 | n = 78/65 | ||||
| Sexual dysfunction, n (%) | P&P | 19 (7.06%) | 15 (11.28%) | 8 (9.88%) | – | – | P = 0.14 | P = 0.74 | P = 0.53 |
| EM | 17 (8.10%) | 5 (4.90%) | 9 (12%) | – | – | ||||
| Total score (5–75) | P&P | 65.90 ± 6.19 | 65.75 ± 7.30 | 65.83 ± 6.76 | −0.90 ± 7.34 | −1.11 ± 6.74 | P < 0.01 | P = 0.49 | P = 0.49 |
| EM | 66.33 ± 6.10 | 66.00 ± 5.99 | 64.36 ± 9.02 | −0.60 ± 4.31 | −2.32 ± 6.92 | ||||
| Desire (2–10) | P&P | 7.66 ± 1.42 | 7.95 ± 1.49 | 7.91 ± 1.42 | 0.11 ± 1.40 | −0.01 ± 1.48 | P = 0.30 | P = 0.10 | P = 0.10 |
| EM | 7.51 ± 1.45 | 7.43 ± 1.47 | 7.00 ± 1.54 | −0.04 ± 1.31 | −0.35 ± 1.48 | ||||
| Erectile function (1–30) | P&P | 28.67 ± 2.63 | 28.44 ± 3.37 | 28.44 ± 2.64 | −0.19 ± 2.16 | −0.59 ± 2.21 | P = 0.20 | P = 0.51 | P = 0.51 |
| EM | 28.81 ± 2.42 | 29.15 ± 2.00 | 28.19 ± 4.35 | −0.36 ± 1.80 | −0.77 ± 1.64 | ||||
| Orgasm (0–10) | P&P | 9.74 ± 0.91 | 9.47 ± 1.41 | 9.60 ± 1.09 | −0.25 ± 1.45 | −0.13 ± 1.02 | P = 0.05 | P = 0.42 | P = 0.42 |
| EM | 9.80 ± 0.78 | 9.67 ± 1.05 | 9.59 ± 1.37 | −0.07 ± 0.80 | −0.08 ± 1.02 | ||||
| Intercourse satisfaction (0–15) | P&P | 11.93 ± 2.18 | 12.03 ± 2.24 | 11.80 ± 2.50 | −0.19 ± 2.16 | −0.59 ± 2.21 | P < 0.001 | P = 0.43 | P = 0.43 |
| EM | 12.05 ± 2.13 | 11.80 ± 2.32 | 11.61 ± 2.28 | −0.36 ± 1.80 | −0.77 ± 1.64 | ||||
| Overall satisfaction (2–10) | P&P | 7.89 ± 1.73 | 7.86 ± 1.79 | 8.07 ± 1.60 | −0.32 ± 1.58 | −0.41 ± 1.42 | P = 0.01 | P = 0.65 | P = 0.65 |
| EM | 8.15 ± 1.75 | 7.94 ± 1.88 | 7.97 ± 1.82 | −0.19 ± 1.65 | −0.37 ± 1.60 | ||||
| Coital frequency | P&P | 7.27 ± 2.74 | 6.81 ± 2.87 | 6.22 ± 3.34 | −0.59 ± 2.44 | −1.37 ± 2.74 | P < 0.01 | P = 0.47 | P = 0.47 |
| EM | 6.83 ± 2.78 | 6.35 ± 3.04 | 5.45 ± 2.96 | −0.73 ± 2.60 | −1.62 ± 2.64 | ||||
| ♀ Fertility-specific well-being (P&P/EM) | n = 317/267 | n = 186/155 | n = 121/115 | n = 179/147 | n = 117/112 | ||||
| Core FertiQoL (0–100) | P&P | 71.69 ± 12.88 | 69.71 ± 13.39 | 71.44 ± 13.11 | −2.15 ± 8.46 | −0.95 ± 10.18 | P < 0.01 | P = 0.74 | P = 0.74 |
| EM | 70.95 ± 11.78 | 69.74 ± 13.40 | 70.55 ± 13.56 | −2.02 ± 9.05 | −1.70 ± 9.22 | ||||
| ♂ Fertility-specific well-being (P&P/EM) | n = 268/213 | n = 121/93 | n = 72/64 | n = 115/82 | n = 68/58 | ||||
| Core FertiQoL (0–100) | P&P | 79.97 ± 10.7 | 79.04 ± 10.75 | 77.89 ± 11.24 | −2.13 ± 7.07 | −2.11 ± 6.79 | P < 0.01 | P = 0.77 | P = 0.77 |
| EM | 80.57 ± 9.19 | 77.88 ± 10.05 | 79.74 ± 11.81 | −2.60 ± 6.57 | −1.35 ± 8.57 | ||||
| ♀ Personal well-being (P&P/EM) | n = 321/275 | n = 209/183 | n = 152/141 | n = 202 | n = 172 | ||||
| EQ-5D VAS (0–100) | P&P | 80.16 ± 14.35 | 79.10 ± 13.60 | 78.20 ± 14.42 | −1.39 ± 15.89 | −1.54 ± 16.36 | P < 0.01 | P = 0.23 | P = 0.23 |
| EM | 81.29 ± 13.76 | 79.91 ± 15.60 | 78.06 ± 15.31 | −2.46 ± 15.92 | −3.63 ± 17.91 | ||||
| ♂ Personal well-being (P&P/EM) | n = 270/225 | n = 139/109 | n = 90/79 | n = 131/99 | n = 85/79 | ||||
| EQ-5D VAS (0–100) | P&P | 80.07 ± 11.81 | 81.35 ± 12.3 | 81.53 ± 12.07 | 2.26 ± 14.45 | 1.05 ± 16.22 | P = 0.81 | P = 0.06 | P = 0.06 |
| EM | 82.78 ± 12.31 | 79.92 ± 14.28 | 83.96 ± 11.77 | −3.73 ± 12.97 | 0.57 ± 12.11 | ||||
| ♀ Anxiety/Depression (P&P/EM) | n = 319/267 | n = 206/178 | n = 148/137 | n = 199/168 | n = 142/133 | ||||
| HADS total score (0–42) | P&P | 8.93 ± 5.59 | 8.93 ± 5.71 | 8.47 ± 6.09 | 0.24 ± 4.07 | 0.05 ± 4.94 | P = 0.59 | P = 0.85 | P = 0.85 |
| EM | 9.02 ± 5.66 | 9.08 ± 6.02 | 8.70 ± 5.85 | 0.27 ± 4.67 | −0.09 ± 4.72 | ||||
| ♂ Anxiety/Depression (P&P/EM) | n = 269/212 | n = 136/104 | n = 87/82 | n = 129/93 | n = 83/71 | ||||
| HADS total score (0–42) | P&P | 7.43 ± 4.98 | 7.74 ± 5.58 | 7.0 ± 4.87 | 0.47 ± 3.53 | −0.20 ± 3.20 | P = 0.54 | P = 0.96 | P = 0.96 |
| EM | 7.26 ± 4.63 | 7.35 ± 4.81 | 7.15 ± 5.58 | 0.22 ± 3.00 | −0.03 ± 4.15 | ||||
| ♀ Relational well-being (P&P/EM) | n = 319/267 | n = 206/178 | n = 148/138 | n = 199/168 | n = 142/134 | ||||
| RDAS total score (0–69) | P&P | 52.19 ± 5.79 | 52.47 ± 5.20 | 52.57 ± 5.27 | 0.04 ± 4.09 | 0.30 ± 4.41 | P = 0.79 | P = 0.16 | P = 0.16 |
| EM | 52.90 ± 5.49 | 52.70 ± 6.04 | 52.81 ± 6.05 | −0.43 ± 3.96 | −0.19 ± 3.74 | ||||
| ♂ Relational well-being (P&P/EM) | n = 269/214 | n = 136/105 | n = 88/82 | n = 129/94 | n = 83/71 | ||||
| RDAS total score (0–69) | P&P | 51.24 ± 5.95 | 51.71 ± 6.10 | 52.20 ± 6.44 | −0.59 ± 4.74 | 0.06 ± 4.12 | P = 0.24 | P = 0.76 | P = 0.76 |
| EM | 51.57 ± 5.69 | 51.79 ± 5.91 | 51.10 ± 5.96 | −0.39 ± 4.55 | −0.38 ± 5.14 | ||||
EQ-5D, EuroQol-5D; FertiQol, fertility quality of life; HADS, hospital anxiety and depression scale; PROMS, patient-reported outcome measures; QSE, quality of sexual experience; RDAS, revised dyadic adjustment scale; T0, randomization; T1, 3 months after randomization; T2, 6 months after randomization.
Patient-reported outcome measures
In the current study population, the internal consistency was excellent (α > 0.9) for the total scores of the FSFI, IIEF, and FertiQol questionnaires, as well as the IIEF overall satisfaction domain. The internal consistency was good (α > 0.8) for all FSFI domains, the IIEF erectile function and orgasm domains, and acceptable (α > 0.7) for the IIEF intercourse satisfaction domain, both HADS subscales, and RDAS total score. Means (SD) in both groups of all PROMS at baseline (T0), 3 (T1), and 6 months (T2) after randomization, changes in mean scores, and the results of the mixed model analyses are presented in Table 3. Small differences were observed between the P&P and expectant management group in the baseline measurements of the FSFI-pain domain and EQ-5D VAS in men.
Sexual health outcomes
During the 6-month period, both groups showed a significant decline in intercourse frequency per month, from an average of seven times to six times per month, with no significant differences between the groups. Small significant group effects (P&P vs expectant management group) and interaction effect were found for female sexual health, indicating that women in the P&P group experienced improved sexual pleasure, orgasm (frequency/difficulties/satisfaction), and satisfaction. In men, only time effects were found, suggesting reduced orgasm (orgasm and ejaculation frequency), intercourse satisfaction, and overall satisfaction in both groups. No significant differences in changes scores between the groups were found for the other sexual health outcomes in women or men. The subgroup analysis suggested an additional benefit among the most engaged users of the P&P programme (n = 76; spending ≥9 min per module) as compared to the expectant management group, as coital frequency decreased less, and male sexual desire improved instead of decreased (see Supplementary Table S3).
Personal and relational well-being outcomes
We did not find significant group or interactions effects of the P&P group versus expectant management group for the different well-being outcomes. In women, a time effect was present for the EQ-5D VAS score and Core FertiQoL indicating a decrease in women’s perceived health status and fertility-specific quality of life over time. In men, Core FertiQoL also decreased over time in both groups.
Discussion
We aimed to examine whether adding the web-based P&P programme to the standard care of 6 months of expectant management versus expected management alone results in higher naturally conceived ongoing pregnancy rates by improving or maintaining sexual health in couples with unexplained infertility and a good prognosis. This study showed that the P&P programme does not improve natural ongoing pregnancy rates and does not have an impact on live birth or time to pregnancy. Attrition prior to completing the P&P programme was high, and engagement was limited. Nevertheless, results indicate that the programme improved aspects of female sexual health, including sexual pleasure, orgasm, and satisfaction. Only in the most engaged users did the P&P programme reduce the decrease of coital frequency and improve male sexual desire. No effects of the P&P programme were found on personal or relational well-being.
As far as we know this is the first study examining the effects of a web-based sex education programme on pregnancy rates of infertile couples continuing to attempt natural conception. The stepwise approach in the development and evaluation of the P&P programme adds to the robustness of the study’s findings (Dreischor et al., 2022). Although the study did not reach the intended sample size, the achieved sample size was large enough to confirm the lack of a positive effect of the P&P programme on our primary outcome. We cannot rule out small effects of the P&P programme, but there is no biological plausibility for increased pregnancy rates in the expectant management group compared to the P&P group. Our Kaplan–Meier survival curves show that the difference in pregnancy rates originates from the first month of the study. Possible explanations for this difference include chance or the progressive nature of the P&P modules with the first two modules not focusing on coitus.
Another strength of this large study is the high follow-up rate for the primary outcome. Additionally, this study provides valuable information on the use of eHealth in infertile couples continuing to attempt natural conception and provides new insights into their sexual health. This is an area that has received little attention in recent Western fertility research.
We did not reach our intended sample size despite efforts to increase recruitment rates, such as developing counselling aids and adding more centres. This study was not preceded by a pilot study, which could have helped in anticipating recruitment rates. A major factor impacting recruitment was the unforeseen halt of patient care during the COVID-19 pandemic. Other factors contributing to slow recruitment included counselling difficulties due to the sensitive sexual health topic, couples’ lack of motivation or misconceptions, two other studies recruiting in the same Dutch patient population, staff shortages, and increasingly strict research regulations.
Despite our efforts to develop a programme based on the needs of infertile couples continuing to attempt natural conception (Dreischor et al., 2020, 2022), web-based tracking showed limited engagement with the P&P programme which is, however, in line with reports on other eHealth applications (Krebs and Duncan, 2015; Baumel et al., 2019; Clifton et al., 2020). Our specific study population of infertile couples sought medical help for their infertility, had a high level of education, and were not selected based on having sexual problems or concerns. This limits the generalizability to other infertile populations. Unfortunately, we did not register and assess the impact of ethnic or cultural background although 10% of the residents are born outside of Europe, and cultural and ethnic background are known to influence attitudes towards sexual health and education (Heinemann et al., 2016, http://www.cbs.nl, Wayal et al., 2017). All PROMS were measured with validated questionnaires, however, they should be interpreted with caution considering the limited complete response rates and the possible influence of study procedures (i.e. counselling and filling out questionnaires/sexual event logbook).
In contrast to our findings previous studies suggested that face-to-face sex counselling did improve pregnancy rates in infertile couples who are trying to conceive naturally (Sarrel and DeCherney, 1985; Tuschen-Caffier et al., 1999). The contrasting findings could be due to the important methodological limitations of the previous studies, or they could be due to the difference between the current and previous studies in intervention format (eHealth vs face-to-face), in compliance (lower vs higher), or in the frequency of sexual dysfunctions (less vs more). Our P&P programme did not increase coital frequency, which was hypothesized to be the mediator of its mechanism of action. Couples in our study may not have been motivated to use the P&P programme or change their sex life, as their main focus was on having a child and as they expected to receive fertility treatment within a few months. Additionally, couples were not selected based on experiencing sexual problems and therefore may not have seen direct benefits (Barley and Lawson, 2016). The pregnancy rates in our study were somewhat lower than in a comparable study population (Steures et al., 2006). However, pregnancy rates were comparable when also considering all pregnancies conceived between the diagnosis and calculation of Hunault score, and the time of randomization.
To our knowledge, the effects of programmes on the sexual pleasure of infertile couples or on the sexual functioning of infertile men have not been evaluated before. Our study found improvements in different domains of female sexual health, which is in line with studies investigating the effects of face-to-face counselling on the sexual functioning of infertile women (Vizheh et al., 2013; Karakas and Aslan, 2019; Sahraeian et al., 2019; Hosseini Nejad et al., 2023). The effects of our P&P programme were smaller and in fewer domains than those found for face-to-face counselling in infertile women with sexual problems or lower FSFI baseline score (Karakas and Aslan, 2019; Sahraeian et al., 2019). A comparable web-based programme did also have larger effects on the sexual functioning of women with sexual difficulties (Hucker and McCabe, 2015). In line with the results of our subgroup analysis, results from studies in women and men with a history of cancer, also indicate that engagement quantified by web-based tracking was associated with improvements in IIEF scores of men but not with FSFI scores of women (Schover et al., 2012, 2013). The findings of our subgroup analysis should, however, be confirmed in future RCTs. A recent pilot study found that an internet-based mind body intervention increased pregnancy rates and improved personal well-being outcomes, in a mixed population of infertile couples (i.e. different infertility diagnoses and treatment stages). In contrast to our programme, the latter programme provided personalized feedback after each module and was considered to be one of its most helpful components (Clifton et al., 2020).
Based on the results of this study, the P&P programme should not be offered to increase pregnancy rates in unexplained infertile couples continuing to attempt natural conception. However, future research is needed to explore whether programmes targeting sexual health could improve pregnancy rates of other infertile populations, such as couples with sexual dysfunctions or concerns or couples who are highly motivated to conceive naturally. To better understand the findings of this study and improve the programme, a user experience study is warranted. This should include investigating the associations between user characteristics, engagement with the programme, and effectiveness to determine optimal engagement (Donkin et al., 2011; Michie et al., 2017). Additionally, a longitudinal follow-up study should investigate the long-term effects on the sexual health of infertile couples. This could also help to determine the clinical relevance of the found effects. It is important to note that many women in the current study were at risk of sexual dysfunctions at baseline, and male sexual functioning decreased during the study period, highlighting the need for attention to sexual health in this population. Although the main request for help of infertile couples is having a child, couples and healthcare providers should be aware of the possible long-term consequences of infertility on sexual health (Wirtberg et al., 2007).
This large randomized controlled trial examined the effects of a web-based sex education programme, the P&P programme, in unexplained infertile couples continuing to attempt natural conception. Based on our findings, we recommend that the P&P programme should not be offered to increase pregnancy rates but may be considered to improve sexual health. It is likely that treatment effects were affected by high attrition prior to completing the P&P programme and by limited engagement among those completing the programme. Before the programme is implemented on a larger scale, more research is needed to determine user experiences.
Data availability
Data are available upon reasonable request.
Acknowledgements
We thank all the couples who participated in the trial, the staff members of the participating centres for their contribution to the recruitment of the P&P study, and the Dutch Consortium for Healthcare Evaluation and Research in Obstetrics and Gynaecology. A team of software engineers and web-designers of Peercode was involved in the development and hosting of the P&P website.
Authors’ roles
I.M.C., E.A.F.D., E.L., C.B.L., and M.v.W. designed the trial and applied for the research grant. I.M.C. and F.D. coordinated the trial. All authors contributed to the implementation of the study and inclusion of eligible couples. M.v.W. and F.D. performed the statistical analysis. F.D. drafted the paper and together with I.M.C., E.A.F.D., C.B.L., H.W.v.L., M.v.W., and M.G. interpreted the data. All authors critically revised and approved the final paper.
Funding
Netherlands Organization for Health Research and Development (ZonMW reference: 843001605); Flanders Research Foundation. The funders have no role in considering the design of the study, or collection, analysis, and interpretation of the data, or writing of the report.
Conflict of interest
C.B.L. is an editor-in-chief of Human Reproduction. H.W.v.L. received royalties or licences from Prometheus Publishers, Springer Media Thieme Verlag, and Arbeiderspers. J.B. received support from MercK for attending the ESHRE course ‘The ESHRE guideline on ovarian stimulation, do we have agreement?’ J.v.D. reports consulting fees and lecture payments from Ferring, not related to the presented work, and support for attending ESHRE from Goodlife and for attending NFI Riga from Merck. A.H. reports consulting fees by Ferring Pharmaceutical company The Netherlands, paid to institution UMCG, not related to the presented work. H.R.V. reports consulting fees from Ferring Pharmaceutical company, The Netherlands, not related to the presented work, and he is a member of the ESHRE guideline development group unexplained infertility and Chair of the Dutch guideline on unexplained infertility (unpaid). M.G. declares an unrestricted research and educational grants from Ferring not related to the presented work, paid to their institution VU medical centre. The other authors have no conflicts to declare.
References
Author notes
E Laan Author deceased.
