


Abstract
Is a commercially available embryo assessment algorithm for early embryo evaluation based on the automatic annotation of morphokinetic timings a useful tool for embryo selection in IVF cycles?
The classification provided by the algorithm was shown to be significantly predictive, especially when combined with conventional morphological evaluation, for development to blastocyst, implantation, and live birth, but not for euploidy.
The gold standard for embryo selection is still morphological evaluation conducted by embryologists. Since the introduction of time-lapse technology to embryo culture, many algorithms for embryo selection have been developed based on embryo morphokinetics, providing complementary information to morphological evaluation. However, manual annotations of developmental events and application of algorithms can be time-consuming and subjective processes. The introduction of automation to morphokinetic annotations is a promising approach that can potentially reduce subjectivity in the embryo selection process and improve the workflow in IVF laboratories.
This observational, retrospective cohort study was performed in a single IVF clinic between 2018 and 2021 and included 3736 embryos from oocyte donation cycles (423 cycles) and 1291 embryos from autologous cycles with preimplantation genetic testing for aneuploidies (PGT-A, 185 cycles). Embryos were classified on Day 3 with a score from 1 (best) to 5 (worst) by the automatic embryo assessment algorithm. The performance of the embryo classification model for blastocyst development, implantation, live birth, and euploidy prediction was assessed.
All embryos were monitored by a time-lapse system with an automatic cell-tracking and embryo assessment software during culture. The embryo assessment algorithm was applied on Day 3, resulting in embryo classification from 1 to 5 (from highest to lowest developmental potential) depending on four parameters: P2 (t3–t2), P3 (t4–t3), oocyte age, and number of cells. There were 959 embryos selected for transfer on Day 5 or 6 based on conventional morphological evaluation. The blastocyst development, implantation, live birth, and euploidy rates (for embryos subjected to PGT-A) were compared between the different scores. The correlation of the algorithm scoring with the occurrence of those outcomes was quantified by generalized estimating equations (GEEs). Finally, the performance of the GEE model using the embryo assessment algorithm as the predictor was compared to that using conventional morphological evaluation, as well as to a model using a combination of both classification systems.
The blastocyst rate was higher with lower the scores generated by the embryo assessment algorithm. A GEE model confirmed the positive association between lower embryo score and higher odds of blastulation (odds ratio (OR) (1 vs 5 score) = 15.849; P < 0.001). This association was consistent in both oocyte donation and autologous embryos subjected to PGT-A. The automatic embryo classification results were also statistically associated with implantation and live birth. The OR of Score 1 vs 5 was 2.920 (95% CI 1.440–5.925; P = 0.003; E = 2.81) for implantation and 3.317 (95% CI 1.615–6.814; P = 0.001; E = 3.04) for live birth. However, this association was not found in embryos subjected to PGT-A. The highest performance was achieved when combining the automatic embryo scoring and traditional morphological classification (AUC for implantation potential = 0.629; AUC for live-birth potential = 0.636). Again, no association was found between the embryo classification and euploidy status in embryos subjected to PGT-A (OR (1 vs 5) = 0.755 (95% CI 0.255–0.981); P = 0.489; E = 1.57).
The retrospective nature of this study may be a reason for caution, although the large sample size reinforced the ability of the model for embryo selection.
Time-lapse technology with automated embryo assessment can be used together with conventional morphological evaluation to increase the accuracy of embryo selection process and improve the success rates of assisted reproduction cycles. To our knowledge, this is the largest embryo dataset analysed with this embryo assessment algorithm.
This research was supported by Agencia Valenciana de Innovació and European Social Fund (ACIF/2019/264 and CIBEFP/2021/13). In the last 5 years, M.M. received speaker fees from Vitrolife, Merck, Ferring, Gideon Richter, Angelini, and Theramex, and B.A.-R. received speaker fees from Merck. The remaining authors have no competing interests to declare.
N/A.
Introduction
Embryo selection in human IVF is routinely based on subjective morphological criteria assessed by microscopical evaluation at certain pre-established times (Aparicio et al., 2013). This method has certain limitations, such as subjectivity of the embryologist (Adolfsson and Andershed, 2018), the variety of scoring systems deployed (Balaban et al., 2011), and the evaluation system itself, based on assessing embryo development from a static point of view at fixed times. As a result, these techniques are not very precise, resulting in variable and sometimes inaccurate embryo ranking and selection for transfer (Gallego et al., 2019).
Time-lapse technology allows not only the review of embryos at any time point, but has also introduced a new perspective on the study of embryo development: embryo development kinetics. In the last decade, numerous studies have focused on the search for morphokinetic markers that might be relevant to embryo viability and competency, and which could become potential biomarkers for embryo evaluation and selection (Motato et al., 2016; Bori et al., 2020; Chéles et al., 2020; Sciorio and Meseguer, 2021). An accurate embryo selection system could ultimately improve the efficiency of IVF cycles and reduce the number of double embryo transfers (Chéles et al., 2020).
The utilization and interpretation of all the information provided by time-lapse systems requires a highly qualified team and can be complex and time-consuming, which can be a problem given the limited time embryologists have due to their day-to-day workload. Moreover, even though interobserver variability can be reduced with time-lapse systems, it still exists if the annotations are made manually, especially when assessing newly described parameters (Bori et al., 2020).
The first automatic system for the analysis of images obtained through time-lapse was Eeva® (Early Embryo Viability Assessment) (Vermilyea et al., 2014). This technology was the first practical application of artificial intelligence in an IVF laboratory and it solves many of the previously described problems with the introduction of automation. The original Eeva System was an imaging system fitting inside a conventional incubator, recording a time-lapse video of embryo development using dark-field imaging (Auxogyn, now Progyny, USA) (Wong et al., 2010). It included a computer vision software automatically tracking embryo divisions from fertilization to Day 3, based on subsequential Monte Carlo methods, and recording cleavage timings (Wong et al., 2013). After data analysis, a significant increase was found in blastocyst formation rates when three parameters fell inside an optimal range: P1 (duration of the first cell cycle, t2–tPNf), P2 (duration of second cell cycle, t3–t2), and P3 (synchrony of second and third cell divisions, t4–t3). Based on these findings, the first version of the Eeva Test was published (Conaghan et al., 2013). This test used automatic annotations to feed a classifying statistical algorithm based on only two key morphokinetic timings: P2 and P3 (P1 was not found to be statistically significant). That algorithm classified each embryo on Day 3 as ‘high’ or ‘low’ according to its potential to reach the blastocyst stage depending on whether P2 and P3 fell or not into the pre-established optimal range (9.33–11.45 h for P2 and 0–1.73 h for P3). These parameters have subsequently been applied in other published algorithms for blastocyst prediction (Dal Canto et al., 2012; Desai et al., 2014; Kirkegaard et al., 2014; Motato et al., 2016).
A second version of the Eeva Test™ was introduced by Vermilyea et al. (2014). It used the same parameters as the previous version but introduced a new intermediate category by adding a new cut-off point to subdivide the former ‘low’ category into two, potentially increasing the selectivity of the test.
Even later, Eeva Test® was again improved with the release of Version 2.3 by Merck (Darmstadt, Germany), featuring a new classification algorithm named Xtend® (Frank, 2015). As opposed to former versions, the new algorithm is a multi-dimensional model based on four key parameters including P2, P3, oocyte age and cell count at Day 3, and giving each embryo a score from 1 (more likely) to 5 (less likely), based on their likelihood to reach blastocyst stage.
Next, Eeva Test® Version 3.0 was created, adapted to be operated in Geri+ time-lapse incubator (Genea Biomedx, Australia), an advanced version of Geri incubator including dark-field optics (Farrenkopf, 2017). However, this version employs the same classification algorithm as Version 2.3, allowing the same prediction algorithm to be used in different culture systems.
Although the Eeva Test® was originally developed to predict embryos’ potential to reach blastocyst stage at early developmental stages, strong associations were also found between the best Eeva categories and increased implantation rates in transferred embryos (Vermilyea et al., 2014; Aparicio-Ruiz et al., 2016). Although some algorithms developed to predict implantation potential focus on late predictive parameters such as blastocyst morphology and/or timing of blastulation (Desai et al., 2016; Goodman et al., 2016; Mizobe et al., 2017; KIDScore D5 (Vitrolife, Denmark)), some algorithms also include early morphokinetic parameters, as summarized in reviews on the topic (Gallego et al., 2019).
The aim of this study was to validate the efficiency of Eeva Test® Versions 2.3 and 3.0, not only as a predictor of blastocyst formation, but also as a predictor of more definitive outcomes such as implantation, live birth, and euploidy. Furthermore, the aim was to compare the performance of Eeva Test® with the traditional morphological classification, and with the combination of both systems.
Materials and methods
Study design and population
This project complies with Spanish government laws on assisted reproductive technology (14/2006) and has the approval of the IVI clinical research ethics committee with the code 2106-VLC-068-BA. It is a retrospective study, carried out with 5027 embryos, the products of 608 ICSI cycles performed at IVI Valencia from 2018 to 2021. Patients from oocyte donation (423) or autologous ICSI cycles subjected to genetic testing for aneuploidies (PGT-A, 185) were included in the study. All embryos were assessed by the Eeva Test, resulting in classification into scores from 1 (best) to 5 (worse) based on their morphokinetic characteristics. The performance of this classification method for blastocyst formation, euploidy, implantation, and live-birth potential was assessed. The performance for the last two outcomes was compared to those obtained with the conventional morphological classification used in the laboratory, ASEBIR (Asocicación para el Estudio de la Biología de la Reproducción) (ASEBIR, 2015), based on blastocyst morphology assessed by embryologists on Days 5 and 6. The flow chart of the study population is summarized in Fig. 1.
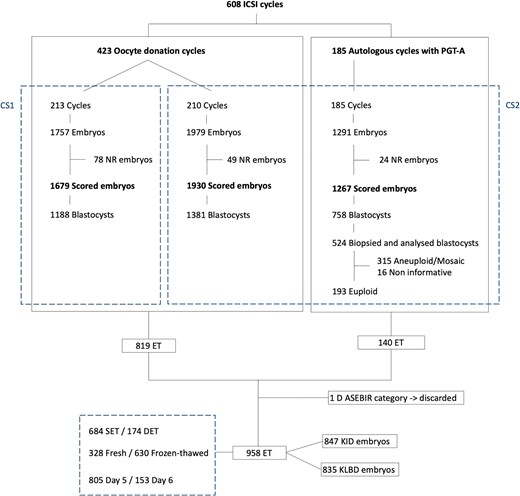
Flow chart of the study population. CS1: culture strategy 1: Sanyo MCO-5M incubator and sequential culture media and Eeva Test 2.3; CS2: culture strategy 2: Geri Connect and Geri Assess software 2.0 and single-step culture medium and Eeva Test 3.0; DET: double embryo transfer; ET: embryo transfer; KID: known implantation data; KLBD: known live-birth data; NR: no result; PGT-A: preimplantation genetic testing for aneuploidies; SET: single embryo transfer.
Ovarian stimulation and oocyte retrieval
In both patient groups, ovarian stimulation was performed with a GnRH antagonist protocol. In the menstrual cycle prior to stimulation, ovarian preparation was carried out with Estradiol Valerate (Progynova®, Bayer, Germany; Progyluton®, Bayer, Germany) 4 mg/day orally from the mid-luteal phase until the day of initiation of ovarian stimulation. Follicle-stimulating hormone (FSH; Bemfola®, Gedeon Richter, UK; Gonal-F®, Merck, Germany; Puregon, MSD, USA) was administered as a daily dose varying from 150 to 300 IU with or without associated menotropin (hMG, Menopur®, Ferring Pharmaceuticals, Switzerland), starting on Day 3 of the menstrual cycle. A daily 0.25 mg dose of GnRH antagonist (Cetrotide, Serono; Orgalutran®, MSD, USA) was initiated when a leading follicle of 14 mm was observed. Follicular growth was monitored by transvaginal ultrasound examinations every 48 h.
When at least three follicles reached 17 mm diameter, ovulation was triggered with 0.1 mg of subcutaneous triptorelin (Decapeptyl Monthly®, Ipsen Pharma, Spain) in the case of the oocyte donors, and with 0.2 mg of triptorelin or 6500 IU of hCG (Ovitrelle®, Merck Serono, Germany) in patients. Follicles were aspirated 36 h after triggering and corona-cumulus-oocyte complexes were washed in Sydney IVF Gamete Buffer® (Cook Medical, USA) and cultured in Sydney IVF Fertilization Medium® (Cook Medical, USA) at 5.5% CO2 and 37°C for 3–4 h.
Oocyte denudation and insemination
Oocyte denudation was carried out by mechanical pipetting in Sydney IVF Fertilization Medium (Cook Medical, USA) supplemented with 40 IU/ml hyaluronidase. After 2 h of culture in Sydney IVF Gamete Buffer, ICSI was performed in gamete medium (Cook Medical, USA) supplemented with HEPES at 400× magnification using an Olympus IX7 inverted microscope with Hoffman optics.
Embryo culture and evaluation
A total of 213 injected oocyte cohorts were subsequently cultured in Sanyo MCO-5M multi-gas incubator (Sanyo, Japan) equipped with a Progyny time-lapse camera (Progyny, USA) in Eeva dishes with capacity for up to 12 embryos. Dishes were filled with 100 µl drops of pre-equilibrated Cook sequential culture media (Cook Medical, USA) and covered in 3.5 ml of Life Global® mineral oil (Cooper Surgical, Denmark), with the media being changed from Sydney IVF Cleavage Medium® to Sydney IVF Blastocyst Medium® on Day 3. The remaining 395 embryo cohorts were cultured in a Geri+® time-lapse incubator (Genea Biomedx, Australia) in Geri Dishes® with capacity for up to 16 embryos, in 80 µl drops of pre-equilibrated Gems® single-step medium (Genea Biomedx, Australia) covered in 4 ml of Life Global® mineral oil. All 185 oocyte cohorts from PGT-A cycles were cultured using the latter strategy. In both cases, embryos were cultured until the blastocyst stage in a group culture setting at 37°C, 5.0% O2 and 5.5% CO2.
Fertilization assessment and embryo evaluation were performed through the remote viewing software of the corresponding time-lapse system: the Eeva Test platform or the Geri® Connect and Geri Assess 2.0. Fertilization was assessed between 17 and 20 h post-ICSI by the presence of two pronuclei and two polar bodies. On Day 3 (64–72 h post-ICSI), the number of cells was annotated. Embryo morphology was evaluated on Days 5 and 6, and scored following ASEBIR guidelines (ASEBIR, 2015). Blastocysts were classified from E (low quality) to A (top quality) based on the degree of expansion of the blastocele, size, shape and the degree of compaction of the inner cell mass, and the structure and number of cells of the trophectoderm. In addition, all embryos were classified by Eeva Test (with Version 2.3 for embryos cultured in Sanyo MCO-5M and Version 3.0 for embryos cultured in Geri+, both sharing the same algorithm), and classified with a numeric score from 1 (best) to 5 (worse) according to their likelihood to reach blastocyst stage.
PGT-A
In PGT-A cycles, embryos were subjected to assisted hatching on Day 3, after cell counting, with Hamilton-Thorne Lykos® laser. When they reached blastocyst stage, 5–6 trophectodermal cells were biopsied and their ploidy assessed by Next Generation Sequence (NGS) technology (Thermo Fisher Scientific, USA).
Embryo selection, transfer, and luteal support
The best (83.4%) or two best embryos from each cohort were selected for transfer based on conventional morphological criteria. In oocyte donation cycles, when at least one viable blastocyst was available, fresh embryo transfer was performed on Day 5 or 6, with the rest of the good-morphology blastocysts being cryopreserved by vitrification. Subsequent frozen-thawed embryo transfers were performed, when available, according to patient request. In PGT-A cycles, where all embryos were vitrified, euploid blastocysts assessed as the best by conventional morphological criteria were selected for warming and transfer. Additional frozen-thawed transfers were performed according to patient request if more viable euploid blastocysts were available. Frozen-thawed transfers were performed in substituted (91.4%) or natural cycles, according to the criteria of the clinicians. Luteal support was provided by a daily dose of micronized intravaginal progesterone (400 mg after fresh transfers and 800 mg following frozen-thawed transfers) (Progeffik, Effik, Spain).
Biochemical pregnancies were determined by measuring blood β-hCG level 11 days after embryo transfer. Implantation was confirmed at the eighth week of pregnancy by observation of gestational sac by ultrasound. Live birth was confirmed by direct communication of the patients.
Statistical analysis
Statistical analysis was performed using the Statistical Package for the Social Sciences 26 (SPSS Inc.). First, the performance of the Eeva Test for blastocyst formation was validated. Blastocyst rates were compared between different Eeva scores by ANOVA test and stratified by the type of cycle. The performance of the Eeva Test classification for the prediction of blastocyst development was assessed by generalized estimating equation (GEE), quantifying the association of the classification system with the outcome independently to possible confounders. This model considers multiple embryos from a single patient as an intra-subject variable, standardizing patient-related confounders. After testing many possible confounders, only the combination that formed the best-fitting model was included in the final analysis. Finally, a GEE model was created with Eeva scores as predictive variable and the following variables as possible confounders: the type of cycle (oocyte donation vs autologous-PGT-A) and culture strategy (CS) (CS1: Sanyo MCO-5M-sequential media and Eeva Test 2.3 vs CS2: Geri+-single-step media and Eeva Test 3.0). Additional GEE models were developed separately for oocyte donation and PGT-A cycles. The interaction between the Eeva Test and ASEBIR classification models was analysed by performing a GEE ordinal model with ASEBIR classification as the outcome, and the Eeva scoring, type of cycle and culture strategy as factors.
In PGT-A cycles, the euploidy rate was compared between the Eeva scores. The performance for euploidy prediction was assessed by another GEE model on the embryo population analysed by PGT-A with no additional confounders. In the GEE models, the odds of achieving a positive outcome were compared between embryos within each Eeva score with that of the embryos in the inferior score (Score 5).
The performance of the Eeva Test for implantation and live birth was evaluated by additional GEE models performed over two sub-datasets, including all transferred embryos derived from each ICSI cycle performed during the study period with known outcome (known implantation data (KID) or known live-birth data (KLBD)). These cases were defined as those where the number of gestational sacs or born babies matched the number of transferred embryos. Hence, implantation and live-birth outcomes were recorded for each transferred embryo as opposed to each transfer event. The GEE models for implantation and live birth included, as confounders, oocyte age, BMI of the oocyte provider (donor or patient), the type of transfer (fresh vs frozen-thawed), and the day of embryo transfer (Day 5 vs Day 6), in addition to the ones included in the blastocyst-prediction models. Once again, separate GEE models were built after stratification by type of cycle. The odds of implantation and live birth were compared between each Eeva score and the most inferior score. Additional Helmert contrast was performed, which compares each score to the mean of all the scores inferior to that one. Similar GEEs were modelled using ASEBIR classification as predictor instead of Eeva Test scoring in order to compare the performance of both classification systems. Finally, additional GEE models were created combining both classification systems to evaluate the combined performance of the two strategies when applied together.
The odds ratios (ORs) of the effect of the included in the GEEs on the outcome variables were expressed as 95% CI and statistical significance was considered for P-values <0.05. The possible effects of unmeasured variables were considered by providing the E-value for each OR, calculated using the online E-value calculator (Van Der Weele and Ding, 2017; Mathur et al., 2018). The E-value is a novel sensitivity analysis that represents the minimum strength of association on the risk-ratio scale that an unmeasured confounder would need to have to explain away a certain cycle-outcome association. Receiver operating characteristic (ROC) curves were graphed from the probability values obtained by the GEE models and the areas under the ROC curves (AUC) were calculated as model evaluation metrics.
Results
A general description of the study population, including cycle and demographic characteristics, is presented in Table I.
Descriptive and demographic characteristics of the cycles.
| Oocyte donations (n = 423) | Autologous PGT-A (n = 185) | Total (n = 608) | |
|---|---|---|---|
| Culture strategy (%) | |||
| CS1 | 213 (50.4) | 0 (0) | 213 (35) |
| CS2 | 210 (49.6) | 185 (100) | 395 (65) |
| Oocyte provider age (years) | 25.5 ± 4.5 | 39.0 ± 3.4 | 29.6 ± 7.4 |
| Partner age (years) | 42.5 ± 6.4 | 40.4 ± 5.7 | 41.8 ± 6.3 |
| Oocyte provider BMI (kg/m2) | 22.6 ± 3.2 | 23.5 ± 3.8 | 22.9 ± 3.4 |
| Oocyte state | |||
| Fresh | 289 (68.3) | 181 (97.8) | 470 (77.3) |
| Vitrified | 134 (31.7) | 4 (2.2) | 138 (22.7) |
| Days of stimulation (days) | 10.3 ± 1.5 | 11.1 ± 1.7 | 10.6 ± 1.6 |
| Total gonadotropin dose (IU) | 2152.2 ± 681.3 | 3242.4 ± 1359.9 | 2483.9 ± 1065.5 |
| Sperm provider | |||
| Partner | 368 (87) | 161 (87) | 529 (87) |
| Donor | 55 (13) | 24 (13) | 79 (13) |
| Retrieved oocytes (n) | 23.9 ± 11.8 | 11.7 ± 6.0 | 20.2 ± 11.8 |
| MII oocytes injected (n) | 11.4 ± 2.8 | 9.3 ± 4.9 | 10.8 ± 3.7 |
| Fertilized oocytes (n) | 8.9 ± 2.6 | 7.0 ± 4.0 | 8.3 ± 3.2 |
| Fertilization rate (%) | 79.5 ± 14.3 | 78.1 ± 17.7 | 79.1 ± 15.4 |
| Blastocysts (n) | 6.2 ± 2.4 | 4.2 ± 2.8 | 5.6 ± 2.9 |
| Blastocyst rate (%) | 71.2 ± 20.9 | 59.8 ± 26.8 | 68.2 ± 23.2 |
CS1, culture strategy 1: Sanyo MCO-5M incubator and sequential culture media and Eeva Test 2.3; CS2, culture strategy 2: Geri+ and single-step culture medium and Eeva Test 3.0; MII: metaphase II oocyte; PGT-A: preimplantation genetic testing for aneuploidies.
Blastocyst prediction
A total of 5027 embryos were analysed, with an overall blastocyst rate of 68.2% (71.2% in oocyte donation cycles and 59.8% in PGT-A cycles). The distribution of Eeva scores among all embryos in the study is shown in Fig. 2. There were 151 embryos (3%), which did not get a score by Eeva. Embryos from oocyte donation cycles got overall better (lower) scores than embryos from PGT-A cycles (2.8 ± 1.5 vs 3.2 ± 1.5; P < 0.001). As a comparison, the distribution of morphological grading by ASEBIR criteria in the total set of embryos was: 4.1%A, 29.9%B, 19.0%C, 16.5%D, and 30.5%E.
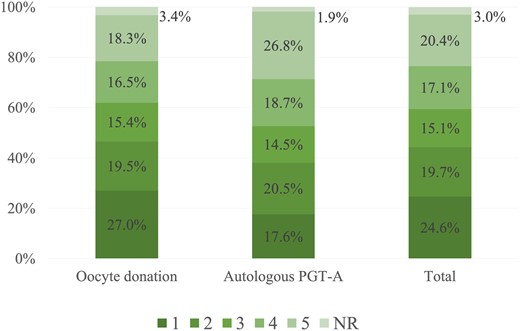
Distribution of Eeva scores in total embryo population and in each cycle type. NR: no result; PGT-A: preimplantation genetic testing for aneuploidies.
The blastocyst rate was significantly higher in the embryos with superior Eeva scores (P < 0.001) as shown in Table II. All pairwise comparisons of the blastocyst rates between consecutive scores were statistically significant (P < 0.05), except those between Scores 1 and 2. The increased blastocyst rate associated with superior Eeva scores was statistically significant in both oocyte donation and autologous PGT-A cycles. The predictive power of Eeva Test classification for blastocyst formation was confirmed by a GEE model in which the OR of each category was increasingly higher, as presented in Table III. The two variables considered as possible confounders (the type of cycle and the culture strategy) resulted in significant association with the likelihood of reaching blastocyst stage, favouring embryos from oocyte donation cycles and embryos cultured in a Geri+ incubator with single-step medium. Embryos scored as 1 had 15× higher odds of reaching blastocyst stage than embryos scored as 5. The ROC curves of the models are presented in Supplementary Fig. S1. The AUC of the model was 0.768 (95% CI 0.754–0.783) for the total set of embryos, 0.762 (95% CI 0.744–0.780) for the sub-population of embryos from oocyte donation cycles, and 0.757 (95% CI 0.729–0.784) for autologous embryos subjected to PGT-A.
Blastocyst formation rate per Eeva score.
| Eeva score | Oocyte donation | Autologous PGT-A | Total | |||
|---|---|---|---|---|---|---|
| n | Blastocyst rate (95% CI) | n | Blastocyst rate (95% CI) | n | Blastocyst rate (95% CI) | |
| 1 | 892/1008 | 88.5 (86.5–90.5) | 189/227 | 83.3 (78.5–88.2) | 1081/1235 | 87.5 (85.7–89.3) |
| 2 | 616/727 | 84.7 (82.1–87.3) | 213/265 | 80.4 (75.6–85.2) | 829/992 | 83.6 (81.3–85.9) |
| 3 | 452/574 | 78.7(75.4–82.1) | 127/187 | 67.9 (61.2–74.6) | 579/761 | 76.1 (73.1–79.1) |
| 4 | 379/618 | 61.3 (57.5–65.1) | 142/242 | 58.7 (52.5–64.9) | 521/860 | 60.6 (57.3–63.9) |
| 5 | 230/682 | 33.7 (30.2–37.3) | 87/346 | 25.1 (20.5–29.7) | 317/1028 | 30.8 (28.0–33.6) |
| P-value | <0.001a | <0.001a | <0.001a | |||
PGT-A: preimplantation genetic testing for aneuploidies.
P < 0.05 statistically significant difference between Eeva Test scores.
Generalized estimating equations assessing the association of Eeva scores with blastocyst formation.
| Type of cycle | Variable | OR | 95% CI | P-value | E-valueb |
|---|---|---|---|---|---|
| All cycles (4876 embryos) | |||||
| Eeva score | |||||
| 1 vs 5 | 15.849 | 12.510–20.078 | <0.001a | 7.43 | |
| 2 vs 5 | 11.592 | 9.229–14.560 | <0.001a | 6.27 | |
| 3 vs 5 | 7.247 | 5.796–9.060 | <0.001a | 4.83 | |
| 4 vs 5 | 3.49 | 2.862–4.256 | <0.001a | 3.14 | |
| Type of cycle (oocyte donation vs autologous PGT-A) | 1.63 | 1.313–2.024 | <0.001a | 1.87 | |
| Culture strategy (CS1 vs CS2) | 0.734 | 0.601–0.897 | 0.002a | 1.30 | |
| Oocyte donation (3609 embryos) | |||||
| Eeva score | |||||
| 1 vs 5 | 16.131 | 12.224–21.288 | <0.001a | 7.50 | |
| 2 vs 5 | 11.342 | 8.575–15.001 | <0.001a | 6.19 | |
| 3 vs 5 | 7.669 | 5.855–10.045 | <0.001a | 4.98 | |
| 4 vs 5 | 3.226 | 2.543–4.092 | <0.001a | 2.99 | |
| Culture strategy (CS1 vs CS2) | 0.731 | 0.597–0.896 | 0.002a | 1.62 | |
| Autologous PGT-A (1267 embryos) | |||||
| Eeva score | |||||
| 1 vs 5 | 14.807 | 9.299–23.576 | <0.001a | 7.16 | |
| 2 vs 5 | 12.194 | 8.247–18.030 | <0.001a | 6.44 | |
| 3 vs 5 | 6.301 | 4.212–9.426 | <0.001a | 4.46 | |
| 4 vs 5 | 4.227 | 2.954–6.050 | <0.001a | 3.53 | |
CS1, culture strategy 1: Sanyo MCO-5M incubator and sequential culture media and Eeva Test 2.3; CS2, culture strategy 2: Geri+ and single-step culture medium and Eeva Test 3.0; OR: odds ratio; PGT-A: preimplantation genetic testing for aneuploidies.
P < 0.05, statistical significance of variable–outcome association.
Minimum strength of association, on the risk-ratio scale, that an unmeasured confounder would need to have with both the treatment and outcome to fully explain away the variable–outcome association.
Figure 3 presents the distribution of ASEBIR blastocyst morphology categories within each Eeva score. The proportion of class A or B blastocysts (good-morphology blastocysts) increased as Eeva scores decreased: 54.7 (95% CI 51.9–57.5)% for Score 1, 45.4 (95% CI 42.4–48.6)% for Score 2, 33.6 (95% CI 30.2–37.0)% for Score 3, 24.0 (95% CI 21.2–26.9)% for Score 4, and 6.8 (95% CI 5.3–8.3)% for Score 5, P < 0.001. The inference model assessing the distribution of the ASEBIR grades in relation to the Eeva scores, apart from reflecting the obvious positive association of oocyte donation cycles and better morphological classification (OR = 1.757, 95% CI 1.471–2.099), and a negative association with the use of CS1 (OR = 0.735, 95% CI 0.625–0.864), demonstrated a positive association between better Eeva scores and better morphological classification: OR (1 vs 5) = 13.887 (95% CI 11.442–16.854); OR (2 vs 5) = 9.192 (95% CI 7.628–11.077); OR (3 vs 5) = 5.739 (95% CI 4.731–6.963); and OR (4 vs 5) = 3.202 (95% CI 2.654–3.864). All associations were statistically significant (P < 0.001).
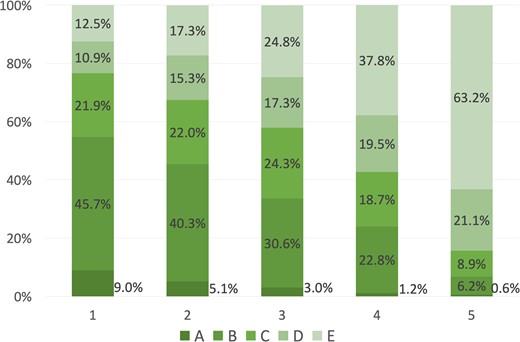
Distribution of ASEBIR blastocyst morphology categories within each Eeva score.
Euploidy prediction
In PGT-A cycles, 1267 embryos were classified by the Eeva Test. Of these, 524 embryos were later biopsied and subjected to PGT-A (41.4% biopsy rate), from which 193 were shown to be euploid (36.8% euploidy rate). No significant association was found between the Eeva Test scoring and the odds of euploidy in a GEE model (Supplementary Table SI). Euploidy rates (and 95% CI) in different Eeva scores were: 27.2 (20.0–34.4)% for Score 1, 45.2 (37.4–53.0)% for Score 2, 37.1 (27.5–46.7)% for Score 3, 39.3 (28.9–49.7)% for Score 4, and 33.3 (18.5–48.1)% for Score 5, P = 0.026. Although in total there were statistically significant differences between categories, there were no clear correlations between lower categories and higher euploidy rates, and the pairwise comparisons did not show statistically significant differences (P > 0.05).
Implantation and live-birth prediction
Implantation rates of KID embryos (n = 847) and live-birth rates of KLBD embryos (n = 835) in different Eeva scores are presented in Table IV. Only one embryo was classified as D by ASEBIR criteria and it was removed from the statistical analysis as an outlier. Both the implantation and the live-birth rates were statistically different between Eeva scores in the total transferred embryo population, with both outcomes being higher for embryos with the more superior score. However, the 95% CIs overlap between categories and the pairwise comparisons were not statistically significant (P > 0.05). This difference between scores was present in the oocyte donation sub-population, but not in the subset of autologous embryos subjected to PGT-A.
Implantation and live-birth rates per Eeva score.
| Eeva score | Oocyte donation | Autologous PGT-A | Total | |||
|---|---|---|---|---|---|---|
| n | Rate (95% CI) | n | Rate (95% CI) | n | Rate (95% CI) | |
| Implantation rate | ||||||
| 1 | 178/299 | 59.5 (53.9–65.1) | 17/25 | 68.0 (49.7–86.3) | 195/324 | 60.2 (54.9–65.5) |
| 2 | 105/187 | 56.1 (49.0–63.2) | 30/55 | 54.5 (41.3–67.7) | 135/242 | 55.8 (49.5–62.1) |
| 3 | 56/116 | 48.3 (39.2–57.4) | 11/25 | 44.0 (24.5–63.5) | 67/141 | 47.5 (39.3–55.7) |
| 4 | 28/64 | 43.8 (31.6–56.0) | 12/26 | 46.2 (27.0–65.4) | 40/90 | 44.4 (34.1–54.7) |
| 5 | 11/41 | 26.8 (13.2–40.4) | 5/9 | 55.6 (23.1–88.1) | 16/50 | 32.0 (19.1–44.9) |
| P-value | <0.001a | 0.459 | <0.001a | |||
| Live-birth rate | ||||||
| 1 | 142/293 | 48.5 (42.8–54.2) | 12/24 | 50.0 (30.0–70.0) | 154/317 | 48.6 (43.1–54.1) |
| 2 | 76/182 | 41.8 (34.6–49.0) | 25/54 | 46.3 (33.0–59.6) | 101/236 | 42.8 (36.5–49.1) |
| 3 | 46/116 | 39.7 (30.8–48.6) | 8/24 | 33.3 (14.4–52.2) | 54/140 | 38.6 (30.5–46.7) |
| 4 | 19/63 | 30.2 (18.9–41.5) | 9/26 | 34.6 (16.3–52.9) | 28/89 | 31.5 (21.9–41.2) |
| 5 | 6/44 | 13.6 (3.5–23.7) | 5/9 | 55.6 (23.1–88.1) | 11/53 | 20.8 (9.9–31.7) |
| P-value | <0.001a | 0.565 | <0.001a | |||
PGT-A: preimplantation genetic testing for aneuploidies.
P < 0.05 statistically significant difference between Eeva scores.
A GEE model was built to quantify the odds of achieving implantation or live birth according to the Eeva score when compared to Score 5 (Table V). The ORs for implantation were significantly higher in Scores 1 and 2 when compared to Score 5. Embryos with Scores 1 or 2 also presented increased chances of achieving implantation when compared to the mean of all the inferior scores, by the Helmert contrast (P < 0.001 and P = 0.006, respectively). Embryos in Scores 1–3 showed increased odds of live birth, both as compared to Score 5 (Table V) and to the mean of all inferior categories (P < 0.001, P = 0.013 and P = 0.027, respectively). Blastocysts which scored 1 had 2.92 increased odds of achieving implantation, and 3.317 increased odds of achieving live birth compared with blastocysts that scored 5.
Generalized estimating equations assessing the association of the Eeva scores with implantation and live birth, alongside other potential confounders, in the total set of transferred embryos with known implantation and/or live-birth data and after stratification by type of cycle.
| Type of cycle | Variable | Implantation | Live birth | ||||||
|---|---|---|---|---|---|---|---|---|---|
| OR | 95% CI | P-value | E-valueb | OR | 95% CI | P-value | E-valueb | ||
| All cycles | (n = 847 KID transferred blastocysts) | (n = 835 KLBD transferred blastocysts) | |||||||
| Eeva score | |||||||||
| 1 vs 5 | 2.920 | 1.440–5.925 | 0.003a | 2.81 | 3.317 | 1.615–6.814 | 0.001a | 3.04 | |
| 2 vs 5 | 2.345 | 1.175–4.681 | 0.016a | 2.43 | 2.445 | 1.185–5.041 | 0.015a | 2.5 | |
| 3 vs 5 | 1.796 | 0.861–3.748 | 0.118 | 2.02 | 2.217 | 1.033–4.759 | 0.041a | 2.34 | |
| 4 vs 5 | 1.536 | 0.706–3.344 | 0.279 | 1.78 | 1.527 | 0.675–3.454 | 0.31 | 1.78 | |
| Type of cycle (oocyte donation vs autologous PGT-A) | 0.703 | 0.365–1.355 | 0.293 | 1.67 | 0.565 | 0.291–1.098 | 0.092 | 1.99 | |
| Culture strategy (CS1 vs CS2) | 0.809 | 0.569–1.150 | 0.238 | 1.46 | 0.711 | 0.494–1.022 | 0.065 | 1.66 | |
| Type of transfer (FET vs fresh) | 0.952 | 0.675–1.342 | 0.778 | 1.18 | 0.983 | 0.687–1.407 | 0.925 | 1.1 | |
| Day of transfer (Day 5 vs Day 6) | 1.385 | 0.901–2.128 | 0.138 | 1.63 | 1.475 | 0.920–2.365 | 0.106 | 1.72 | |
| Oocyte age | 0.971 | 0.935–1.009 | 0.133 | 1.14 | 0.956 | 0.920–0.993 | 0.021a | 1.18 | |
| BMI (oocyte provider) | 1.034 | 0.987–1.083 | 0.163 | 1.15 | 1.023 | 0.974–1.074 | 0.364 | 1.12 | |
| Oocyte donation | (n = 707 KID transferred blastocysts) | (n = 698 KLBD transferred blastocysts) | |||||||
| Eeva score | |||||||||
| 1 vs 5 | 3.385 | 1.507–7.605 | 0.003a | 3.08 | 5.132 | 2.089–12.605 | <0.001a | 3.96 | |
| 2 vs 5 | 2.877 | 1.300–6.367 | 0.009a | 2.78 | 3.719 | 1.508–9.171 | 0.004a | 3.27 | |
| 3 vs 5 | 2.277 | 0.979–5.297 | 0.056 | 2.39 | 3.741 | 1.450–9.657 | 0.006a | 3.28 | |
| 4 vs 5 | 1.807 | 0.715–4.564 | 0.211 | 2.02 | 2.280 | 0.802–6.485 | 0.122 | 2.39 | |
| Culture strategy (CS1 vs CS2) | 0.827 | 0.580–1.180 | 0.296 | 1.43 | 0.721 | 0.499–1.041 | 0.081 | 1.64 | |
| Type of transfer (FET vs Fresh) | 0.996 | 0.703–1.412 | 0.984 | 1.05 | 1.022 | 0.709–1.473 | 0.909 | 1.12 | |
| Day of transfer (Day 5 vs Day 6) | 1.770 | 1.066–2.938 | 0.027a | 1.99 | 1.882 | 1.045–3.392 | 0.035a | 2.09 | |
| Oocyte age | 0.966 | 0.929–1.006 | 0.092 | 1.15 | 0.953 | 0.915–0.993 | 0.022a | 1.18 | |
| BMI (oocyte provider) | 1.050 | 0.997–1.105 | 0.066 | 1.18 | 1.038 | 0.980–1.099 | 0.204 | 1.16 | |
| Autologous PGT-A | (n = 140 KID transferred blastocysts) | (n = 137 KLBD transferred blastocysts) | |||||||
| Eeva score | |||||||||
| 1 vs 5 | 2.089 | 0.321–13.614 | 0.441 | 2.25 | 0.916 | 0.161–5.205 | 0.921 | 1.26 | |
| 2 vs 5 | 1.162 | 0.210–6.444 | 0.864 | 1.37 | 0.770 | 0.150–3.959 | 0.755 | 1.54 | |
| 3 vs 5 | 0.693 | 0.113–4.264 | 0.692 | 1.69 | 0.428 | 0.071–2.591 | 0.355 | 2.43 | |
| 4 vs 5 | 0.731 | 0.122–4.396 | 0.732 | 1.62 | 0.447 | 0.081–2.466 | 0.355 | 2.36 | |
| Day of transfer (Day 5 vs Day 6) | 0.640 | 0.263–1.558 | 0.325 | 1.86 | 0.847 | 0.341–2.104 | 0.721 | 1.39 | |
| Oocyte age | 1.016 | 0.909–1.136 | 0.778 | 1.1 | 0.976 | 0.875–1.090 | 0.669 | 1.12 | |
| BMI (oocyte provider) | 0.980 | 0.889–1.082 | 0.694 | 1.11 | 0.976 | 0.885–1.075 | 0.621 | 1.12 | |
BMI: BMI of oocyte provider (kg/m2); CS1, culture strategy 1: Sanyo MCO-5M incubator and sequential culture media and Eeva Test 2.3; CS2, culture strategy 2: Geri+ and single-step culture medium and Eeva Test 3.0; OR: odds ratio; PGT-A: genetic testing for anueploidies.
P < 0.05, statistical significance of variable–outcome association.
Minimum strength of association, on the risk-ratio scale, that an unmeasured confounder would need to have with both the treatment and outcome to fully explain away the variable–outcome association.
When stratifying by the type of cycle, the ORs showed that Eeva scores were predictive in oocyte donation cycles, but not in autologous PGT-A cycles. In the oocyte donation cycles, two other variables showed a significant effect in the likelihood of achieving a positive implantation or live-birth outcome: the day of transfer (embryos transferred on Day 5 had higher odds for both) and the oocyte provider's age, the latter of which was significant for the likelihood of live birth, but not for implantation. No variable showed a significant effect on the odds of achieving implantation or live birth in autologous PGT-A cycles.
Comparison with conventional morphological classification
Additional predictive GEE models were built for implantation and live-birth outcomes including conventional morphological classification as the predictive variable instead of Eeva Test scores, along with the same confounders used for the previous GEE models (Supplementary Table SII). Embryos classified into the top category (A) showed 3.155 and 2.469 × higher odds of achieving implantation and live birth, respectively, compared to embryos in Category C. Category B embryos also showed improved probability of achieving implantation and live birth compared to the lower Category C, but less than that of embryos in Category A. Again, that association was present in oocyte donation cycles but not in autologous PGT-A cycles, the same as in the Eeva Test GEEs.
A final set of GEE models were built combining both classification systems: ASEBIR and Eeva Test (Supplementary Table SIII). When both systems were included in the same model, both were shown to be predictive of implantation and live-birth outcomes, independently of each other. None of the classification systems were significantly associated with either outcome in embryo transfers derived from autologous PGT-A cycles. The ROC curves and AUC of each model are presented in Fig. 4. The highest AUC for each sub-population and outcome was always the model combining both ASEBIR morphology and Eeva morphokinetic classification, but the differences were not statistically significant.
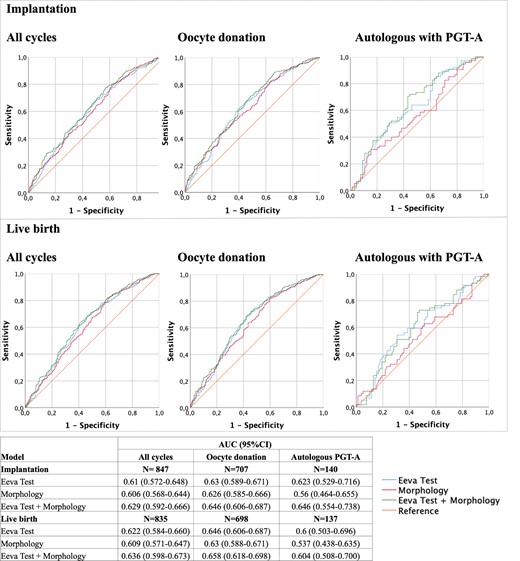
Performance metrics for the generalized estimating equations (GEEs) for implantation and live-birth prediction. Receiver operating characteristic (ROC) curves and area under the ROC curves (AUCs) of the GEE modelled for assessing the performance of the two classification systems, Eeva Test and morphological evaluation, as well as a combination of both, for implantation and live-birth prediction. PGT-A: preimplantation genetic testing for aneuploidies.
Discussion
To our knowledge, this study includes the largest dataset analysed with Eeva Test. The results not only confirm the ability of the Eeva Test to identify on Day 3 embryos with the highest potential to reach blastulation but also confirm its usefulness in embryo selection on Days 5 and 6, especially when used in conjunction with conventional blastocyst morphology assessment.
The main objective of this research was the validation of the latest Eeva algorithm with an independent dataset, as has been previously done with former versions. A first attempt at describing the clinical utility of the latest Eeva Test was published by Kokunai et al. (2021). However, the limited sample size and statistical analysis called for a more in-depth validation.
As described by Conaghan et al. (2013), the first version of Eeva Test had a 84.7% specificity and a 38.0% sensitivity for blastocyst prediction. In the said study, a significant improvement in embryo selection was shown when Eeva Test criteria were added to conventional morphological evaluation, as well as a decreased level of variability between different embryologists. This version of the test was validated by Diamond et al. (2015), showing improvement in blastocyst-prediction specificity from 39%, using only morphological criteria, to 76%, when combined with Eeva Test.
The second version of Eeva Test was validated by our group, demonstrating that embryos classified into superior Eeva categories had 2.014 times higher odds of achieving blastulation when compared with embryos classified into inferior categories (Aparicio-Ruiz et al., 2016). The results obtained in this study with the new algorithm compare or even surpass those achieved by the previous versions. In oocyte donation cycles, the Eeva algorithm had a 0.762 (95% CI 744–0.780) AUC for blastocyst prediction, compared to the 0.728 (95% CI 0.707–0.749) AUC obtained with the second Eeva Test version in the validation performed by Aparicio-Ruiz et al. (2016), with the confidence intervals barely overlapping. The results also show that the addition of two more categories into the classification further improved sensitivity of the test. Embryos classified in Score 1 had 15 times higher odds of achieving blastulation than embryos in the most inferior score, while only a 2 times higher odds were observed in Score High vs Low of the previous algorithm. Petersen et al. (2016) performed an external validation of seven algorithms for blastocyst prediction based on early morphokinetic annotations, achieving AUCs ranging from 0.620 (95% CI 0.610–0.631) for the first version of the Eeva Test (Conaghan et al., 2013) to 0.753 (95% CI 0.743–0.764) for the algorithm by Liu et al. (2016). Then, they proposed the first version of the KIDScore D3 algorithm, based on early morphokinetic annotations and cell count at 66 h, which achieved an AUC of 0.745 (95% CI 0.734–0.756). These data support that the Eeva Test has a performance comparable to the most successful algorithms for blastocyst prediction published up to date.
As for predicting implantation potential, Vermilyea et al. (2014) showed that embryos classified into Score High by the second version of Eeva Test had a 22% higher implantation rate than those classified into Score Low. In the external validation performed by our group (Aparicio-Ruiz et al., 2016), embryos from oocyte donation scored High had a 2.238 × higher odds of achieving implantation than embryos scored Low, confirming the predictive power of the test for this endpoint. The results presented in this study show an even improved ability of Eeva Test Versions 2.3 and 3.0 to identify embryos with higher implantation potential compared to previous versions. Transferred blastocysts in oocyte donation cycles with the best Eeva score (1) had 3.385 times higher odds of successful implantation than blastocysts with the inferior score (Score 5). Furthermore, the results show an even higher predictive power for live-birth prediction, the ultimate endpoint in assisted reproduction cycles, reaching an OR of 5.132 when comparing blastocysts with Score 1 to those with Score 5.
Long culture until blastocysts stage has now become a routine practice in many IVF laboratories. Consequently, new selection algorithms tend to use later morphokinetic events. Among the most relevant algorithms for selection at blastocyst stage, the one by Motato et al. (2016) uses two morphokinetic parameters: the synchrony in divisions of the third cell cycle (s3) and the time to reach the expanded blastocyst stage (tEB), reportedly performing with an AUC = 0.602 (95% CI 0.559–0.645), but, to our knowledge, it has not been validated externally. Another example is the scoring model published by Goodman et al. (2016), which uses, among other parameters, the start of blastulation (tSB) as a positively scoring variable. However, no AUC was reported for this model.
Overall, embryo selection algorithms based on automatic annotations have been reported to achieve AUCs around 0.650–0.7 depending on the type of cycles included, achieving a statistically significant ability to predict implantation or other endpoints, but only a relatively high one. None of these models show a statistically significant improvement over blastocyst morphological assessment when considering confidence intervals independence. In this study, Eeva classification also performed similarly to traditional morphological assessment for implantation prediction. However, these algorithms are not designed to replace morphological assessment, they are meant to be used as complementary tools, adding another level of evaluation. Our results show some degree of correlation between Eeva scoring and better blastocyst morphology, with a higher proportion of good-morphology blastocysts in superior Eeva scores and a higher probability of embryos becoming blastocysts with better morphology in the lower Eeva classification, demonstrated by GEE. However, only half the embryos in Score 1 were graded as good-morphology blastocysts. Kokunai et al. (2021), in their first attempt of testing the new Eeva algorithm, also found this discrepancy between the Eeva scoring and morphological assessment. This supports the notion that embryo features assessed by Eeva Test are not associated with morphology alone but may reflect other characteristics of the embryo, reaffirming the benefit of combining both methodologies for a complete embryo evaluation. Further proof of the complementary nature of the two methods is that both of these predictors were statistically significant in the combined GEE models for implantation and live-birth prediction, proving that their predictive value is independent of each other. Indeed, in this study, the best AUCs, for both outcomes, were found when combining both evaluation systems, although it cannot be considered a statistically relevant difference.
A statistically significant improvement is indeed difficult to achieve. The truth is the contribution we can make to the prediction of implantation by controlling embryo selection through these techniques is only so big; maternal factors playing an equally big role which is not being controlled. Hence, it is improbable that a bigger effect is achieved by using similar embryo selection techniques. Thus, to achieve statistical significance would require employing immense sample sizes to test these algorithms, which is limited by the IVF clinics. However, although not statistically significant, the improvement of >0.02 points in the AUCs, given the size of our dataset and the outcomes we are considering, is deserving of a mention. Ultimately, the contribution of these kinds of algorithms is related to the automation and objectivity they provide, making the work of the embryologists easier, faster, and less bound to intra- and interobserver variabilities.
Bori et al. (2022) presented an external validation of another predictive algorithm, KIDScore™ D5 v3, an evolved version of the KIDScore D3 model, now for selection at blastocyst stage, available for EmbryoScope and EmbryoScope+ incubators. Contrary to Eeva Test and the other aforementioned algorithms, the KIDScore™ D5 is designed as an embryo evaluation system independent of additional morphological evaluation, as it already includes trophectoderm and inner cell mass morphology as predictive variables, whereas the Eeva Test was developed as a complementary tool to morphological evaluation (Conaghan et al., 2013). In contrast to our results, Bori et al. (2022) did not find improvement in the AUC when combining traditional morphological evaluation and the embryo score provided by the KIDScore™ D5 v3 algorithm. In total, although no clear comparison can be made for lacking confidence intervals, the AUCs achieved by our combined morphology and Eeva Test models are similar, or slightly higher, than those achieved by Bori et al. with the KIDScore™ D5 v3 algorithm in oocyte donation cycles: 0.646 vs 0.633 for implantation and 0.658 vs 0.635 for live birth. The similar performance shown by these two models justifies the use of both indistinctly. They both are similarly valid options, each for the respective time-lapse incubator in which they can be used. The KIDScore™ D5 v3 algorithm might be more complete, as it combines morphological and morphokinetic assessments in a unique objective score. However, the Eeva Test is the first automatic decision algorithm that can be used in Geri+ incubators, so a more complete model that already includes morphological assessment with which we could compare its performance is not yet available.
The association found between higher implantation and live-birth rates and superior Eeva scores was only present in oocyte donation cycles but not in PGT-A cycles. Embryo selection based on morphokinetics is able to identify embryos with abnormal cell division patterns that would otherwise be considered optimal with conventional static evaluation. Reports suggest that the majority of embryos with abnormal cell divisions show multiple aneuploidies (Patel et al., 2016), a notion with which our results are partially in line. The predictive power of Eeva Test for implantation and live birth was statistically significant for non-PGT-A embryos but was lost once embryos were already identified as euploid; although the AUC of the GEE model for implantation in PGT-A cycles was similar to that obtained in oocyte donation cycles, the Eeva scores did not have a significant effect on the outcome. Likewise, Bori et al. (2022) failed to find a correlation between KIDScore™ D5 v3 algorithm scores and implantation rates in PGT-A blastocysts.
Although no autologous cycles without PGT-A were included in this study due to set clinical protocols at our clinic, our hypothesis is that the predictive power of Eeva Test would be even higher for them, due to expected higher prevalence of aneuploidies in non-PGT-A embryo cohorts with associated abnormal division patterns (Irani et al., 2019). However, embryo selection based on morphokinetics does not guarantee exclusion of chromosomal aneuploidies in blastocysts, as not all aneuploid embryos show abnormal division patterns. Many papers have found associations between diverse morphokinetic parameters and ploidy status of PGT-A embryos and even developed predictive algorithms for their detection (Chavez et al., 2012; Campbell et al., 2013; Basile et al., 2014; Minasi et al., 2016; Del Carmen Nogales et al., 2017; Desai et al., 2018; Meseguer and Pellicer, 2018). However, there is no consistent proof of the predictive ability of any morphokinetic parameter or algorithm (Reignier et al., 2018) for the genetic status of embryos. Eeva Test was not able to identify embryos with higher chances of being euploid, the euploidy rate between Eeva categories not being statistically different, and neither was the ORs of the different categories in the GEE model for prediction of the euploidy status. However, that lack of statistically significance is also likely to be associated with the smaller sample size of the PGT-A subgroup.
External validations like this study are necessary for confirming reproducibility of the evaluation systems, and many papers have failed to obtain satisfactory results when applying selection algorithms developed in other clinics. Barrie et al. (2017) assessed the efficacy of different classification algorithms for implantation prediction with little success. This highlighted the need for in-house validation at each clinic before routinely applying any externally developed algorithm to determine whether they perform in the new context. Adolfsson and Andershed (2018) attempted to validate Meseguer et al. (2011) algorithm without success, stating that the lack of reproducibility could be due to the different protocols followed (including stimulation protocols, use of conventional IVF instead of ICSI, and different oxygen levels), reflected by generally faster embryo divisions. This phenomenon is associated with the conditional variables that shape the context of each particular dataset, including patient characteristics, laboratory protocols, and even environmental parameters. To develop a generally applicable algorithm, all these confounders should be considered (Meseguer and Valera, 2021).
The Eeva Test takes a small step into this direction by including patient age in the algorithm, as it is widely recognized that increased maternal age is associated with a decline in the reproductive capacity (Van Noord-Zaadstra et al., 1991). In addition, oocyte provider's age has been proven as the variable with most relevance for embryo development due to accumulation of genetic and metabolic alterations, which are directly reflected in lower success rates, usually compensated with multiple embryo transfers (Wright et al., 2005; Tatone et al., 2008). Hence, the necessity of assessing and including patient-related confounders such as oocyte age into predictive algorithms has been raised as a source of variability affecting reproducibility of a model in other clinics (Barrie et al., 2021). Statistical analyses of this study were performed using GEEs, which consider several events as intra-patient variables. This way the model considers the relation between embryos that share the same patient background characteristics, adding one more layer to consideration of the intra-dataset context of measured confounders. Other relevant variables for embryo development and cycle outcomes were considered separately in the models as possible measured confounders. In addition, unmeasured confounders were also considered by reporting the E-value of every OR association. It is also worth noting that the morphokinetic parameters included in the Eeva Test are relative timings, thus avoiding the variability associated with time gap between finishing the fertilization procedure and starting the time-lapse recording.
One source of variability in this study is the difference in embryo culture protocols, including the use of different incubators, culture dishes, and media. Specifically, embryos in a box incubator were cultured in sequential media, whereas embryos in a time-lapse incubator were cultured in single-step media, thus taking full advantage of time-lapse technology to avoid excessive handling. The reason behind this approach was our aim to validate the same latest Eeva algorithm, present in two versions of the Eeva Test software, in different settings. Although systematic reviews have failed to find statistical differences in clinical outcomes between the type of incubators or culture media (Sfontouris et al., 2016; Dieamant et al., 2017; Armstrong et al., 2019), recently published randomized control trials suggest that culture in a time-lapse system might be associated with improved blastocyst formation and implantation potential (Kermack et al., 2022; Zhang et al., 2022). Given that possible association, we considered these potential confounders as an additional variable in our statistical analyses. This variable summarizes three conditions: incubator, culture media, and the Eeva Test® version. The ‘culture strategy’ variable was statistically significant in the GEE models for live-birth prediction, showing that embryos cultured in Geri+ with single-step medium and evaluated through Geri Connect and Assess (CS2) had a higher likelihood of achieving live birth, which is in line with previous results from our laboratory, where higher implantation and ongoing pregnancy rates were achieved with this culture strategy (Albert et al., 2021).
Another important feature in the latest versions of Eeva Test is the inclusion of five categories instead of three as in the earlier versions, potentially improving the sensitivity of the test. Indeed, the OR obtained when comparing the superior and inferior scores was higher than those obtained by Aparicio-Ruiz et al. (2016) with the previous version of the Eeva Test. This notion should also apply to the traditional morphological evaluation used for comparison in this study, counting with three categories as well. However, it was only true when considering live-birth prediction but not for implantation. The comparison between the superior (A) and inferior (C) morphological categories showed a similar increase in the odds of implantation (OR = 3.155) than the comparison of the superior (1) and inferior (5) Eeva Test scores (OR = 2.920). This might be a reflection of the different distribution of scores/grades assigned by the two models. The different distribution of the grades given by an algorithm reflects the approach with which they perform the selection. A distribution with lower number of embryos assigned the top grading is typical of algorithms that prioritize sensitivity (true positive rate) over specificity (true negative rate). The focus of these algorithms is selecting only the best embryos that will have a very high success rate. On the other hand, algorithms that prioritize specificity aim to only discard events with very little chances of success. Attending the distribution of the grades assigned by ASEBIR classification, the model has a very high sensitivity, so embryos with very high potential are identified with the best grade (A), but these embryos represent a very small proportion of the population. However, this model gives a B grade to almost 30% of the embryos, meaning that it is less sensitive for discriminating embryos with more average quality. On the other hand, the more even distribution of the Eeva scores makes it a well-balanced algorithm, specially aiming to discern between embryos in the middle of the spectrum. It does not improve the selection of top-quality embryos, but it provides higher level of discrimination between embryos with average grading, aiding in the choice between them.
Another possible limitation of the study is its retrospective nature. However, the large sample size and solid statistical analysis overcome this limitation to a certain extent. The intention of the study is to demonstrate the ability of an automated embryo score to identify blastocysts with different implantation potential reducing human intervention, which is achieved through this design. The potential effectiveness of the algorithm to improve the reproductive outcome remains to be elucidated through a prospective randomized study, but the enrolment of enough patients to demonstrate such improvement would make this endeavour unviable.
Eeva Test represents an approach for the introduction of some level of automation into embryo selection procedure using automatically annotated morphokinetic variables to avoid human-associated variability. However, two variables considered by the algorithm, Day 3 cell count and maternal age, must be manually introduced by the embryologists, although only Day 3 cell count is likely to present any degree of interobserver or intraobserver variability. In addition, the results proved that, for achieving the best performance, the algorithm should be combined with blastocyst morphological assessment, limiting the benefit provided by the automation. Another possible limitation could be associated with automatic annotations of morphokinetic event timings, the performance of automatic annotations provided by Eeva Test having been previously questioned (Kaser et al., 2017). In this study, the automatic annotations were not validated as the aim was validating the performance of the whole system.
Finally, in a global perspective, the relative automation provided by software such as the Eeva Test is becoming less relevant, as automation is reaching a new level with new generation models generated by artificial intelligence. These completely automatic models are debunking the clinical applicability of all selection algorithms based on morphokinetic annotations. These models use machine learning or deep learning tools to analyse time-lapse images or videos, to predict varying outcomes, fully automating embryo evaluation with high precision. Examples of these models are the iDAScore (Vitrolife, Sweden; Berntsen et al., 2022) for implantation prediction or Life Whisperer (Life Whisperer Diagnostics, USA; Diakiw et al., 2022) for euploidy prediction. These tools are still a novel approach, not fully extended to many IVF laboratories, but they have potential to usurp the clinical applicability of selection algorithms based on morphokinetic annotations in a near future.
Conclusion
In summary, these results confirm the efficacy of the Eeva algorithm in an external dataset in two different culture systems and two versions of the test, showing higher performance than the previous versions of the test for blastocyst and implantation prediction, as well as even higher performance for live-birth prediction. The highest AUCs were achieved when combining morphological evaluation and the Eeva Test® classification, but the improvement over exclusively morphological evaluation was not statistically significant. The association between the Eeva classification and implantation and live-birth potential was only observed in cycles without PGT-A. The results also failed to show an association between Eeva Test® scores and euploidy. In conclusion, Eeva Test® is a useful tool providing complementary information to the traditional morphological evaluation in two different culture strategies. It also offers automation to the time-consuming process of morphokinetic evaluation and annotation and objectivity to the embryo selection procedure, thus reducing human-associated variability. Overall, the combined use of the automatic morphokinetic algorithm and morphological scoring could improve implantation and live-birth rates and increase the success rates of assisted reproduction cycles.
Data availability
The data underlying this article will be shared on reasonable request to the corresponding author.
Acknowledgements
The authors acknowledge all embryologists and technicians of the clinic.
Authors’ roles
Among the authors named for this work, M.M. was responsible of the conception of the work. All authors contributed to the design and fulfilment of the study and to the literature review for the manuscript. Embryo evaluation and data collection were performed by B.A.-R., S.P.-A., and L.R. Data preparation and statistical analysis were performed by M.A.V. and M.M. The first draft of the article was written by M.A.V. and B.A.-R. All authors provided scientific advice and feedback for the different versions of the article. All authors meet the International Committee of Medical Journal Editors (ICMJE) criteria for authorship for this article, take responsibility for the integrity and accuracy of the presented results, and have read and given approval for the final article.
Funding
This research was supported by Agencia Valenciana de Innovació and European Social Fund (ACIF/2019/264 and CIBEFP/2021/13).
Conflict of interest
In the last 5 years, M.M. received speaker fees from Vitrolife, Merck, Ferring, Gideon Richter, Angelini, and Theramex and B.A.-R. received speaker fees from Merck. The remaining authors have no competing interests to declare.
