


Abstract
Is parents’ age at birth associated with daughters’ fecundability?
Daughters born to mothers <25 years or fathers ≥35 years had slightly lower fecundability.
Two recent studies reported lower fecundability in women born to mothers <20 years, which may be partly due to daughters of young mothers being less likely to plan their pregnancies.
A retrospective cohort study of 58 496 pregnancy planners (4290 of whom conceived with treatment) and 14 194 non-planners enrolled in the Norwegian Mother, Father and Child Cohort Study (MoBa) between 2000 and 2008, linked with the Medical Birth Registry of Norway.
Participants were born in Norway between 1967 and 1990. We estimated fecundability ratios (FRs) and 95% CI as a function of both parents’ (F1) age at the daughter’s (F2) birth among non-treated planners and the relative risk of time to pregnancy (TTP) ≥12 months or treatment among all planners. We explored whether daughters of young mothers were under-represented among planners, compared with the underlying population. Finally, we estimated FRs after adding non-planners, randomly assigned to conceiving in the first cycle with probabilities of 0.60 and 0.70.
For both mother and father, the reference category was 25–29 years. Fecundability was slightly lower among daughters of older fathers (FRs (95% CI): 0.95 (0.92, 0.98) for F1 father’s age 35–39 years and 0.93 (0.89, 0.97) for ≥40 years) and daughters of young mothers (0.92 (0.89, 0.96) for F1 mother’s age <20 years and 0.97 (0.95, 0.99) for 20–24 years). Results were similar for the composite outcome TTP ≥ 12 months or treatment, although driven by TTP ≥ 12. Compared with Norwegian-born women with ≥1 pregnancy, planners born to mothers <20 years were underrepresented. Including non-planners with very high fecundability weakened the association with mother’s age <20 years.
This was a pregnancy cohort with retrospectively reported information on planning and TTP. Selection bias appears unlikely to fully explain the association with mother’s age <20 years.
Daughters of young mothers or older fathers may have slightly lower fecundability. If corroborated, the finding about older paternal age is relevant, given the widespread tendency to delay childbearing.
This work was partly funded by the Research Council of Norway (project no. 320656), and through its Centres of Excellence funding scheme (project no. 262700). M.C.M. has received funding from the European Research Council (ERC) under the European Union’s Horizon 2020 research and innovation programme (grant agreement no. 947684). No competing interests.
N/A.
Introduction
Fetal life is a critical period for establishing reproductive potential (Evans et al., 2012; Aiken et al., 2013; Nelson et al., 2013; Depmann et al., 2015). Even as couples increasingly delay childbearing (Mills et al., 2011; Schmidt et al., 2012; Mathews and Hamilton, 2016; Daniluk and Koert, 2017; Ely and Hamilton, 2018), few studies have explored the implications for offspring fecundability. Although some evidence suggests that daughters of older mothers are more likely to have fewer children (Smits et al., 2002; Gillespie et al., 2013; van den Berg et al., 2021) and to remain childless (Smits et al., 2002; Basso et al., 2018), only one study, of 19th century women in Canada (Smits et al., 1999), reported an association between older mother’s age and lower daughter’s fecundability (the probability of conceiving in a given cycle). Conversely, two recent studies of North American women reported lower fecundability only among daughters of mothers <20 years (Reynolds et al., 2020; Basso et al., 2021). In a British study, no association was found between age of both parents (<30 and ≥30 years) and offspring fecundability (Joffe and Barnes, 2000).
As couples not trying to conceive cannot reliably report time to pregnancy (TTP, the time it takes for a couple to conceive while actively trying), non-planners are generally excluded from studies of fecundability. However, if the exposure of interest is associated with a higher probability of unplanned pregnancy in the underlying population, analyses restricted to planners may yield biased estimates, because the most fertile among the exposed conceive without planning. This form of selection bias, termed ‘planning bias’ (Baird et al., 1994; Weinberg et al., 1994), may partly explain the association between young maternal age and lower daughter’s fecundability (Basso et al., 2021), as daughters of young mothers are more likely to have unintended pregnancies at a young age (Meade et al., 2008; Lehti et al., 2012) and may thus be underrepresented in studies of planners. The Norwegian Mother, Father and Child Cohort Study (MoBa), which comprises planned and unplanned pregnancies, provides the opportunity to investigate the association of parents’ age with daughters’ fecundability while simultaneously exploring the potential for planning bias.
Materials and methods
Study population
MoBa is a population-based pregnancy cohort study conducted by the Norwegian Institute of Public Health. Participants were recruited from all over Norway between 1999 and 2008 at the time of the routine ultrasound (at 15–18 weeks of pregnancy). Women consented to participation in 41% of the eligible pregnancies. The cohort now includes 114 500 children, 95 200 mothers and 75 200 fathers (Magnus et al., 2006, 2016). The current study is based on version 12 of the quality-assured data files released in 2019, linked with The Medical Birth Registry (MBRN), a national health registry, established in 1967, which contains information on all pregnancies lasting ≥12 weeks (Irgens, 2002; NIPH, 2016).
Female participants (F2) were eligible if they answered the second or later version of the recruitment questionnaire, were born in Norway after the MBRN was established, had information on their mother’s age at birth, and were ≥18 years old at recruitment. We excluded pregnancy planners who did not report TTP (unless they had received fertility treatment) and considered as non-planners those who had conceived while using contraception, even if they had reported planning the pregnancy. We only retained the first eligible pregnancy for each participant, to avoid oversampling women with higher fecundability (Supplementary Fig. S1).
Ethics approval
The establishment of MoBa and the initial data collection were based on a license from the Norwegian Data Protection Agency and the approval from The Regional Committees for Medical and Health Research Ethics. The MoBa cohort is currently based on regulations concerning the Norwegian Health Registry Act. The current study is part of a project approved by The Regional Committees for Medical and Health Research Ethics (approval no. 2014/404) and was approved by the Institution Review Board of the McGill University Health Center.
Exposure, outcome, and covariates
Parents’ (F1) age at the participants’ (F2) birth was derived from the MBRN, linked through the unique identifier assigned to all Norwegian residents. We categorized F1 father’s age as <25, 25–29 (reference), 30–34, 35–39, and ≥40 and F1 mother’s age as <20, 20–24, 25–29 (reference), 30–34, and ≥35 years.
We considered as ‘planners’ participants who replied affirmatively to the question ‘Was this pregnancy planned?’ (including 90 who checked both ‘yes’ and ‘no’) and who either reported fertility treatment or answered the question ‘How many months did you have regular intercourse without contraception before you became pregnant?’. Responders could choose between ‘less than 1 month’, ‘1–2 months’ and ‘3 months or more’. Those taking >3 months were further asked the number of months. We assigned a TTP of 1, 2, and 3 months, respectively, to those who checked the first, second, and third option without providing the number of months.
We corrected TTP downwards if women reported having stopped using the pill during TTP or when their TTP clearly overlapped with a prior pregnancy lasting at least 6 weeks (we used this threshold because many women would miss such losses unless they paid close attention). For pregnancies not included in the MBRN (most spontaneous and induced abortions), we only knew the year in which the pregnancy had started and duration of gestation. In these instances, we conservatively assumed that the pregnancy had begun on January 1 of that year. (Only TTPs ≥4 months were corrected).
We examined F1 mother’s and father’s age in the same model, with age 25–29 years as the reference for each parent. As main confounders we included F2 participant’s birth order (whether she was the mother’s first born child, from the MBRN) and whether the F1 mother smoked while pregnant with F2 (as proxy for F1 pre-conception smoking, from the MoBa questionnaire), as both factors could influence parents’ age at conception and, potentially, daughter’s fecundability (Ye et al., 2010; Toriola et al., 2011). In sensitivity analyses, described below, we included additional covariates that, although not confounders, may be associated with parents’ age at birth and fecundability.
Statistical analysis
We assessed the quality of TTP among planners who conceived without treatment, visually and by comparing the observed distribution with a simulated TTP distribution based on 500 000 couples trying for up to 36 cycles. We used a log-linear model to estimate the parameters of the beta distribution of fecundability from our data (Weinberg and Gladen, 1986).
We imputed missing values for paternal age and other covariates (including ‘don’t know’ answers for F1 mother’s smoking while pregnant, see Table I for the % of missing) using multiple imputation by chained equations (MICE, 10 imputed datasets).
Characteristics of participants in analysis sample for a study of parents’ age at birth and daughters’ time to pregnancy.
| F1 mother's age at F2 participant's birth (years) | ||||||||||
|---|---|---|---|---|---|---|---|---|---|---|
| <20 | 20–24 | 25–29 | 30–34 | ≥35 | ||||||
| Planners | Non- planners | Planners | Non- planners | Planners | Non- planners | Planners | Non- planners | Planners | Non- planners | |
| n | 4651 | 1552 | 20 677 | 5264 | 20 272 | 4568 | 8995 | 1914 | 3901 | 897 |
| % | % | % | % | % | % | % | % | % | % | |
| Factors at F2 birth and puberty | ||||||||||
| F1 father's age (years) | ||||||||||
| ≤24 | 81.4 | 80.5 | 43.8 | 44.6 | 5.4 | 6.1 | 0.7 | 1.2 | 0.1 | 0.5 |
| 25–29 | 14.0 | 13.7 | 46.7 | 44.9 | 55.2 | 53.1 | 10.5 | 11.8 | 1.4 | 2.1 |
| 30–34 | 2.0 | 2.3 | 7.3 | 7.6 | 31.5 | 32.2 | 49.6 | 47.5 | 10.9 | 11.4 |
| 35–39 | 0.3 | 0.7 | 1.2 | 1.5 | 6.1 | 6.4 | 28.6 | 29.7 | 36.9 | 36.9 |
| ≥40 | 0.2 | 0.2 | 0.5 | 0.7 | 1.6 | 2.0 | 10.4 | 9.7 | 50.6 | 48.9 |
| Missing | 2.1 | 2.7 | 0.5 | 0.7 | 0.2 | 0.2 | 0.2 | 0.2 | 0.1 | 0.2 |
| F2 was mother’s first child | 92.5 | 92.6 | 61.9 | 60.9 | 33.1 | 30.8 | 14.3 | 13.5 | 10.1 | 8.7 |
| F1 smoked while pregnant with F2 | ||||||||||
| Yes | 41.8 | 42.2 | 29.9 | 34.3 | 21.4 | 25.4 | 17.5 | 20.0 | 14.9 | 19.0 |
| Don’t know | 13.6 | 14.8 | 9.8 | 10.5 | 8.5 | 9.9 | 8.1 | 8.7 | 7.5 | 8.8 |
| Missing | 2.8 | 3.3 | 2.6 | 2.7 | 1.9 | 1.9 | 1.8 | 2.3 | 1.5 | 1.7 |
| F2 birthweight (grams)a | ||||||||||
| <2000 | 1.2 | 0.9 | 0.8 | 1.0 | 0.8 | 0.9 | 1.0 | 1.0 | 1.2 | 0.9 |
| 2000–2499 | 3.4 | 3.9 | 2.4 | 2.7 | 2.2 | 2.5 | 2.5 | 2.4 | 3.0 | 3.0 |
| 2500–2999 | 15.1 | 14.8 | 13.1 | 13.5 | 11.3 | 11.3 | 10.8 | 12.0 | 10.6 | 14.1 |
| 3000–3999 | 69.7 | 71.2 | 71.6 | 70.3 | 71.1 | 70.3 | 69.0 | 67.1 | 66.9 | 61.5 |
| ≥4000 | 10.5 | 9.1 | 12.0 | 12.4 | 14.5 | 14.9 | 16.6 | 17.4 | 18.3 | 20.2 |
| F2 age at menarche (years) | ||||||||||
| <11 | 12.5 | 16.4 | 11.2 | 12.5 | 11.3 | 12.0 | 11.5 | 13.0 | 11.2 | 11.5 |
| 12–14 | 75.4 | 72.9 | 74.8 | 74.2 | 74.1 | 74.5 | 74.5 | 74.8 | 74.8 | 77.2 |
| ≥15 | 10.8 | 9.2 | 12.8 | 12.1 | 13.2 | 12.2 | 13.0 | 11.1 | 12.7 | 10.5 |
| Missing | 1.3 | 1.6 | 1.2 | 1.2 | 1.4 | 1.3 | 1.0 | 1.1 | 1.3 | 0.9 |
| Factors at first interview | ||||||||||
| Irregular menstrual cyclea | 22.3 | 27.5 | 21.4 | 26.5 | 21.7 | 27.4 | 21.7 | 25.3 | 19.3 | 25.3 |
| F2 age (years) at conceptionb | ||||||||||
| ≤24 | 16.5 | 35.9 | 14.0 | 32.9 | 11.3 | 29.3 | 11.0 | 30.4 | 9.0 | 25.1 |
| 25–29 | 40.4 | 33.0 | 40.2 | 32.9 | 42.0 | 36.1 | 41.4 | 35.3 | 33.4 | 26.9 |
| 30–34 | 35.2 | 25.5 | 37.7 | 25.6 | 39.0 | 27.7 | 38.4 | 26.7 | 42.8 | 34.5 |
| ≥35 | 7.8 | 5.7 | 8.2 | 8.6 | 7.8 | 6.9 | 9.3 | 7.6 | 14.8 | 13.6 |
| Daily smoking in 3 months before conception | 25.8 | 40.0 | 18.4 | 33.8 | 15.7 | 28.6 | 15.2 | 28.0 | 14.1 | 28.2 |
| Missing | 0.8 | 1.5 | 0.9 | 1.3 | 0.7 | 1.1 | 0.8 | 1.2 | 0.5 | 1.1 |
| STIc | 21.2 | 22.9 | 19.3 | 21.0 | 19.4 | 21.9 | 18.5 | 19.5 | 18.0 | 18.4 |
| Gynecologic disordersd | 9.3 | 10.7 | 7.9 | 8.6 | 8.0 | 8.2 | 7.3 | 8.3 | 7.7 | 8.9 |
| BMI kg/m2 | ||||||||||
| <25 | 58.6 | 61.2 | 64.8 | 64.0 | 69.5 | 68.1 | 68.8 | 68.3 | 67.9 | 64.6 |
| 25–29.9 | 25.4 | 20.8 | 23.2 | 20.0 | 20.3 | 18.6 | 21.5 | 17.8 | 22.3 | 19.1 |
| ≥30 | 13.9 | 13.3 | 10.3 | 11.1 | 8.5 | 8.1 | 8.0 | 8.7 | 8.0 | 10.4 |
| Missing | 2.2 | 4.8 | 1.7 | 5.1 | 1.7 | 5.1 | 1.7 | 5.2 | 1.7 | 6.0 |
| ≥1 prior pregnancy | 69.0 | 64.9 | 64.0 | 59.0 | 57.6 | 53.9 | 56.6 | 52.9 | 60.5 | 56.9 |
| ≥1 prior birth | 55.6 | 48.4 | 50.0 | 43.6 | 43.7 | 39.4 | 42.2 | 39.1 | 47.8 | 44.3 |
| ≥1 prior induced abortion | 17.5 | 25.4 | 14.9 | 20.3 | 13.1 | 18.3 | 12.4 | 15.2 | 12.0 | 17.2 |
| Fertility treatment | 7.6 | 7.6 | 7.3 | 6.5 | 7.7 | |||||
| TTP ≥ 12 months | 9.0 | – | 7.8 | – | 7.3 | – | 7.8 | – | 8.2 | – |
| Participant's education | ||||||||||
| Junior college or less | 42.5 | 55.7 | 31.5 | 43.3 | 23.9 | 35.3 | 24.3 | 35.3 | 25.0 | 36.6 |
| 4-year college | 34.7 | 20.6 | 39.8 | 26.9 | 41.0 | 30.1 | 41.0 | 28.3 | 42.1 | 31.7 |
| Higher than 4-year college | 11.6 | 6.1 | 19.0 | 10.7 | 26.2 | 15.3 | 25.9 | 15.3 | 24.7 | 14.9 |
| Currently studyinge | 8.9 | 15.9 | 7.7 | 17.0 | 7.0 | 17.3 | 7.0 | 18.2 | 6.2 | 13.7 |
| Missing | 2.4 | 1.7 | 2.0 | 2.0 | 1.9 | 2.1 | 1.9 | 2.8 | 2.0 | 3.1 |
STI, sexually transmitted infections; TTP, time to pregnancy.
Missing values not reported in the table because <1% in any category: F2 birth weight (0.11% in planners, 0.13% in non-planners), menstrual cycle regularity (0.3% in planners, 0.5% in non-planners).
Age at starting time not used because it was not available for non-planners. Hence, we report age at conception.
STI include human papillomavirus infection (condylomas or cervical intraepithelial neoplasia), chlamydia or herpes.
Gynecologic disorders include ovarian cyst, endometriosis or infection of the ovaries or tubes.
Participants who were still studying were included in this category regardless of the achieved level.
We estimated fecundability ratios (FRs) among the 54 206 untreated pregnancy planners, using proportional probability regression models, with cycle as the unit of analysis (Weinberg and Wilcox, 2008). The FR is the ratio of the average probability of conception in a given cycle for a specified exposure level relative to the reference category (with <1 indicating lower fecundability, >1 higher). TTP was censored after 11 cycles (approximated by months). All models included F1 parents’ age, birth order, and F1 mother’s smoking in pregnancy (base model).
In sensitivity analyses, we examined whether the FRs for F1 parents’ age changed when adding factors that, despite not being confounders (and possibly being intermediates), were associated with F1 age and fecundability. We progressively added the following covariates to the base model:
+ daughter’s birthweight and age at menarche (both categorized as in Table I);
+ sexually transmitted infections, gynecologic disorders (see Table I, footnote d), pre-pregnancy BMI, and daily smoking in the 3 months before conception (categorized as in Table I)
+ participant’s estimated age at the beginning of the attempt (age at starting time, modeled as age + age squared).
The main analysis was restricted to planners who conceived without treatment as, for these participants, we did not know what time the reported TTP represented. We estimated the relative risk of the composite outcome TTP ≥ 12 months or fertility treatment in an analysis including the 4290 couples who reported fertility treatment, and then repeated the analysis without these couples for TTP ≥ 12 months as the outcome.
Additional sensitivity analyses included restricting the analysis to F2 planners (without treatment) who reported regular cycles, stratifying by F2 daughter’s age at the estimated starting time (<30 years and ≥30 years), and checking whether the estimates changed meaningfully when each parent’s age was examined separately, given the strong correlation between F1 mother’s and father’s age.
To assess how mother’s age influenced the probability of pregnancy of the daughter, and the extent of planning bias, we identified from the MBRN all girls born in Norway between 1967 and 1990 who survived until age 13 years. We reported the proportion with at least one pregnancy by 2009, by F1 mothers’ age at birth, and checked whether specific categories of F1 parents’ age were under- (or over-) represented among planners in our analysis sample, compared with Norwegian women with ≥1 pregnancy in the MBRN in 2001–2009. Lastly, we ran the base model after adding the 14 194 non-planners, randomly assigned to conceiving in the first cycle with a frequency of 60% and 70% (10 replications per target frequency). Non-planners whose first cycle did not end in a conception were censored, as if they had been lost to follow-up. TTP was not reassigned in the 10.2% of non-planners who had a non-missing value.
Results
Female participants in the analysis sample were born in Norway between 1967 and 1990. As shown in Table I, daughters of mothers <20 years were younger at conception, more likely to have been pregnant before, to have been exposed to maternal smoking in utero, to have smoked regularly before conception, and to be still studying. As shown in Supplementary Table SI, women who conceived with fertility treatment differed from untreated planners with respect to several characteristics, besides being older at conception and having lower parity.
The correlation between F1 mothers’ and fathers’ age at the participant’s birth was 0.794. Excluding F2 participants who conceived with treatment, the correlation between F1 mother’s and F2 daughter’s age at birth was 0.085 overall and 0.148 for age at first birth (F2 daughters could be at most 42 years old).
Quality of TTP
Based on when women had stopped using oral contraception, TTP was changed for 5.2% of planners; in 80% of these (2269 of 2843 instances), TTPs categorized as 2 months became 1 month. TTP was corrected downwards for an additional 1.3% because it overlapped with a prior pregnancy lasting ≥6 weeks. The parameters of the underlying beta distribution estimated from the log-linear translated into a mean fecundability of 0.333 (SD: 0.172). As shown in Supplementary Fig. S2 (red line), the distribution of the simulated TTP was reasonably close to the observed, except for the expected deficit of conceptions in the first cycle (and an excess in the second), likely because of how the TTP question was asked. There was substantial digit preference at 12 months (hence, we censored TTP at 11 months in the analyses).
Association between F1 parents’ age and daughter’s fecundability
The main analysis included 194 540 cycles. Compared with participants born to parents 25–29 years, those born to fathers ≥35 years or to mothers <20 and 20–24 years had slightly lower fecundability (Table II). Models accounting for additional risk factors, including F2 participant’s age, yielded very similar, though slightly attenuated, estimates.
FRs by F1 parents’ age at birth among pregnancy planners, crude and from models including different covariates.
| Parents’ age (years) | Age of F1 parents, no covariates | +F2 birth order, F1 mother’s smoking (base model) | + participant’s BWa, age at menarche | +STI, gyn. disorders, BMIb, smoking | + participant’s age at starting timec | |||||
|---|---|---|---|---|---|---|---|---|---|---|
| FR | 95% CI | FR | 95% CI | FR | 95% CI | FR | 95% CI | FR | 95% CI | |
| F1 father | ||||||||||
| <25 | 1.00 | 0.98, 1.02 | 1.00 | 0.97, 1.02 | 1.00 | 0.97, 1.02 | 1.00 | 0.98, 1.02 | 1.00 | 0.98, 1.02 |
| 25–29 | 1.00 | Reference | 1.00 | Reference | 1.00 | Reference | 1.00 | Reference | 1.00 | Reference |
| 30–34 | 0.98 | 0.96, 1.00 | 0.98 | 0.96, 1.00 | 0.98 | 0.96, 1.00 | 0.98 | 0.96, 1.01 | 0.99 | 0.96, 1.01 |
| 35–39 | 0.94 | 0.91, 0.97 | 0.95 | 0.92, 0.98 | 0.95 | 0.92, 0.98 | 0.95 | 0.92, 0.99 | 0.95 | 0.92, 0.99 |
| ≥40 | 0.93 | 0.89, 0.97 | 0.93 | 0.89, 0.97 | 0.93 | 0.89, 0.97 | 0.94 | 0.90, 0.98 | 0.94 | 0.90, 0.98 |
| F1 mother | ||||||||||
| <20 | 0.92 | 0.89, 0.95 | 0.92 | 0.89, 0.96 | 0.92 | 0.89, 0.96 | 0.94 | 0.91, 0.98 | 0.95 | 0.92, 0.99 |
| 20–24 | 0.97 | 0.95, 0.98 | 0.97 | 0.95, 0.99 | 0.97 | 0.95, 0.99 | 0.97 | 0.95, 0.99 | 0.98 | 0.96, 1.00 |
| 25–29 | 1.00 | Reference | 1.00 | Reference | 1.00 | Reference | 1.00 | Reference | 1.00 | Reference |
| 30–34 | 1.00 | 0.98, 1.03 | 1.00 | 0.97, 1.02 | 1.01 | 0.97, 1.03 | 0.99 | 0.97, 1.02 | 0.99 | 0.97, 1.02 |
| ≥35 | 1.02 | 0.98, 1.06 | 1.01 | 0.97, 1.05 | 1.01 | 0.97, 1.06 | 1.01 | 0.97, 1.05 | 1.00 | 0.96, 1.05 |
BW, birthweight; FR, fecundability ratio; STI, sexually transmitted infections.
Birthweight was modeled in five categories: <2000 g, 2000–2499, 2500–2999, 3000–3499 and ≥3500.
BMI is categorized as in Table I; STI include human papillomavirus infection (condylomas or cervical intraepithelial neoplasia), chlamydia or herpes; gynecologic disorders include ovarian cyst, endometriosis or infection of the ovaries or tubes.
Estimated age at starting time (i.e. at the beginning of the attempt) was modeled as age + age squared.
Results were virtually unchanged when the analysis was restricted to F2 participants with regular menstrual cycles, and similar when stratified by F2 daughter’s age at starting time, although the association with father’s age was slightly more pronounced when the daughter was ≥30 years (Supplementary Table SII). Models including only F1 father’s or mother’s age yielded similar estimates to when they were considered simultaneously, except that paternal age <25 years was associated with lower fecundability in the model without maternal age (Supplementary Table SIII).
As shown in Fig. 1, after including couples who had received treatment, only F1 father’s age ≥40 years and F1 mother’s age <20 years were associated with the composite outcome of TTP ≥ 12 months or treatment, although the trends were the same as in the main analysis. When we considered only TTP ≥ 12 months among non-treated couples, the associations were slightly stronger.
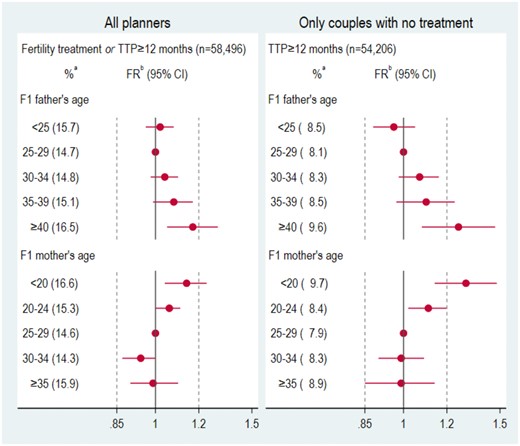
Relative risk of composite outcome (time to pregnancy ≥12 months or fertility treatment) among all planners and of time to pregnancy ≥12 months among untreated planners, by F1 parents’ age. Vertical lines drawn at 0.95 and 1.05 to facilitate visualization. RR, relative risk; TTP, time to pregnancy. aCrude percentage of outcome in each age category. bAdjusted for F2 birth order (first born or later) and whether the F1 mother had smoked while pregnant with F2.
Assessment of planning bias
Among 349 576 women born in Norway in 1967–1978, 84.2% and 81.9%, respectively, of those born to mothers aged <20 and 20–24 years had at least one pregnancy recorded in the MBRN through 2009, versus 75–77% of those born to mothers ≥25 years (Fig. 2, left panel). Among 307 524 women born in 1979–1990, who could be at most 30 years old in 2009 (median age in 2009: 24 years), 46.5% and 34.1%, respectively, of those born to mothers <20 and 20–24 years had at least one pregnancy, versus only 17.8–22.4% of those born to mothers ≥25 years (Fig. 2, right panel), indicating that daughters of mothers <25 years were substantially more likely to have pregnancies at a younger age.
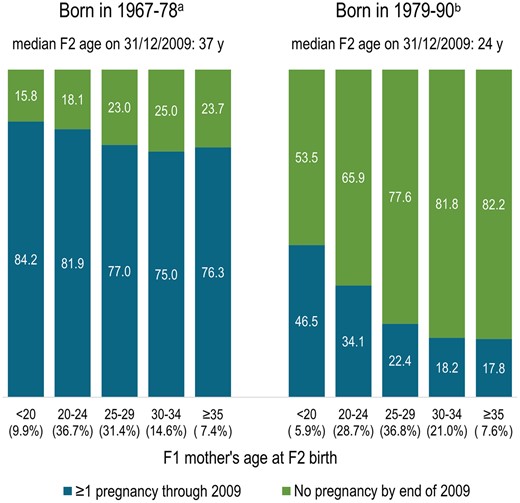
Percentage of F2 daughters born in 1967–1990 in Norway having at least one pregnancy by 2009, by F1 mother’s age at birth (Medical Birth Registry of Norway).aOf 349 576 girls born in Norway in 1967–1978 who survived to ≥13 years, 79.2% had at least one pregnancy recorded in the Medical Birth Registry through 2009. bOf 307 524 girls born in Norway in 1979–1990 who survived to ≥13 years, 26% had at least one pregnancy registered in the Medical Birth Registry of Norway through 2009.
In the subset of 265 152 women born in 1967–1990 who had at least one pregnancy in 2001–2009, 9.8% were daughters of mothers <20 years, as compared with 8.0% of planners and 10.9% of non-planners in the analysis sample (Fig. 3); the pattern was similar for daughters of fathers <25 years (Supplementary Fig. S3). F2 participants aged <25 years were substantially under-represented among planners and over-represented among non-planners (Supplementary Fig. S4).
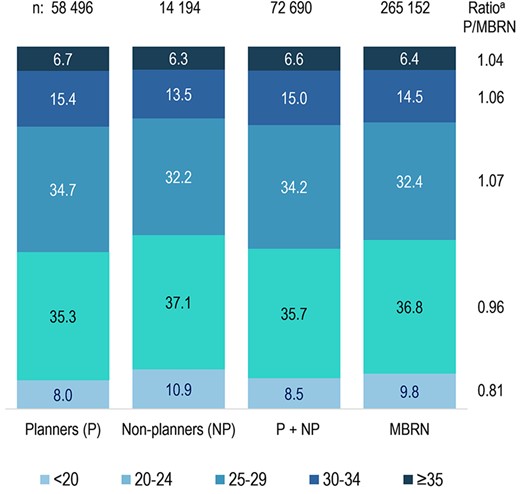
Distribution of F1 mother’s age at birth in the analysis sample and in contemporaneous Norwegian-born pregnant women. MBRN, Medical Birth Registry of Norway. a‘Ratio P/MBRN’ represents the ratio between the percent of planners (P) in the analysis sample born to mothers in each age category, divided by the corresponding percent among women in the Medical Birth Registry of Norway (MBRN) born in 1967–1990 who had ≥1 pregnancy registered in 2001–2009. A ratio <1 indicates that daughters of mothers in the age category were under-represented among planners in the analysis sample. (In the MBRN column, each woman is represented by one pregnancy. For women in the analysis sample, the pregnancy in the study was always selected. For the others, one pregnancy in 2001–2009 was randomly sampled.)
In the analysis including non-planners with high fecundability, the estimate for F1 mother’s age <20 years was attenuated by 3.5% or 4.5%, on average, depending on whether 60% or 70% of non-planners conceived in the first cycle (Fig. 4, second panel), suggesting a degree of planning bias. The estimates for the other age groups were less affected by the influx of highly fecund non-planners (Fig. 4, third to fifth panel).
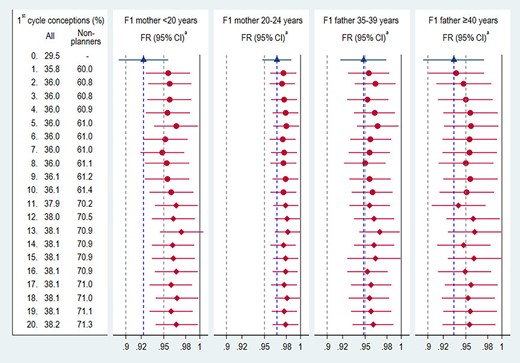
Fecundability ratios including non-planners with high assigned fecundability. FR, fecundability ratio. aAdjusted for F2 birth order (first born or later) and whether F1 mother had smoked while pregnant with F2. Estimates among planners (base model, Table II) are shown in blue. All other estimates in red were obtained from 20 regression models, sorted by the proportion conceiving in the first cycle including planners and non-planners. Non-planners with no TTP (89.8%) were randomly assigned to conceiving in the first cycle with frequency of ∼60% (circles) and ∼70% (diamonds). Estimates on the same row are from the same model (F1 father’s ages <35 years and F1 mother’s ages ≥25 years not shown).
Discussion
In this study of women recruited in the second trimester of pregnancy, daughters of young mothers (<20 and 20–24 years) or older fathers (35–39 and ≥40 years) had slightly lower fecundability than daughters of mothers ≥25 years or fathers <35 years.
The association between mother’s age <20 years and daughter’s fecundability is consistent with the findings of two recent North American studies (Reynolds et al., 2020; Basso et al., 2021). Although a study of 19th century women reported a similar association for maternal age ≤20 years, the estimate was imprecise (Smits et al., 1999). It is noteworthy that the same signal emerged from three studies with different populations and designs. Our results suggest that this association may be partly explained by planning bias, which occurs when, among planners, exposed individuals (here, daughters of mothers <20 years) appear to have lower fecundability because the most fecund had conceived without planning (Baird et al., 1994; Weinberg et al., 1994). Our study population comprised 19.5% of non-planners (20.8% excluding those with treatment), close to the 21% reported in a study of Norwegian women attending prenatal care (Lukasse et al., 2015); however, neither study included pregnancies ending in first trimester induced abortions (∼18% of recognized pregnancies in 2009–2013 (Magnus et al., 2019)). Albeit attenuated, an association with young maternal age persisted when we included in the analysis non-planners, to whom we assigned unrealistically high probabilities of first cycle conceptions (0.6 and 0.7) to partly compensate for missing unplanned pregnancies ending in induced abortions. It should also be noted that, as previously reported (Riise et al., 2016) and reiterated in this study, daughters of young mothers were more likely to have pregnancies lasting beyond the first trimester at a young age, compared with daughters of older mothers. Thus, a greater proportion of pregnancies from the latter group may be missing from our sample of non-planners, reinforcing the notion that selection bias is unlikely to fully explain the association between mother’s age <20 years and lower daughter’s fecundability. Furthermore, the estimate changed little when we accounted for factors that affect fecundability, similar to what was observed in a previous study (Basso et al., 2021). Although the added factors were not confounders, they may partially address unmeasured confounding by F1 parents’ socioeconomic status and lifestyle factors.
The biological basis for why young maternal age would affect daughter’s fecundability is unclear, although studies in cattle yielded similar findings. Angus heifers born to young dams have fewer primordial follicles (Tenley et al., 2019). In an analysis of 228 229 fertility records of UK dairy cows (Banos et al., 2007), first-born heifers born to younger dams matured earlier but required 7% more inseminations than those born to older dams, possibly as a result of competition between the fetus and a still growing mother (Banos et al., 2007). An analogous mechanism has been proposed for the worse outcomes among babies born to adolescent girls (Scholl et al., 1994; King, 2003; Wallace, 2019). Adolescent girl are more likely to be disadvantaged (Kahn and Anderson, 1992; Meade et al., 2008) and to have smaller infants (Scholl and Hediger, 1993; Scholl et al., 1994; Kaplanoglu et al., 2015). Some evidence suggests that girls born small may have smaller ovaries and higher levels of FSH (Ibáñez et al., 2000; Petraitiene et al., 2020). However, our estimates were unchanged after adjustment for participant’s birthweight.
To the best of our knowledge, only one prior study examined the association between paternal age and fecundability (Joffe and Barnes, 2000). Although no association with either parents’ age was observed, the study had limited power and only considered age ≥30 versus <30 years. Age-related increases in point mutations, DNA damage, and epigenetic modifications have been proposed as mechanisms for the higher rate of neurodevelopmental disorders in children of older men (Janecka et al., 2017; Denomme et al., 2020). The paternal epigenome plays a critical role in regulating embryo development and, in mice, advanced paternal age has been associated with dysregulation at several imprinted loci (Denomme et al., 2020) and with longer intervals between litters in female offspring (García-Palomares et al., 2009). However, parents’ age appears to not be associated with semen quality in sons (Priskorn et al., 2014).
The main strengths of this study include the ascertainment of both parents’ age through a national registry, the breadth of information from the enrollment questionnaire, and the large sample size, which provided sufficient power to examine maternal and paternal age simultaneously. Furthermore, we could compare the distribution of parents’ age in the analysis sample with that of Norwegian women with a pregnancy in the same years. The main limitation was the fact that the study was restricted to women recruited from the 18th week of pregnancy who retrospectively reported TTP (and pregnancy intention). Thus, couples who could not conceive and virtually all pregnancies ending before 18–20 weeks were excluded, limiting generalizability. However, our estimates for maternal age were qualitatively similar to those observed in a pre-conception cohort (Basso et al., 2021). The observed distribution of TTP was close to a simulated one, except for the first and second cycles (likely related to how the TTP question was asked) and an excess of reports of 12 months. Although we had few available confounders reflecting background characteristics of the F1 generation, the estimates changed little when we accounted for more proximal risk factors for subfecundity among F2 daughters. Daughter’s age at starting time was estimated using TTP, likely resulting in some error. However, most models did not include F2 age, as timing of childbearing is partly influenced by F1 mother’s age. Although factors such as smoking and BMI referred to the time around conception instead of the starting time, they were associated with lower fecundability in the expected direction. We did not have information on when couples had stopped contraception; participants were asked what type of birth control they used in the 12 months before filling out the questionnaire and whether they had used oral contraceptives in the 4 months before conception. Finally, as typically occurs in cohort studies, MoBa participants are a selected segment of the population (Nilsen et al., 2009; Biele et al., 2019), an aspect that we attempted to address in our sensitivity analyses.
In sum, young age of the mother and advanced age of the father may have a modest influence on daughters’ fecundability. At the population level, even a small decrease in fecundability can have a non-negligible impact, if the proportion of exposed is high. Thus, if corroborated, our finding regarding older paternal age is relevant, given the widespread tendency to delay childbearing (Mills et al., 2011; Schmidt et al., 2012; Mathews and Hamilton, 2016; Daniluk and Koert, 2017; Ely and Hamilton, 2018).
Data availability
Researchers who wish to access data for replication should apply through helsedata.no. Access to data requires approval from The Regional Committee for Medical and Health Research Ethics in Norway and an agreement with MoBa.
Acknowledgments
The Norwegian Mother, Father and Child Cohort Study is supported by the Norwegian Ministry of Health and Care Services and the Ministry of Education and Research. We are grateful to all the participating families in Norway who take part in this on-going cohort study.
Authors’ roles
O.B. conceived and designed the study, performed the data analysis and drafted the manuscript. M.C.M., L.A.A., and S.E.H. contributed to study design, the interpretation and discussion of the results, and the drafting of the manuscript.
Funding
This work was partly funded by the Research Council of Norway (project no. 320656), and through its Centres of Excellence funding scheme (project no. 262700). M.C.M. has received funding from the European Research Council (ERC) under the European Union’s Horizon 2020 research and innovation programme (grant agreement no. 947684).
Conflict of interest
There are no competing interests.
